



The New Zealand Dollar closed lower last week. Most of the weakness occurred in one day after the Reserve Bank of New Zealand (RBNZ) signaled that its next major policy change will be a rate cut. The announcement caught investors by surprise because at the previous monetary policy meeting, policymakers had only said that that the next move could be either up or down. Traders are now pricing in an August rate cut.
Last week, the NZD/USD settled at .6806, down -0.0069 or -1.00%.
Weekly Swing Chart Technical Analysis
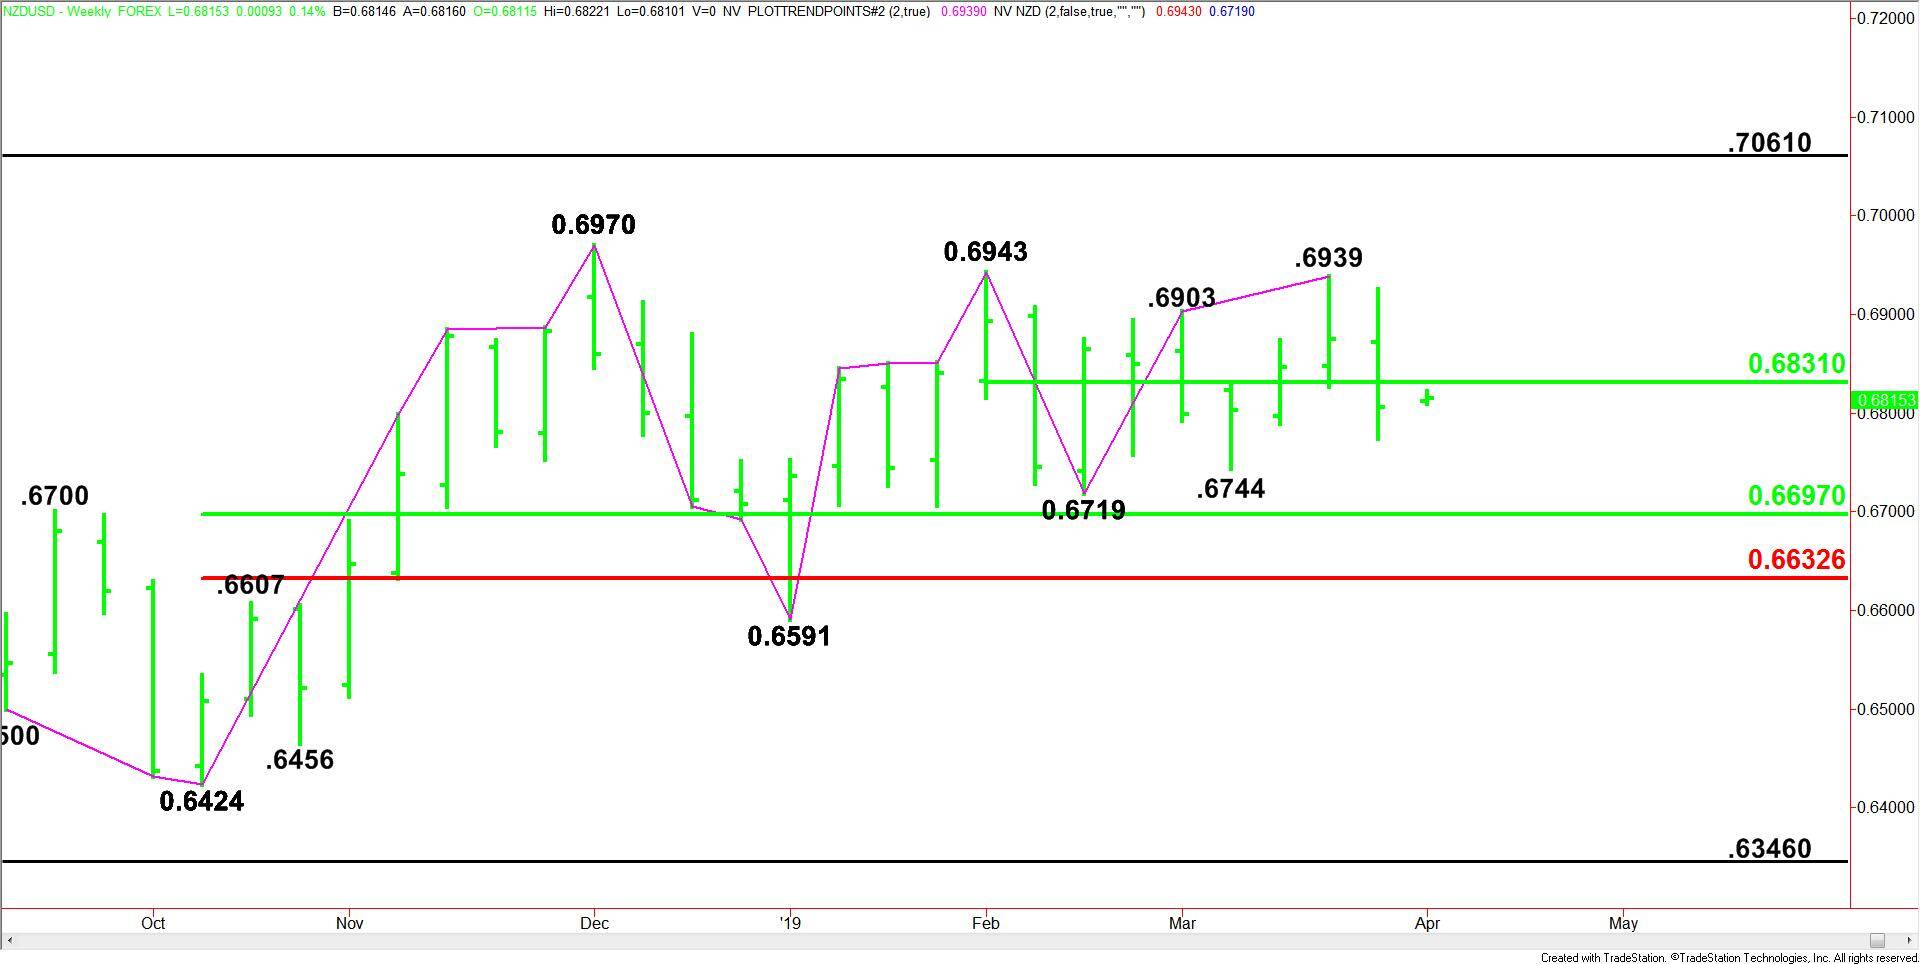
The main trend is up according to the weekly swing chart. However, secondary lower tops at .6943 and .6939 are indications of a shift in momentum to down.
A move through .6943 will signal a resumption of the uptrend. This could lead to a test of the next main top at .6970. The main trend will change to down on a move through .6719. This is followed by the next main bottom at .6591.
The main range is .6424 to .6970. Its retracement zone at .6697 to .6633 is the next downside target and potential support area.
The minor range is .6943 to .6719. Its 50% level or pivot is .6831. This zone is controlling the near-term direction of the Forex pair.
Weekly Swing Chart Technical Forecast
Based on last week’s close at .6806, the direction of the NZD/USD this week is likely to be determined by trader reaction to the short-term pivot at .6831.
Bullish Scenario
A sustained move over .6831 will indicate the presence of buyers. If this generates enough upside momentum then look for a possible extension of the rally into .6939 to .6943. Overtaking these levels could lead to a test of the major top at .6970.
Bearish Scenario
A sustained move under .6831 will signal the presence of sellers. Taking out last week’s low at .6774 could trigger an acceleration into a minor bottom at .6744. This is followed by a main bottom at .6719 and the main 50% level at .6697.
The 50% level at .6697 is the trigger point for a potential acceleration to the downside with the 61.8% level at .6633 the next target.
This Forex pair is likely to start collapsing on a sustained move under .6591.