



Geopolitical Tensions Clash With Fourth-Quarter Supply Surplus Fears
This week’s trading in WTI and Brent crude oil could center on the tug-of-war between weekend geopolitical escalations in the Persian Gulf and mounting fundamental evidence of a fourth-quarter global supply surplus.
Monday’s early mixed trade suggests traders may be pricing in Sunday’s Iranian strikes on a U.S. helicopter base in Bahrain alongside confirmed tanker and mine incidents in the Gulf. However, one reason the markets may not be taking off to the upside is the ongoing diplomacy between Tehran and Washington. We saw a little of that last week, with Iran signaling a resolution is still possible and the U.S. downplaying the need for further military strikes.
Perhaps also capping gains is the latest report from the International Energy Agency (IEA). On Friday, the IEA changed its Q4 outlook to a 1.7 million to 2 million bpd global supply surplus. The report claimed that a 2.3 million bpd jump in October world production caused the flip.
Additionally, China’s October refinery throughput dropped 8.1% year-over-year, pointing to softer crude demand from the world’s top crude importer.
Traders could also be hesitant to restart a bullish outlook because of the latest API and EIA weekly U.S. inventory reports. Last week, the EIA reported a nearly 5-million-barrel build in U.S. commercial crude stocks and record domestic output hovering near 14.01 million bpd.
This week, traders will be watching to see if domestic storage continues to refill from its multi-year October lows. Traders will also be watching refinery utilization rates and distillate stocks closely, as tight global diesel supplies have been propping up crack spreads.
Finally, the front-month WTI crude oil expiration could be a source of volatility, as could ministerial commentary from OPEC+ regarding December production quotas.
Weekly December WTI Crude Oil Futures Technical Analysis
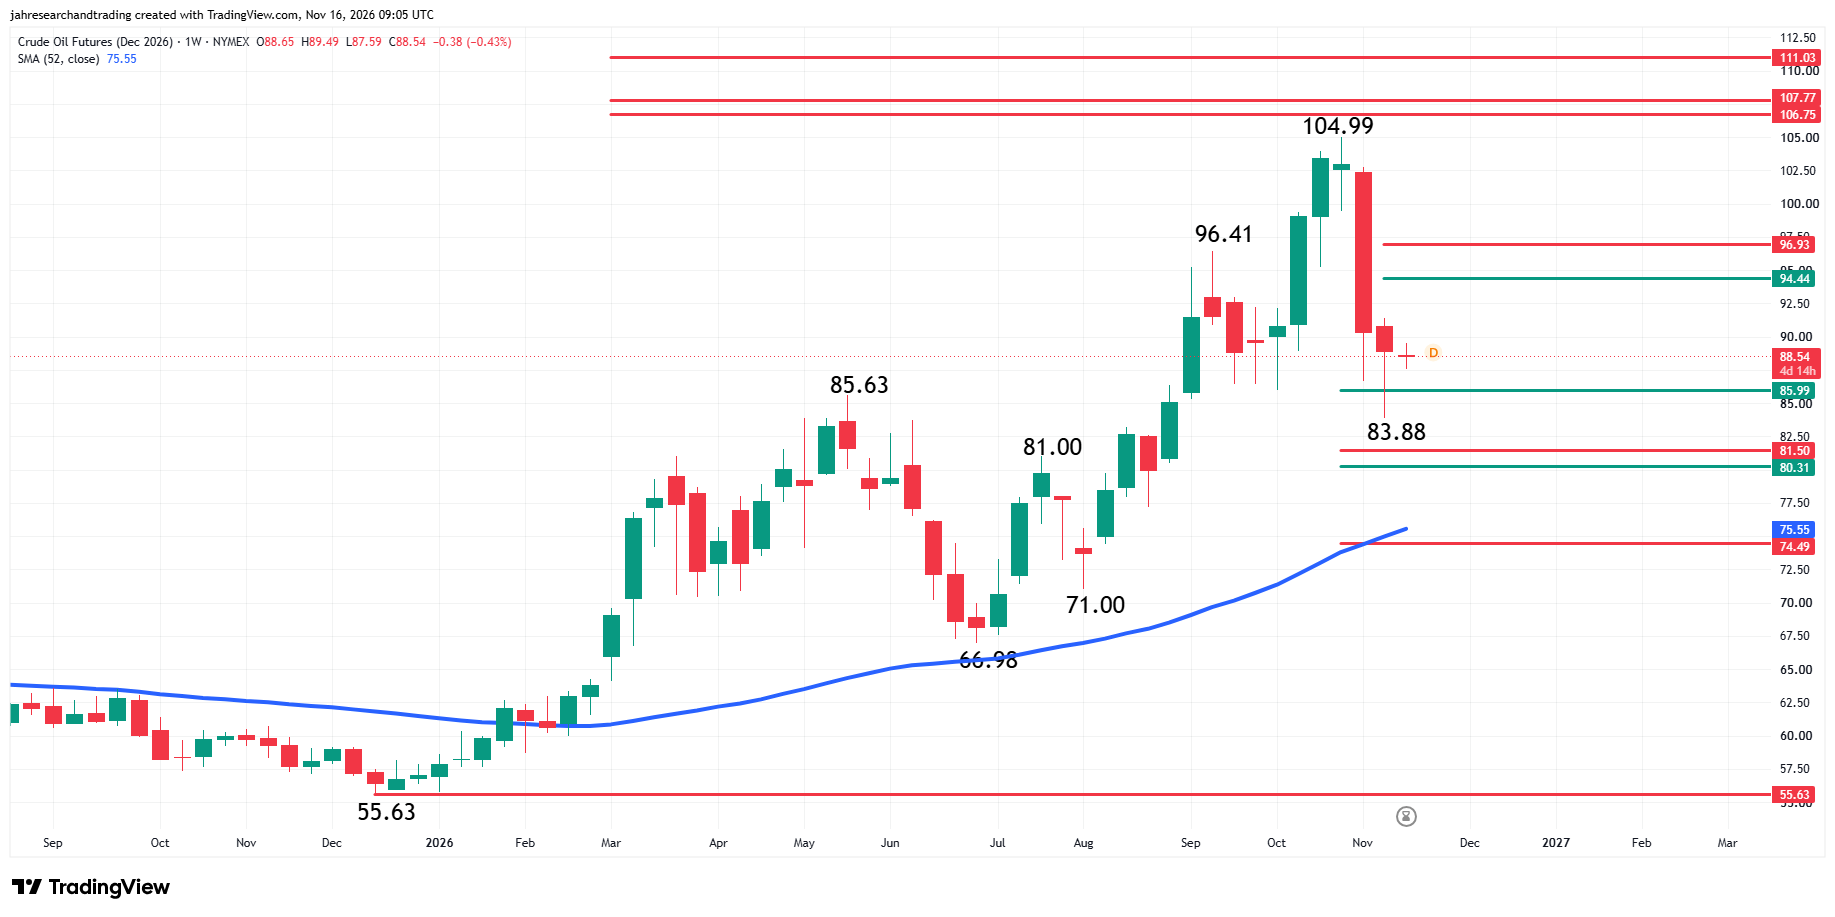
After taking out most if not all of the war premium, December WTI crude oil futures are slightly lower at the start of the week. The main trend is down according to the weekly swing chart. A trade through $83.88 will signal a resumption of the downtrend. The main trend will change to up on a breakout over $104.99.
The long-term range is $55.63 to $104.99. Its retracement zone support is $80.31 to $74.49. Inside this zone is the 52-week moving average at $75.55. This creates a tight support cluster at $75.55 to $74.49.
The intermediate range is $66.98 to $104.99. Its retracement zone at $85.99 to $81.50 stopped the sell-off last week at $83.88. The market is currently trading above this zone, making it support at the start of the week.
The new short-term range is $104.99 to $83.88. If there is a counter-trend push to the upside, the market could test its retracement zone at $94.44 to $96.93.
Over the main top at $104.99 is a series of previous long-term tops at $106.75, $107.77 and $111.03.
Brent Oil Price Forecast
Every new Brent Oil analysis as it publishes, today's technical signal and key levels, live price — on one page.
See all Brent Oil forecastsWeekly January Brent Crude Oil Futures Technical Analysis
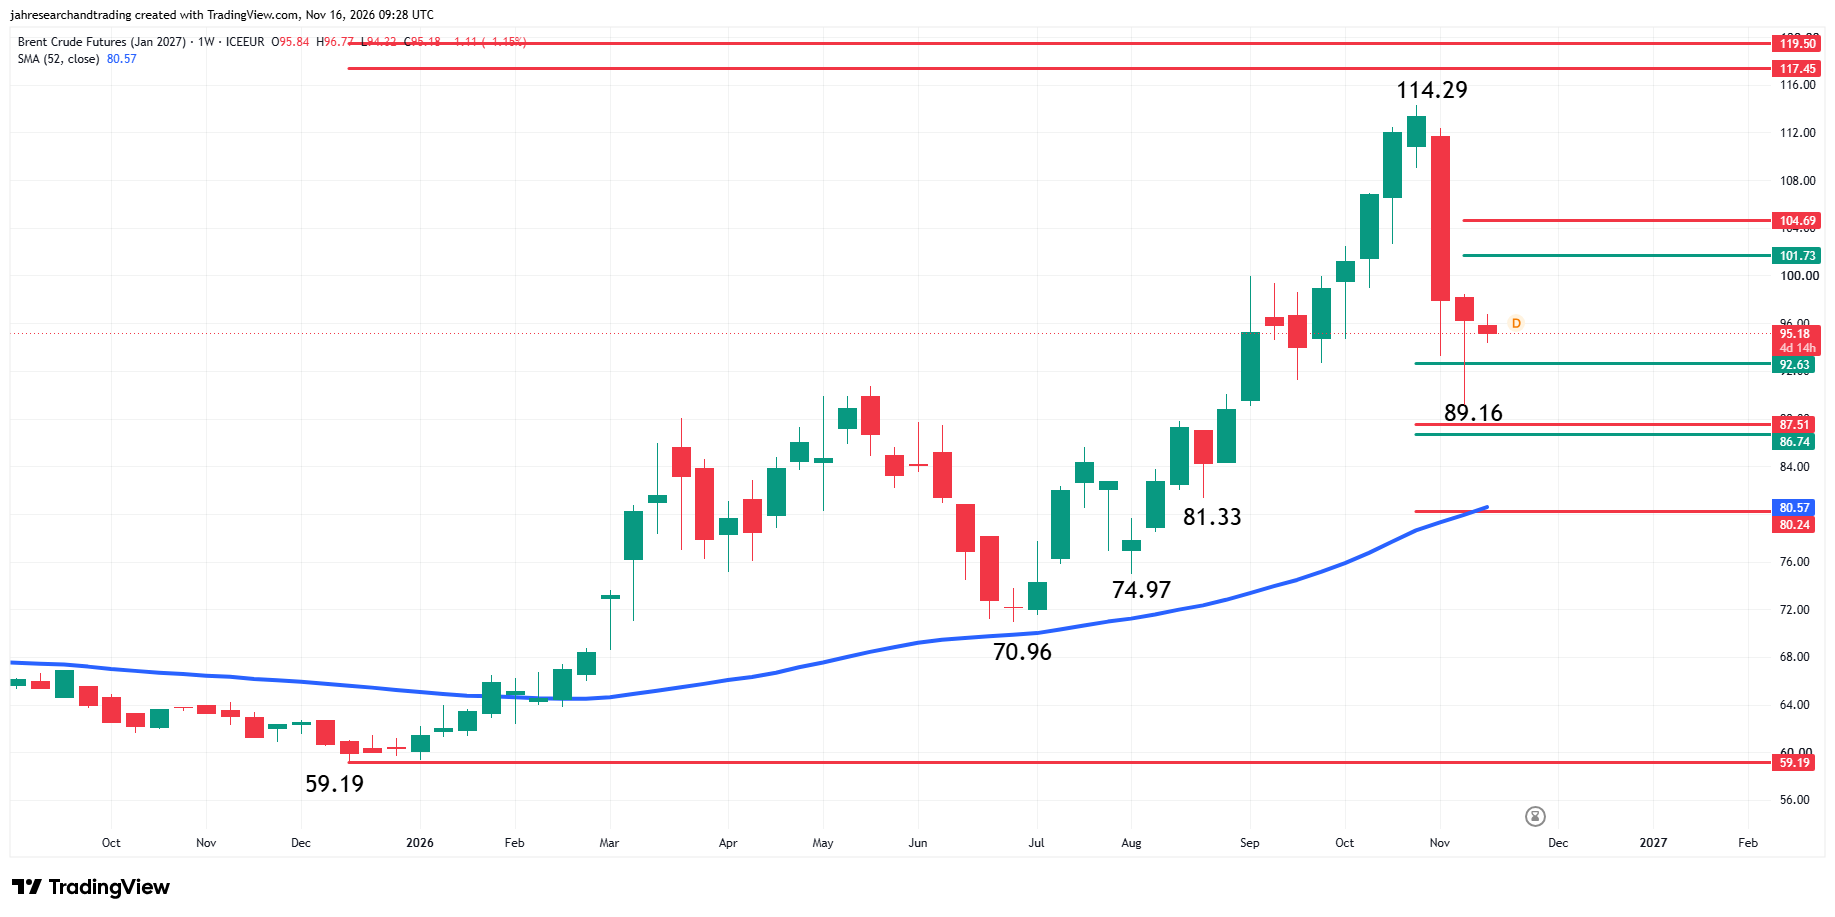
Despite the sharp two-week sell-off, the main trend is still up according to the January Brent crude oil futures weekly swing chart. The main trend will change to down if sellers can take out the last swing bottom at $74.97. A trade through $114.29 will signal a resumption of the uptrend.
The long-term range is $59.19 to $114.29. Its retracement zone at $86.74 to $80.24 is the major downside target. The 52-week moving average at $80.57 forms a tight support cluster with the long-term 61.8% level at $80.24.
The intermediate range is $70.96 to $114.29. Last week’s low at $89.16 was formed inside the intermediate retracement zone at $92.63 to $87.51. The lower or 61.8% level of this range forms a tight support cluster with the long-term 50% level at $86.74.
The new short-term range is $114.29 to $89.16. If the market can hold on the strong side of the intermediate retracement zone, it could rally into the short-term retracement zone at $101.73 to $104.69.
What to Watch
December WTI Crude Oil Futures
My bias is to the downside because of the change in trend on the weekly main swing chart, but the current price action suggests there may be a short-covering rally into the retracement zone at $94.44 to $96.93, although the broader trend would remain down.
Traders trying to press the market through $83.88 may encounter some counter-trend buyers at $81.50 to $80.31. If this fails then sellers could drive the market into the $80.31 to $74.49 retracement zone. This area may be attractive to aggressive counter-trend buyers looking for value. The next potential support area after a steep break is $75.55 to $74.49.
January Brent Crude Oil Futures
With the main trend up according to the weekly swing chart and the strong reaction to the test of the retracement zone at $92.63 to $87.51, my bias is to the upside. My next major assessment will follow a test of the short-term retracement zone at $101.73 to $104.69. A test of this area could lead to the formation of a secondary lower top or a breakout to the upside and a possible retest of the main top at $114.29.
My outlook will weaken if $92.63 fails as support. However, traders could remain in buy the dip mode if the market tests the major long-term retracement zone at $86.74 to $80.24, including the 52-week moving average at $80.57.
If you’d like to know more about how to trade crude oil, please visit our educational area.