



U.S. benchmark WTI and international benchmark Brent crude oil futures are lower on Wednesday, but prices have barely moved since the initial drop. A reported increase in U.S. crude and fuel inventories put pressure on prices, while attacks on vessels in the Strait of Hormuz and continued U.S.-Iran fighting appear to be limiting the decline.
WTI is showing more weakness than Brent. The difference between the two prices reached a two-week high on Tuesday as rising U.S. Gulf Coast inventories made it harder for American crude to compete in Asia and Northwest Europe.
According to Sparta Commodities analyst June Goh, WTI needs to fall relative to Brent to make those exports competitive again.
Inventory Reports Send Mixed Signals
On Tuesday, the American Petroleum Institute reported that U.S. crude, gasoline and distillate inventories rose last week, according to market sources.
Today’s government report showed a different result. The U.S. Energy Information Administration reported a 3.4 million barrel draw in crude inventories, compared with forecasts for a 0.4 million barrel build.
Middle East Risks Remain
Traders are also watching the attacks on ships and oil infrastructure. ADNOC L&S said a crew member was missing and others were injured after one of its vessels was attacked in the Strait of Hormuz on Tuesday.
Iran said it attacked U.S. drone and missile sites in Kuwait after a U.S. strike on Qeshm Island. Yemen’s Houthis also said they launched drones toward pumping stations along a Saudi pipeline.
Brent Oil Price Forecast
Every new Brent Oil analysis as it publishes, today's technical signal and key levels, live price — on one page.
See all Brent Oil forecastsFor now, rising Middle East exports are weighing on prices, but the risk of further attacks could help limit the downside.
Daily December WTI Crude Oil Futures Technical Analysis
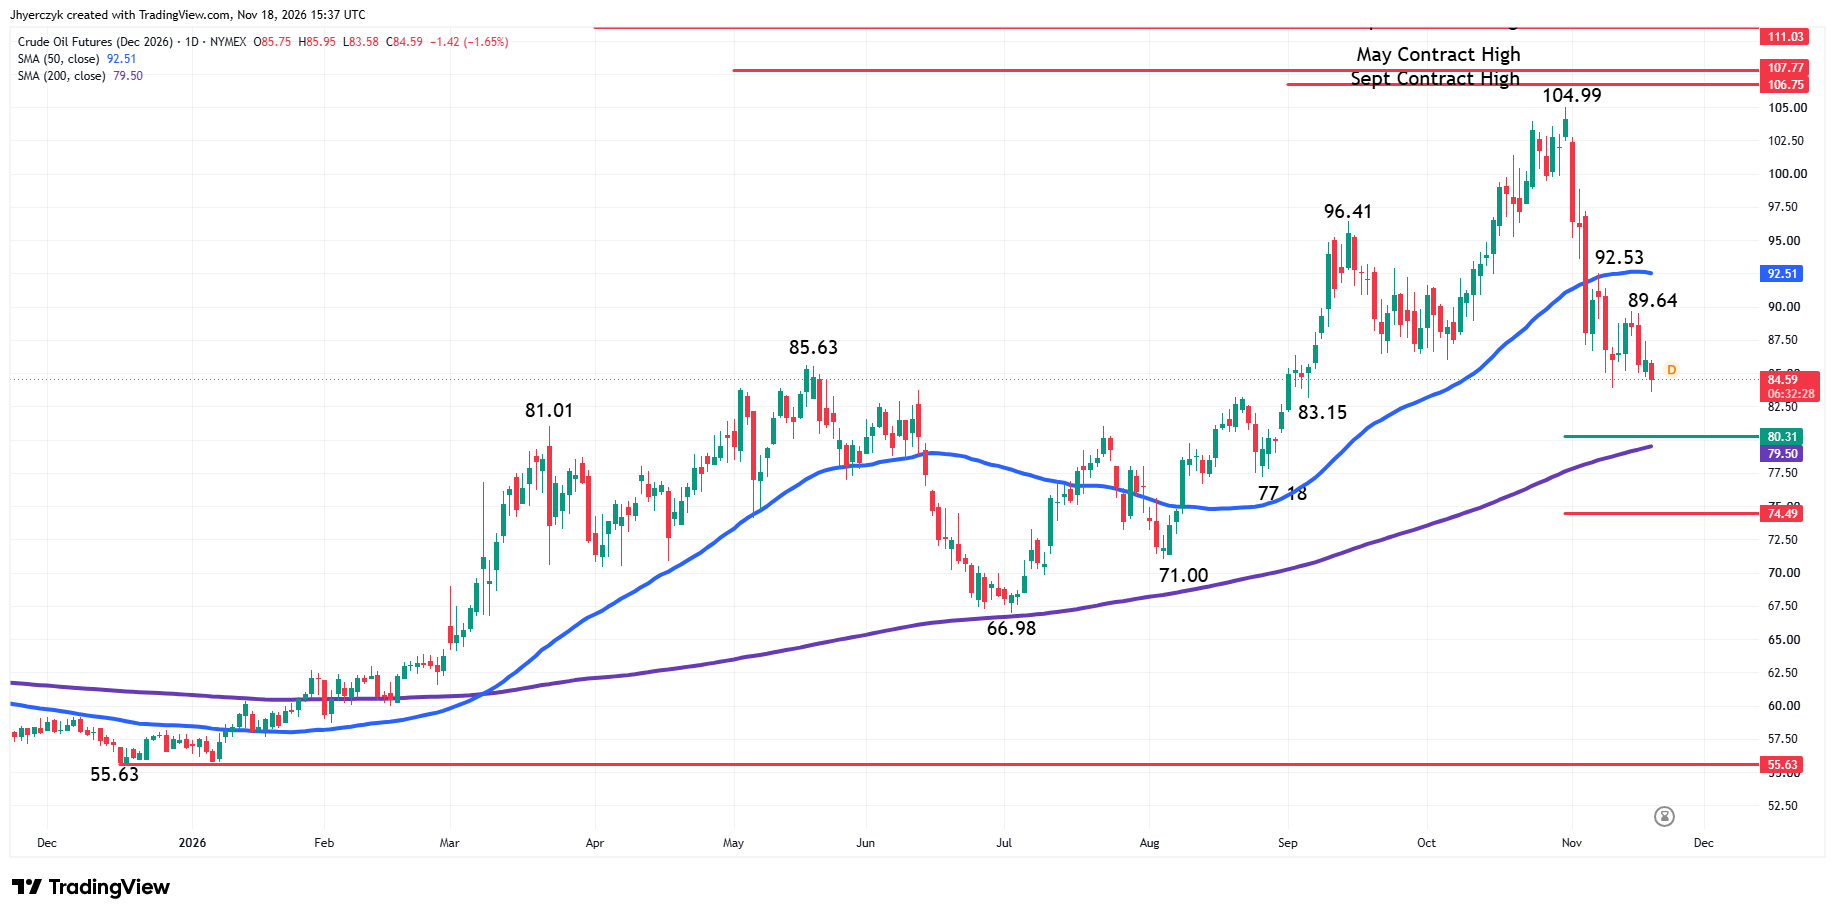
The selling resumed on Wednesday in December WTI crude oil futures after traders couldn’t sustain yesterday’s gains. The main trend is down according to the daily swing chart. A trade through the September 4 main bottom at $83.15 will reaffirm the downtrend. Taking out $89.64 will change the main trend to up.
The long-term range is formed by the December 16 main bottom at $55.63 and the October 30 main top at $104.99. Its 50% to 61.8% retracement zone at $80.31 to $74.49 is the next downside target area. Inside this zone is the 200-day moving average at $79.50.
On the upside, the 50-day moving average at $92.52 forms a tight resistance cluster with the November 6 main top at $92.53.
Daily January Brent Crude Oil Futures Technical Analysis
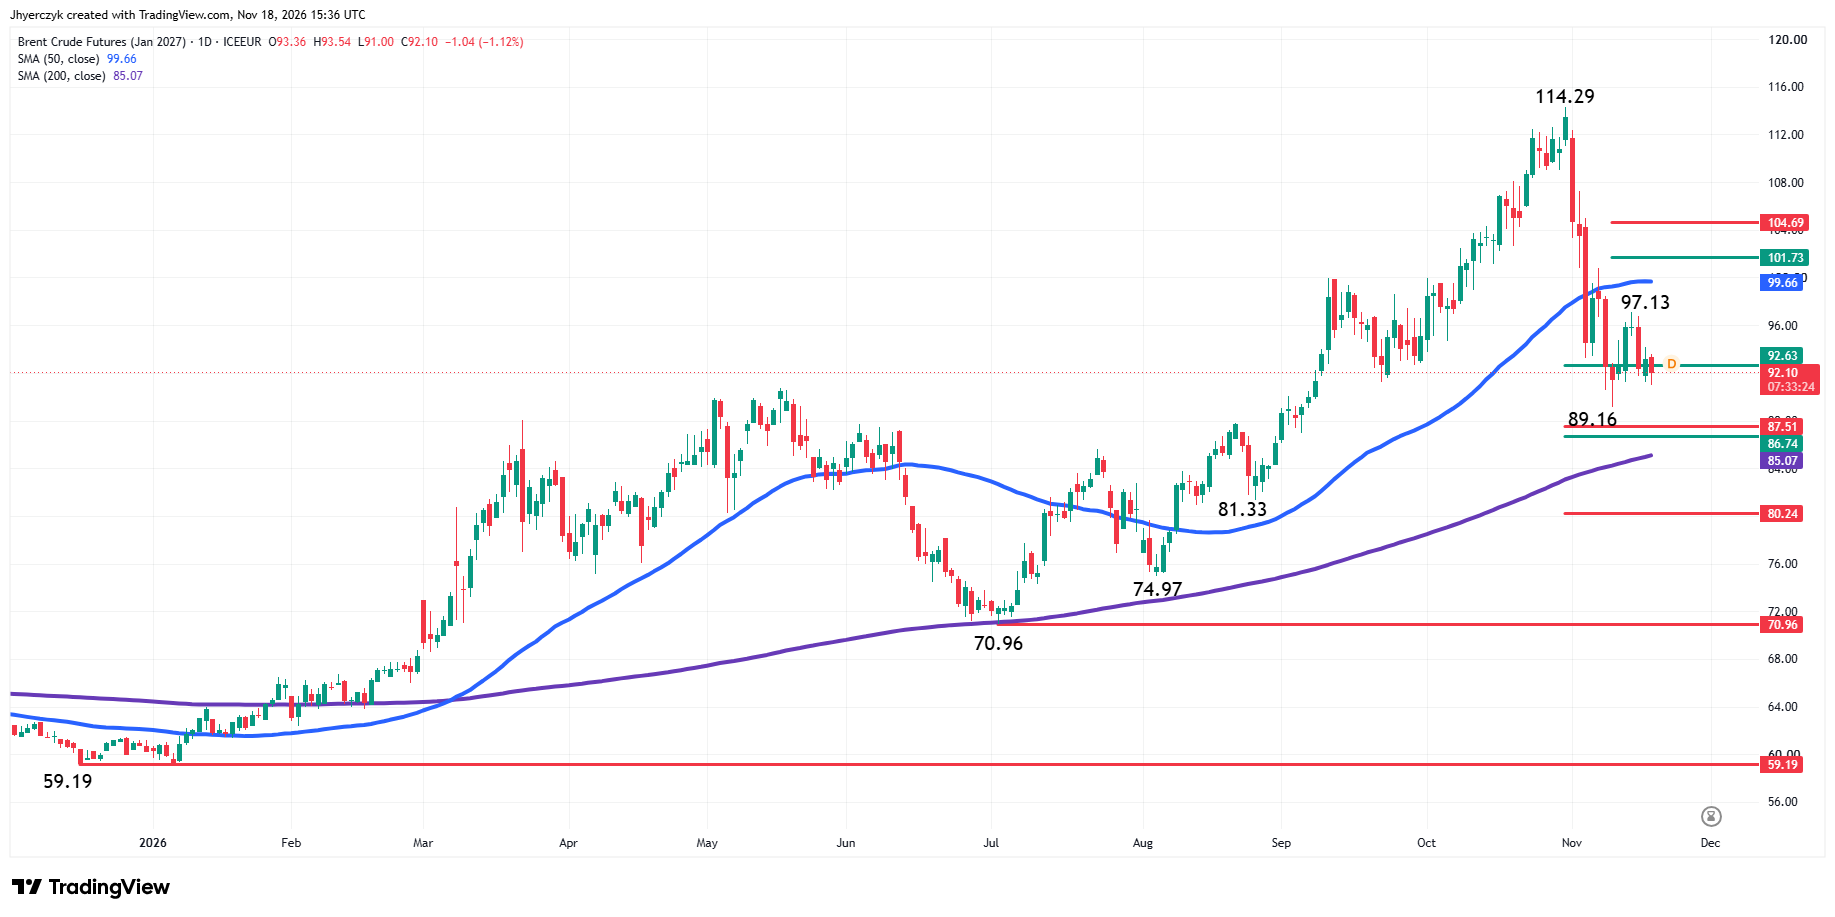
January Brent crude oil futures are trading weaker on Wednesday, but the chart pattern is holding up better than the December WTI futures contract.
The main trend is down according to the daily swing chart. A trade through the $89.16 main bottom will signal a resumption of the downtrend. The next main bottom is at $81.33. Taking out $97.13 will change the main trend to up.
The intermediate retracement zone at $92.63 to $87.51 is currently being tested. It stopped the selling at $89.16 on November 10.
The long-term retracement zone at $86.74 to $80.24 is potential support. Inside it is the 200-day moving average at $85.07.
Combining the intermediate 61.8% level at $87.51 and the long-term 50% level at $86.74 creates a support cluster.
The short-term range is $114.29 to $89.16. If the trend changes to up then its retracement zone at $101.73 to $104.69 will become the primary upside target.
What to Watch
December WTI Crude Oil Futures
With the main trend down according to the daily swing chart, my bias is to the downside. If $83.15 is taken out, I’m anticipating a possible acceleration into the long-term 50% level at $80.31, followed by the 200-day moving average at $79.50 and the long-term 61.8% level at $74.49. I will be watching for a possible technical bounce on the first test of $80.31 to $79.50.
A sustained move on the bearish side of the 200-day moving average will strengthen my outlook. A change in trend to up will shift my bias to the upside. It will strengthen if buyers can overcome and sustain a rally over the 50-day moving average.
January Brent Crude Oil Futures
With the main trend down on the daily swing chart, my bias is to the downside. It will strengthen on a sustained move under the 50% level at $92.63. This could trigger a sharp break through the swing bottom at $89.16, reaffirming the downtrend. If momentum increases on the move, then look for the selling to strengthen with the support cluster at $87.51 to $86.74 the next target, followed by the 200-day moving average at $85.07.
A sustained move over $92.63 will weaken my outlook. If this creates the momentum needed to overcome the swing top at $97.13 then my outlook will turn bullish and strengthen on a sustained move over the 50-day moving average at $99.67.
If you’d like to know more about how to trade crude oil, please visit our educational area.