



U.S. benchmark WTI and international benchmark Brent crude oil futures are lower on Wednesday as traders awaited more information on the progress of peace talks between the United States and Iran. The futures markets are trading inside yesterday’s wide range, which suggests investor indecision and uncertainty that could create a volatile trade environment.
Meanwhile, a number of Democratic victories in yesterday’s midterm elections handed control of Congress back to the Democrats, which could create a gridlock situation during the second part of President Trump’s four-year term.
Over the last two weeks, as crude oil pressed multi-month highs, the general consensus was that Trump would escalate the attacks on Iran after the midterms. However, progress in the talks, with Iran rumored to have made several key concessions, has traders anticipating a more concrete deal. This is encouraging bullish traders to take profits and erase some of the war premium that had been built up.
Daily December WTI Crude Oil Futures Technical Analysis
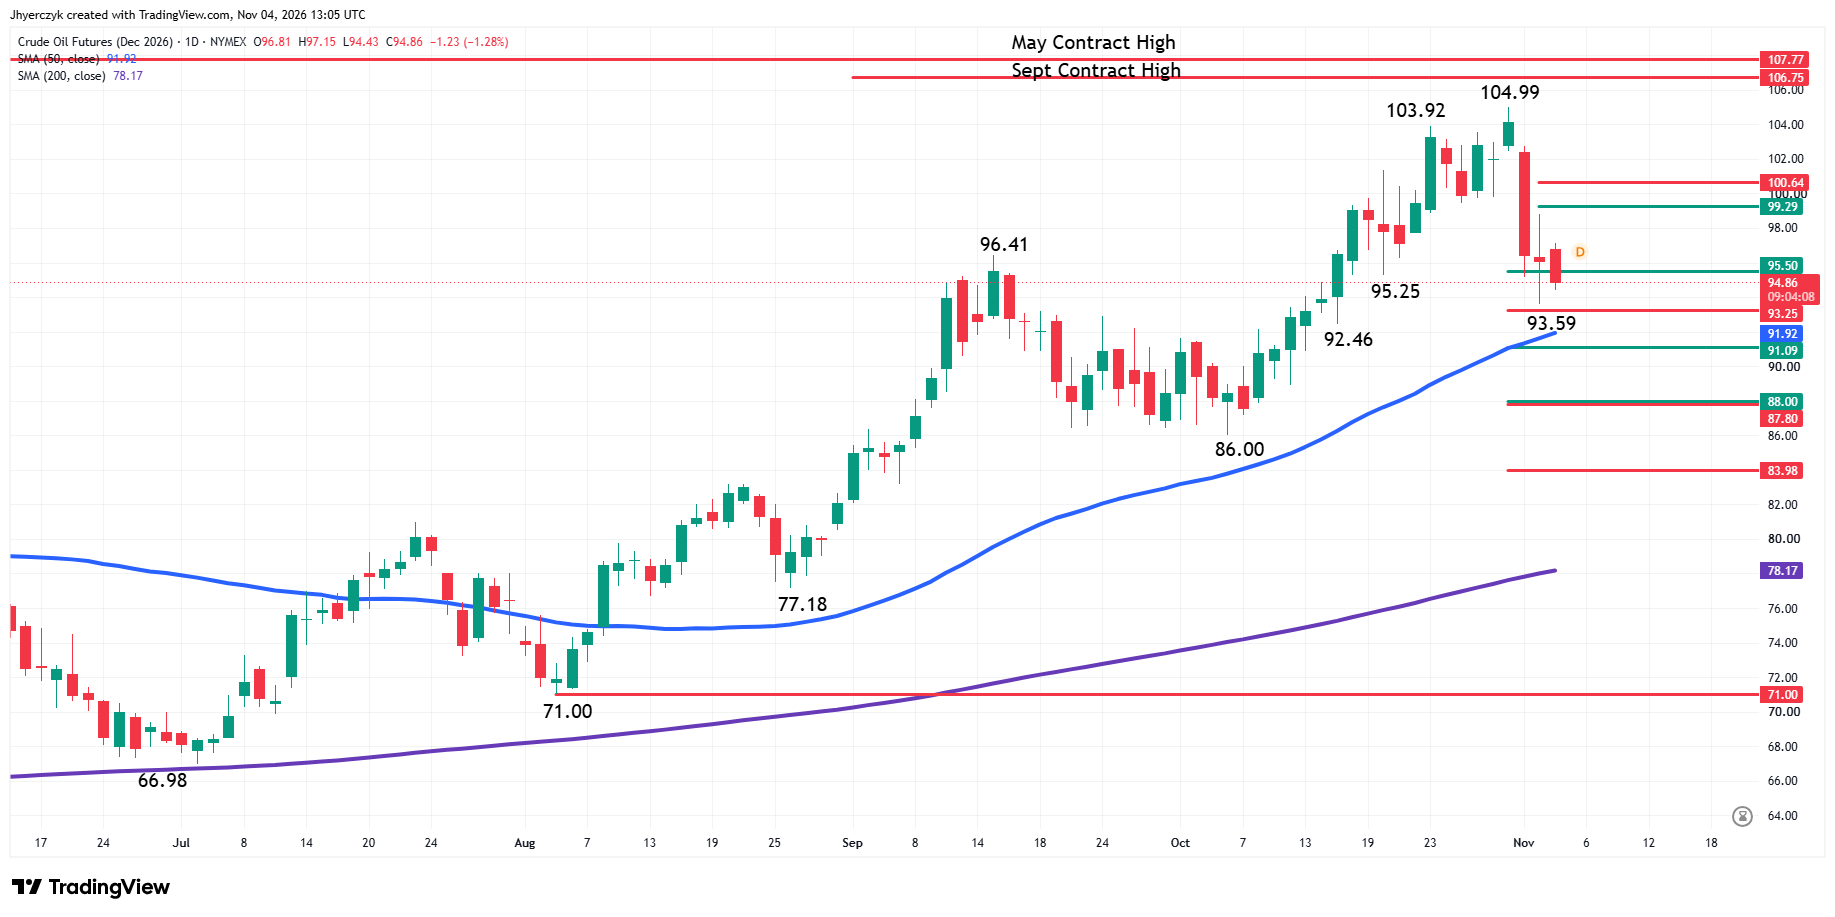
Technically, the main trend is up according to the daily swing chart. A trade through $86.00 will change the main trend to down. Taking out $104.99 will signal a resumption of the uptrend. The retracement zone formed by this range is $95.50 to $93.25.
The minor trend is down. It changed to down on Tuesday when sellers took out the swing bottom at $95.25. This may have shifted momentum to the downside. If a minor range forms from $104.99 to $93.59, then its retracement zone at $99.29 to $100.64 will become the next upside target.
The intermediate range is $77.18 to $104.99. Its retracement zone at $91.09 to $87.80 is another potential downside target zone. It’s followed by the long-term retracement zone at $88.00 to $83.98. Combining the two retracement zones creates a potential support cluster at $88.00 to $87.80.
The market is still trading on the bullish side of the 50-day moving average. It could also provide support at $91.94 today. This falls between a short-term 61.8% level at $93.25 and an intermediate-term 50% level at $91.09.
A breakout over $104.99 could lead to a test of historical tops at $106.75 and $107.77.
Brent Oil Price Forecast
Every new Brent Oil analysis as it publishes, today's technical signal and key levels, live price — on one page.
See all Brent Oil forecastsJanuary Brent Crude Oil Futures Technical Analysis
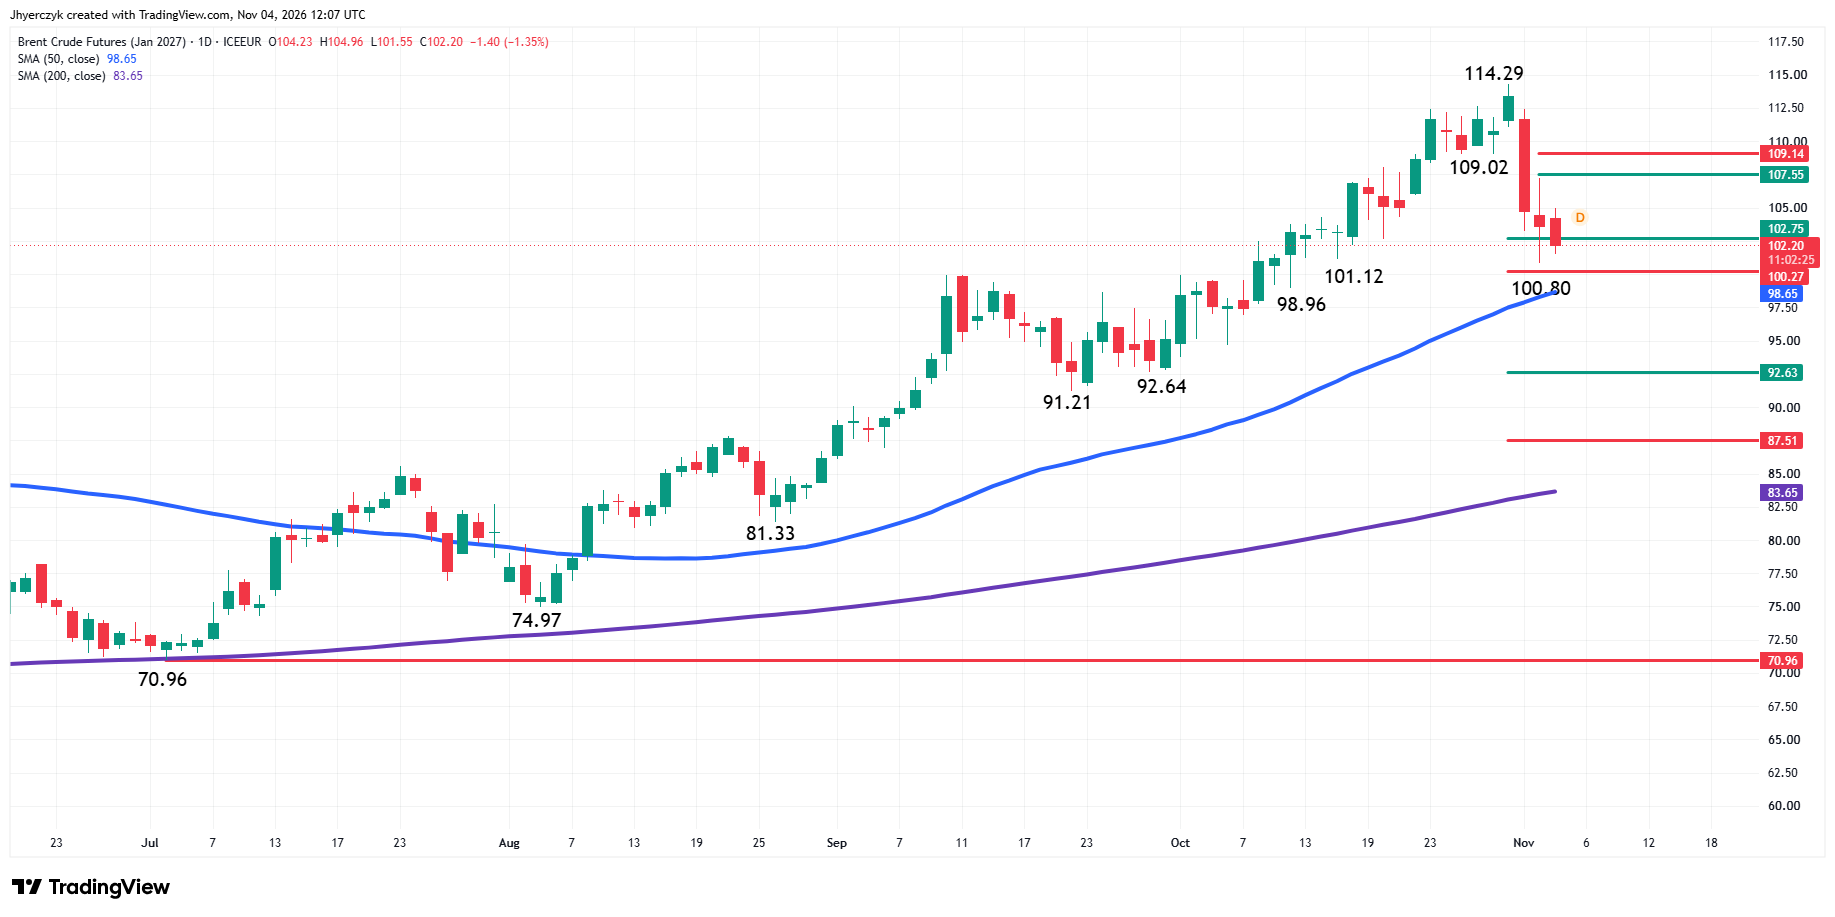
January Brent crude oil futures are lower early Wednesday, but may be attempting to form a new support base. The main trend is up according to the daily swing chart, but the minor trend is down. This seems to have shifted momentum to the downside.
A trade through $114.29 will reaffirm the uptrend. Taking out $92.64 changes the main trend to down, while a move through $91.21 reaffirms the downtrend.
The sell-off from $114.29 took out two minor bottoms at $109.02 and $101.12, changing the minor trend to down. Taking out $100.80 could lead to a test of the next minor bottom at $98.96.
If a minor range forms from $114.29 to $100.80, then the retracement zone at $107.55 to $109.14 will become the next upside target area.
The market is currently testing the intermediate support zone at $102.75 to $100.27. This is a little in front of the 50-day moving average at $98.65. The long-term range is $70.96 to $114.29. Its retracement zone at $92.63 to $87.51 is just ahead of the 200-day moving average at $83.65.
The main bottom at $92.64 forms a tight support cluster with the long-term 50% level at $92.63, and the next main bottom at $91.21 falls inside the long-term retracement zone.
What to Watch
December WTI Crude Oil Futures
With the main trend up and the minor trend down, my trend indicators are producing mixed results. So I’m going to defer to the 50-day moving average at $91.94 for my main trend support.
With this indicator controlling the uptrend, buyers appear to be showing respect for the short-term retracement zone at $95.50 to $93.25. A sustained move over the upper, or 50%, level at $95.50 could create the momentum needed to challenge the next target zone at $99.29 to $100.64. This will be an important test for the bulls. If buyers return, we could be looking at a breakout over $100.64 with a potential surge to $104.99. If sellers emerge, then a secondary lower top can form, leading to renewed pressure with the 50-day moving average the next potential target.
Essentially, in order to sustain my upside bias, WTI crude oil has to hold the 50-day moving average and overtake $100.64.
January Brent Crude Oil Futures
Like WTI futures, the trend indicators are mixed. The main is up and the minor is down. Therefore, the rotation is to the 50-day moving average. This is both a trend indicator and support.
The early price action suggests the reaction to $102.75 to $100.27 will set the near-term tone. A sustained move over the 50% level at $102.75 could trigger a rally into $107.55 to $109.14.
If the 61.8% level at $100.27 fails, then look for a quick test of the 50-day moving average at $98.65. If this test doesn’t hold, then we could see the selling continue into the long-term retracement zone at $92.63 to $87.51.
My bias has weakened despite the uptrend on the main swing chart because of the change in the minor trend. However, I won’t abandon the long side unless the 50-day moving average fails as support. If the selling is strong enough to take out $92.64, then the main trend will change to down. A move through $91.21 would reaffirm the downtrend and could encourage traders to sell rallies.
A successful test of the 50-day moving average is essentially needed to sustain the long-term rally.
If you’d like to know more about how to trade crude oil, please visit our educational area.