



Middle East Risks Offset Supply Glut
U.S. benchmark WTI crude oil and international benchmark Brent crude oil futures are moving higher on Tuesday on renewed concerns over supply from the Middle East due to escalated tanker attacks and forecasts calling for a drop in U.S. crude inventories.
Prices are being capped in anticipation of increasing supply. However, prices have also stopped going down because of the risks of attacks on tankers.
Last Friday, the International Energy Agency (IEA) said in its monthly report that the global oil market will return to surplus in the fourth quarter of this year. They cited a recovery in Middle East exports and supply exceeding global oil demand as the main reasons. However, a recent attack on a U.S. military radar system in Bahrain and a vessel attack in the Strait of Hormuz may have renewed concerns about the safety of exporting oil in the region. This may have been enough to create a rangebound trade for the past week.
At the same time, the Department of Energy reported another drawdown in the U.S. Strategic Petroleum Reserve, which now sits at its lowest level since August 1982 at 276.4 million barrels.
Now that much of the risk premium in crude oil has been erased, analysts appear to be moving back to watching the traditional supply and demand indicators. During this current rangebound period, traders are waiting on more clarity about supply, while they deal with the unpredictable possibility of a prolonged period of attacks on tankers.
Daily December WTI Crude Oil Futures Technical Analysis
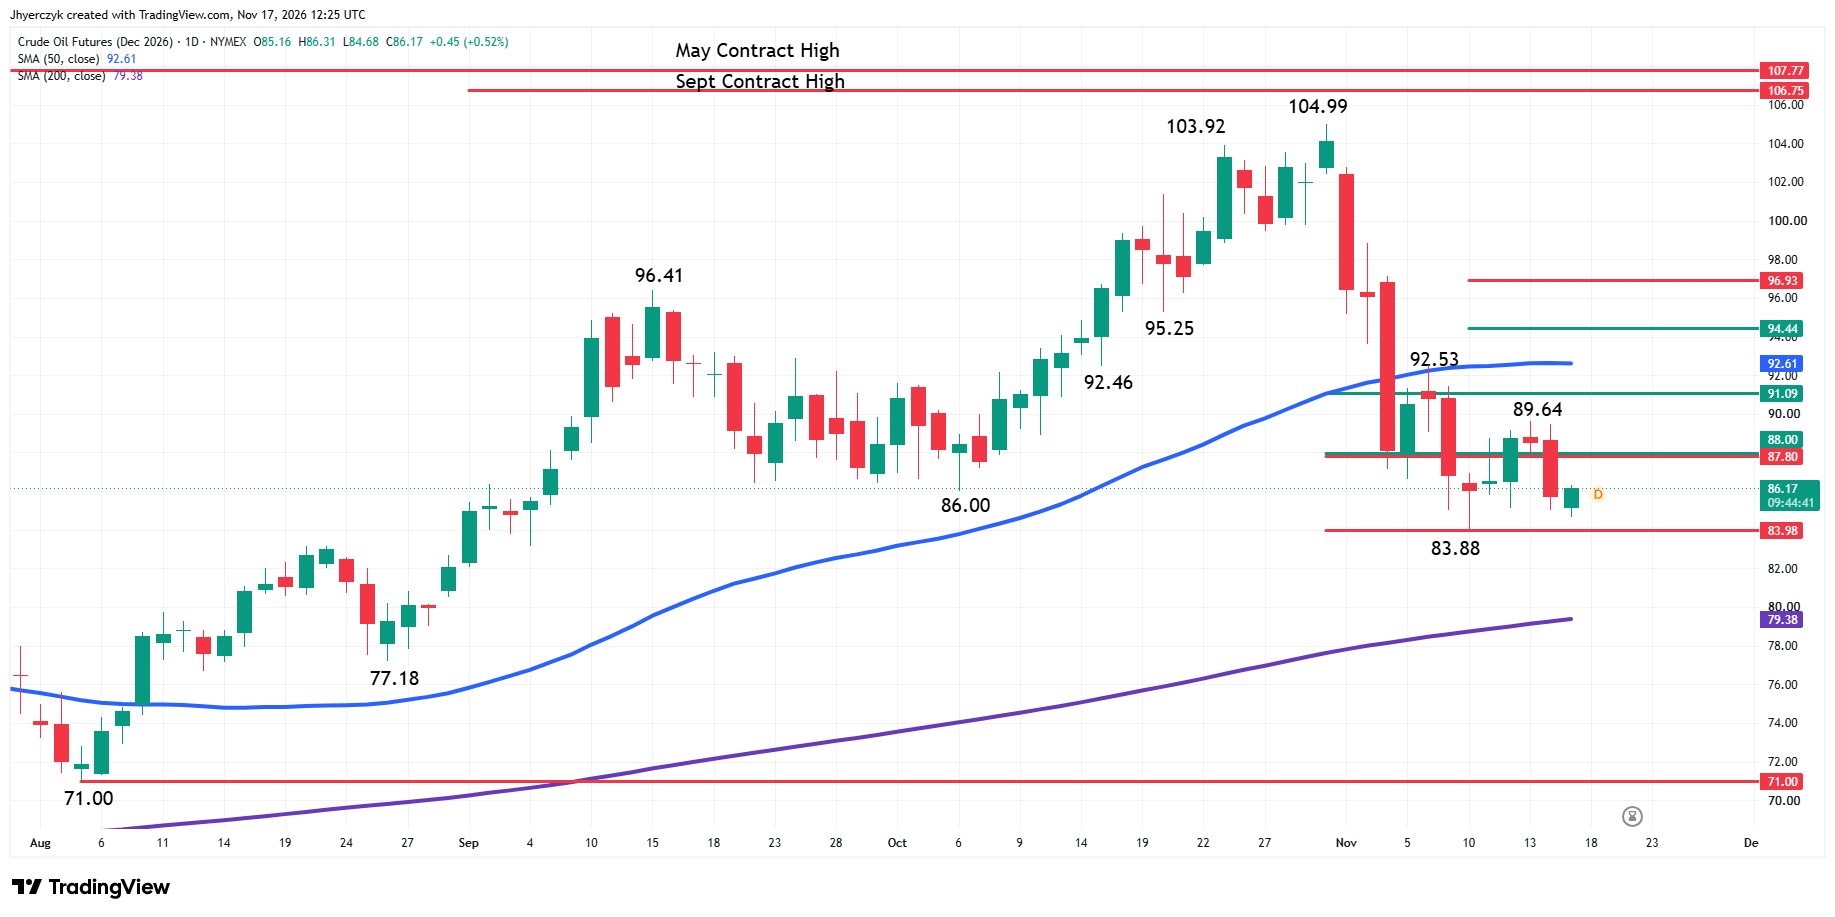
December WTI crude oil futures are rebounding from an early session setback on Tuesday as prices continue to consolidate inside a long-term retracement zone.
The main trend is down according to the daily swing chart. A trade through $89.64 will change the main trend to up. Taking out $83.88 will signal a resumption of the downtrend.
The long-term range is $71.00 to $104.99. The market is currently sitting inside its retracement zone at $88.00 to $83.98. Trader reaction to this area could determine the near-term direction of the market.
The intermediate range is $77.18 to $104.99. Its retracement zone at $91.09 to $87.80 may have just become new resistance after stopping a recent three-day rally at $89.64.
Combining the 61.8% level of the intermediate range at $87.80 and the 50% level of the long-term retracement zone at $88.00 has created an important resistance cluster. This may be the area that ultimately determines whether the rally begins to resume or the selling pressure increases.
The 50-day moving average at $92.61 is both a bearish trend indicator and resistance. For a breakout over the 50-day moving average, traders would have to overcome this indicator. The 200-day moving average has not been touched for months, but it is potential support while guiding the long-term uptrend higher.
Brent Oil Price Forecast
Every new Brent Oil analysis as it publishes, today's technical signal and key levels, live price — on one page.
See all Brent Oil forecastsDaily January Brent Crude Oil Futures Technical Analysis
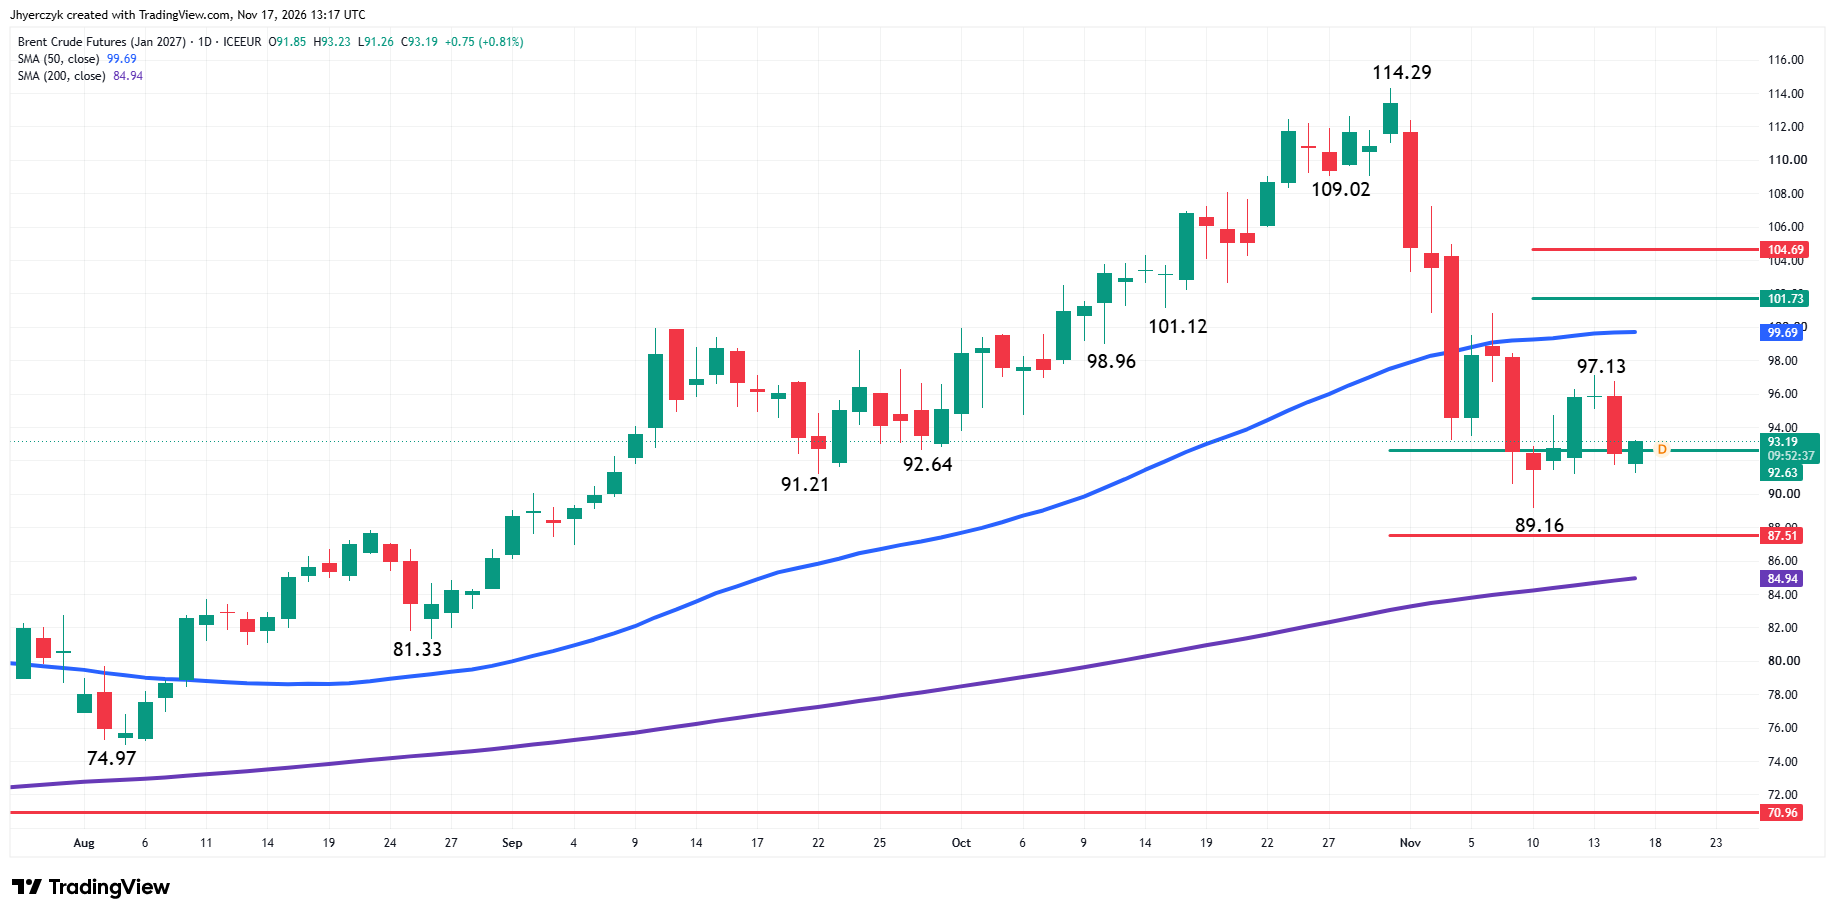
January Brent crude oil futures appear to have a structurally better chart pattern than December WTI. The main trend is down according to the daily swing chart. A trade through $97.13 will change the main trend to up. Taking out $89.16 will signal a resumption of the downtrend.
The long-term range is $70.96 to $114.29. Its retracement zone at $92.63 to $87.51 helped stop the selling at $89.16 on November 10. The market has been straddling the upper or 50% level at $92.63, for six out of the last seven sessions.
The short-term range is $114.29 to $89.16. Its retracement zone at $101.73 to $104.69 is the next potential upside target area.
The 50-day moving average at $99.69 is potential resistance. The 200-day moving average has been guiding the uptrend for several months and is potential support at $84.94.
What to Watch
Daily December WTI Crude Oil Futures
My bias is to the downside, but the current consolidation suggests a more neutral tone. The inability to overcome $88.00 will support my bias. A trade through $83.98 will strengthen my outlook, while a trade through $83.88 will reaffirm my conviction with the 200-day moving average at $79.38 the primary target.
Overcoming $88.00 will be the first sign of a weakening downtrend. My bias would shift to the upside if buyers overcome $89.64. However, the market will still face headwinds until the 50-day moving average at $92.61 is fully recovered.
Daily January Brent Crude Oil Futures
My bias is to the downside because the main trend is down, according to the daily swing chart. However, my outlook will weaken if counter-trend buyers can establish a support base on the strong side of the 50% level at $92.63. It’ll shift to the upside if $97.13 is taken out and the main trend turns up.
A change in trend to up won’t necessarily lead to an upside breakout. The market would still have to overcome the 50-day moving average at $99.69 to support a further rally. Furthermore, there are likely to be some headwinds at the $101.73 to $104.69 retracement zone.
If you’d like to know more about how to trade crude oil, please visit our educational area.