



Trump’s Softer Tone Cuts the War Premium
WTI and Brent crude oil futures are edging lower early Tuesday, extending yesterday’s losses after President Trump implied he didn’t see a need for renewed military activity against Iran “at this point.” The statement helped reduce fears of persistent supply disruptions from the Middle East.
Since the midterm elections last Tuesday, the President’s tone toward Iran has been softer, leading to a massive liquidation in long crude oil positions and erasing more than one-half of the war premium since the August 5 bottom. Despite Trump’s conciliatory tone, he did tell Reuters in an interview that he plans on sticking with the naval blockade in the Strait of Hormuz for the time being.
“While attacks on shipping around the Strait of Hormuz are still occurring, they have not escalated in a way that has forced a fresh risk premium into the market,” Tim Waterer, chief market analyst at KCM Trade, said.
In my opinion, whether prices firm from current levels or only after most of the war premium is erased will be determined by supply. On the supply side, a Reuters survey revealed that OPEC oil output climbed in October. However, shipping risks remain high, with Iran continuing to attack ships traveling through the Strait of Hormuz. Conditions could change quickly in the region because a U.S. military presence remains, there are no durable signs of de-escalation, and the U.S. and Iran haven’t signed a concrete peace deal.
The war premium may have been trimmed, but a rebound is still possible if key technical levels hold and there is a new bullish catalyst.
Daily December WTI Crude Oil Futures Technical Analysis
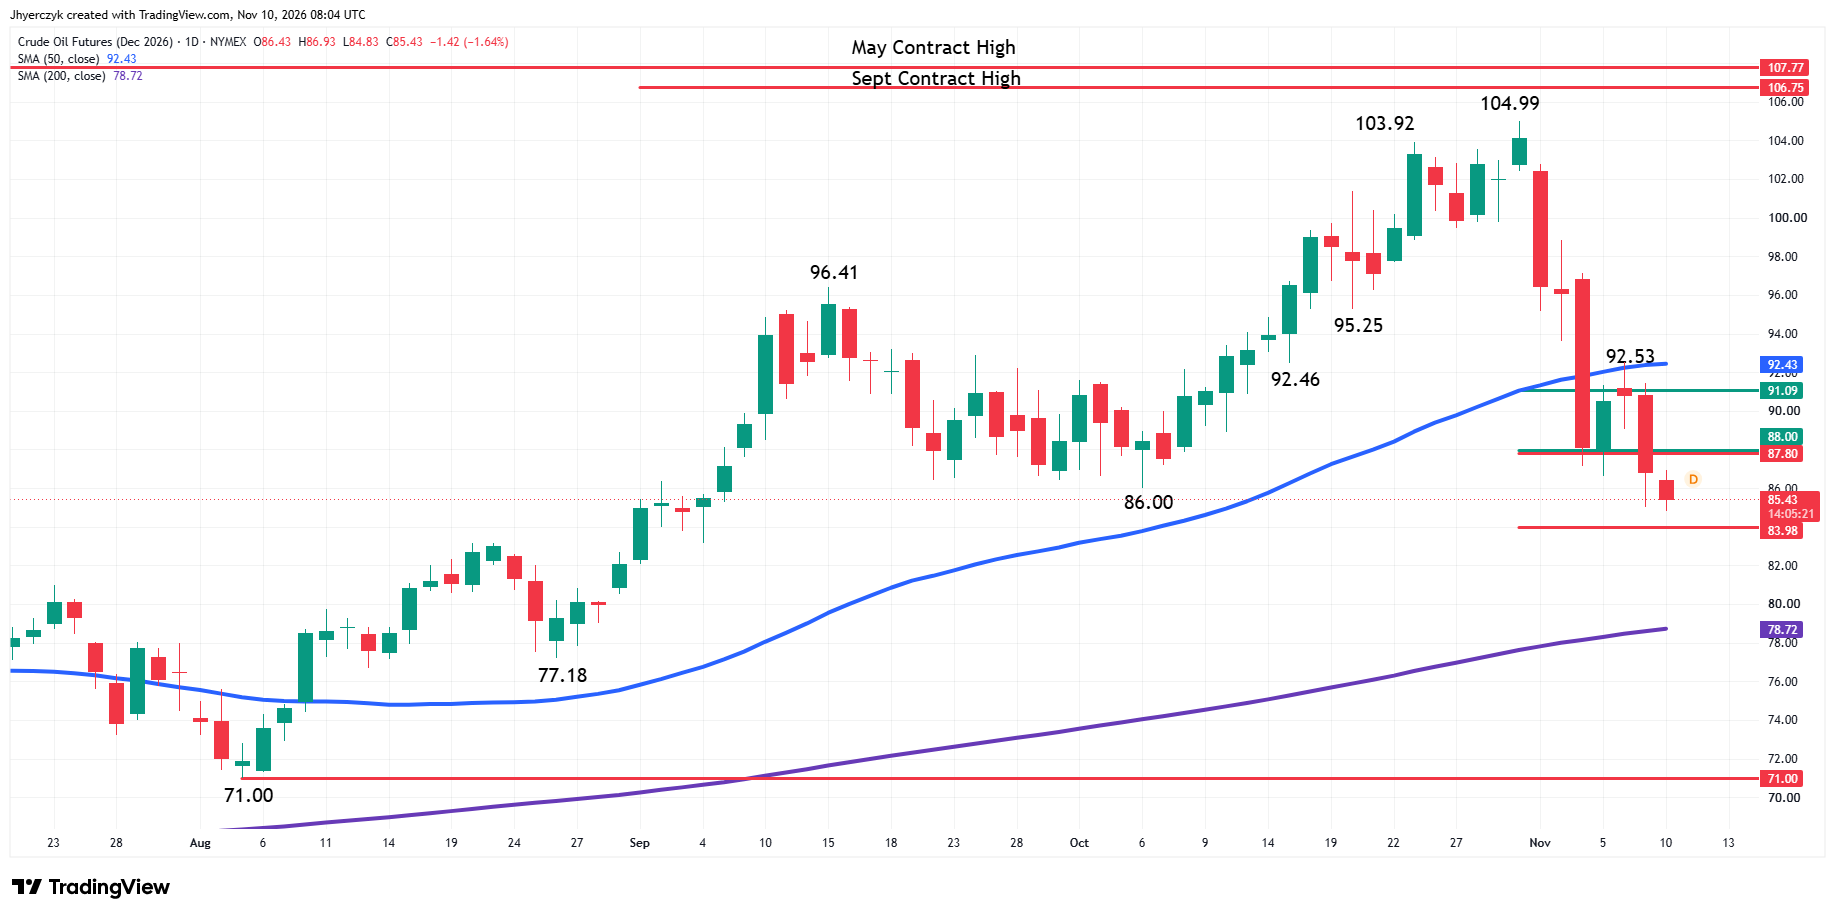
The main trend turned down on Monday when sellers took out the last swing bottom at $86.00. The next swing-bottom support is $77.18, followed by $71.00. A trade through $104.99 will change the main trend to up.
The minor trend is also down. A trade through the minor swing top at $92.53 will change the minor trend to up. This could shift momentum to the upside.
The long-term range is $71.00 to $104.99. Its retracement zone support at $88.00 to $83.98 is currently being tested. The intermediate range is $77.18 to $104.99. Its retracement zone is $91.09 to $87.80. Combining the two retracement zones creates a price cluster between a 50% level at $88.00 and a 61.8% level at $87.80. This area is resistance now, but could turn into a key pivot after a new bottom forms.
December WTI crude oil futures are also trading on the weakside of the 50-day moving average at $92.43, making it resistance. The 200-day moving average at $78.72 is a potential support level today.
Brent Oil Price Forecast
Every new Brent Oil analysis as it publishes, today's technical signal and key levels, live price — on one page.
See all Brent Oil forecastsDaily January Brent Crude Oil Futures Technical Analysis
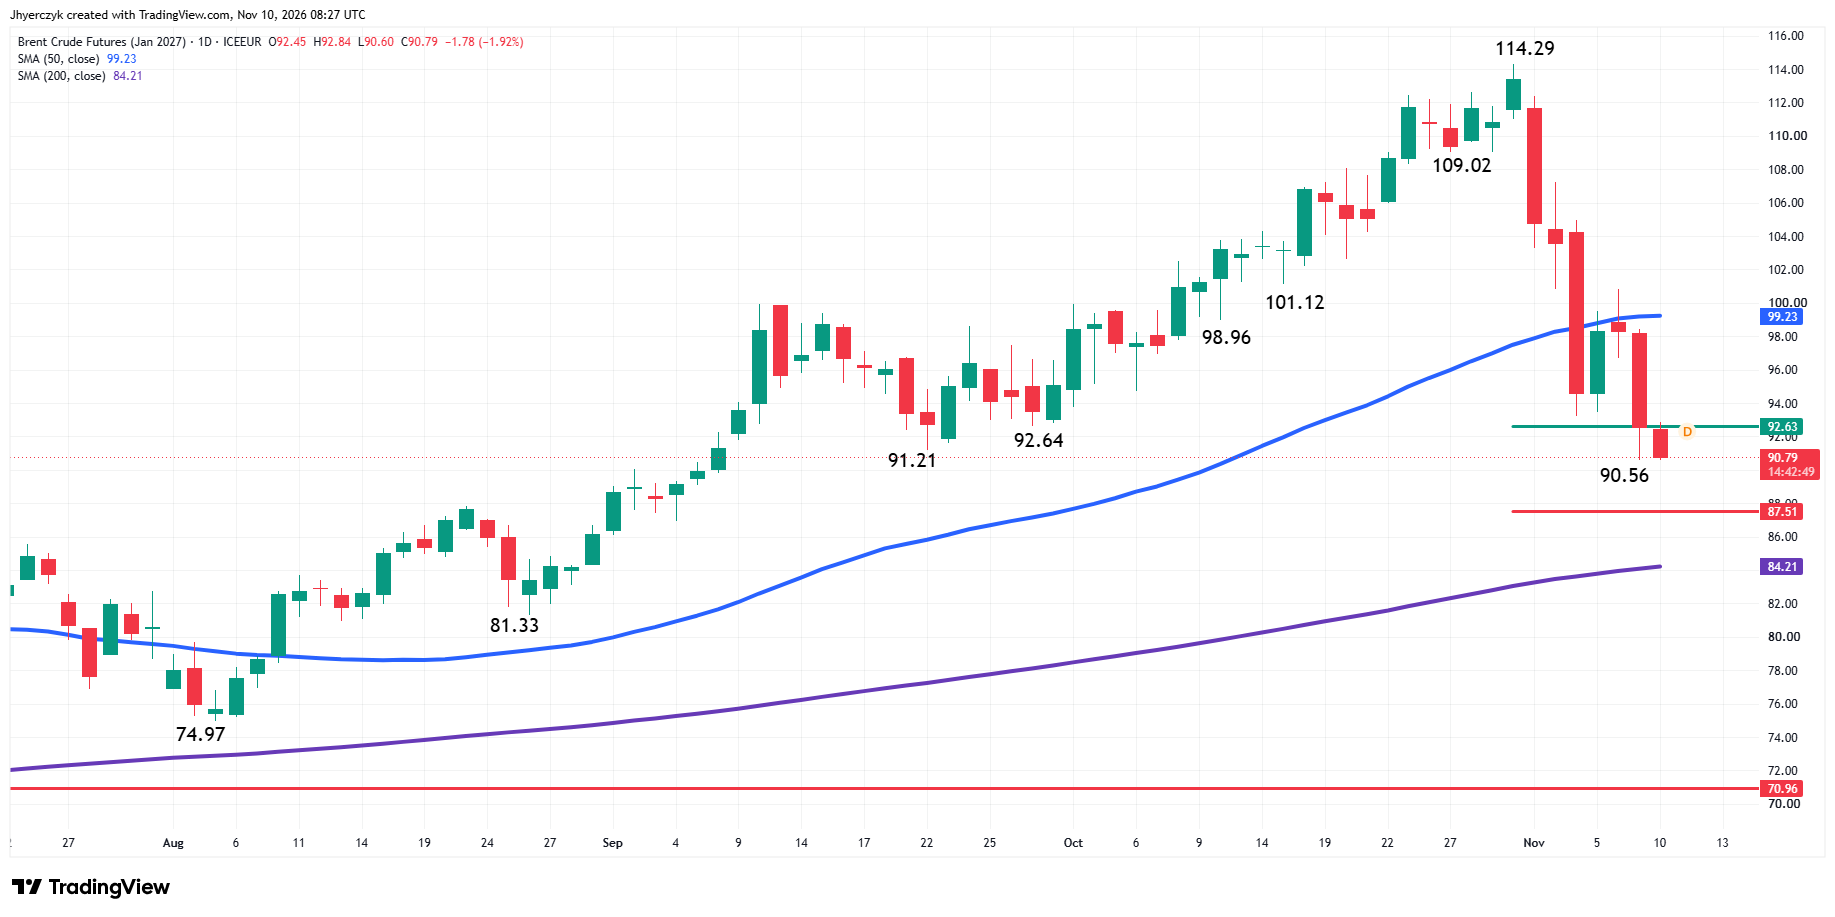
Both the minor and main trends are down according to their daily swing charts. The next potential downside target is the August 26 main bottom at $81.33. A trade through $114.29 will change the main trend to up.
The long-term range is $70.96 to $114.29. January Brent crude oil futures are currently testing its retracement zone at $92.63 to $87.51. Trader reaction to the upper or 50% level at $92.63 could set the tone today.
On the upside, the 50-day moving average at $99.23 is potential resistance. On the downside, the 200-day moving average at $84.21 is potential support.
What to Watch
December WTI Crude Oil Futures
The breakdown under the 50-day moving average at $92.43 and through the main bottom at $86.00 is giving me a strong downside bias. My outlook will strengthen if the 61.8% level at $83.98 is taken out. This could put the 200-day moving average at $78.72 on the radar.
A sustained move over the pivot at $88.00 will weaken my outlook a little. Overtaking $91.09 will put additional pressure on the short-sellers. Crossing over to the strong side of the 50-day moving average at $92.43 and changing the minor trend to up on a move over $92.53 will shift my bias to the upside. I’ll be looking for a 50% to 61.8% retracement of the break from $104.99 to the current low at $84.83.
January Brent Crude Oil Futures
The breakdown to the weakside of the 50-day moving average at $99.23 and the downtrend on the swing charts is supporting my bearish outlook, but January Brent crude oil has to break through the 61.8% level at $87.51 to sustain the weakness and set up a possible test of the 200-day moving average at $84.21.
Overcoming and sustaining a move to the strong side of the 50% level at $92.63 will weaken my outlook and set up a possible rally into the 50-day moving average at $99.23. I’ll likely flip to a bullish counter-trend bias if buyers can overcome the 50-day moving average. This could lead to a 50% retracement of the current break. Based on the sell-off from $114.29 to $90.56, that puts the first potential objective at $102.43.
If you’d like to know more about how to trade crude oil, please visit our educational area.