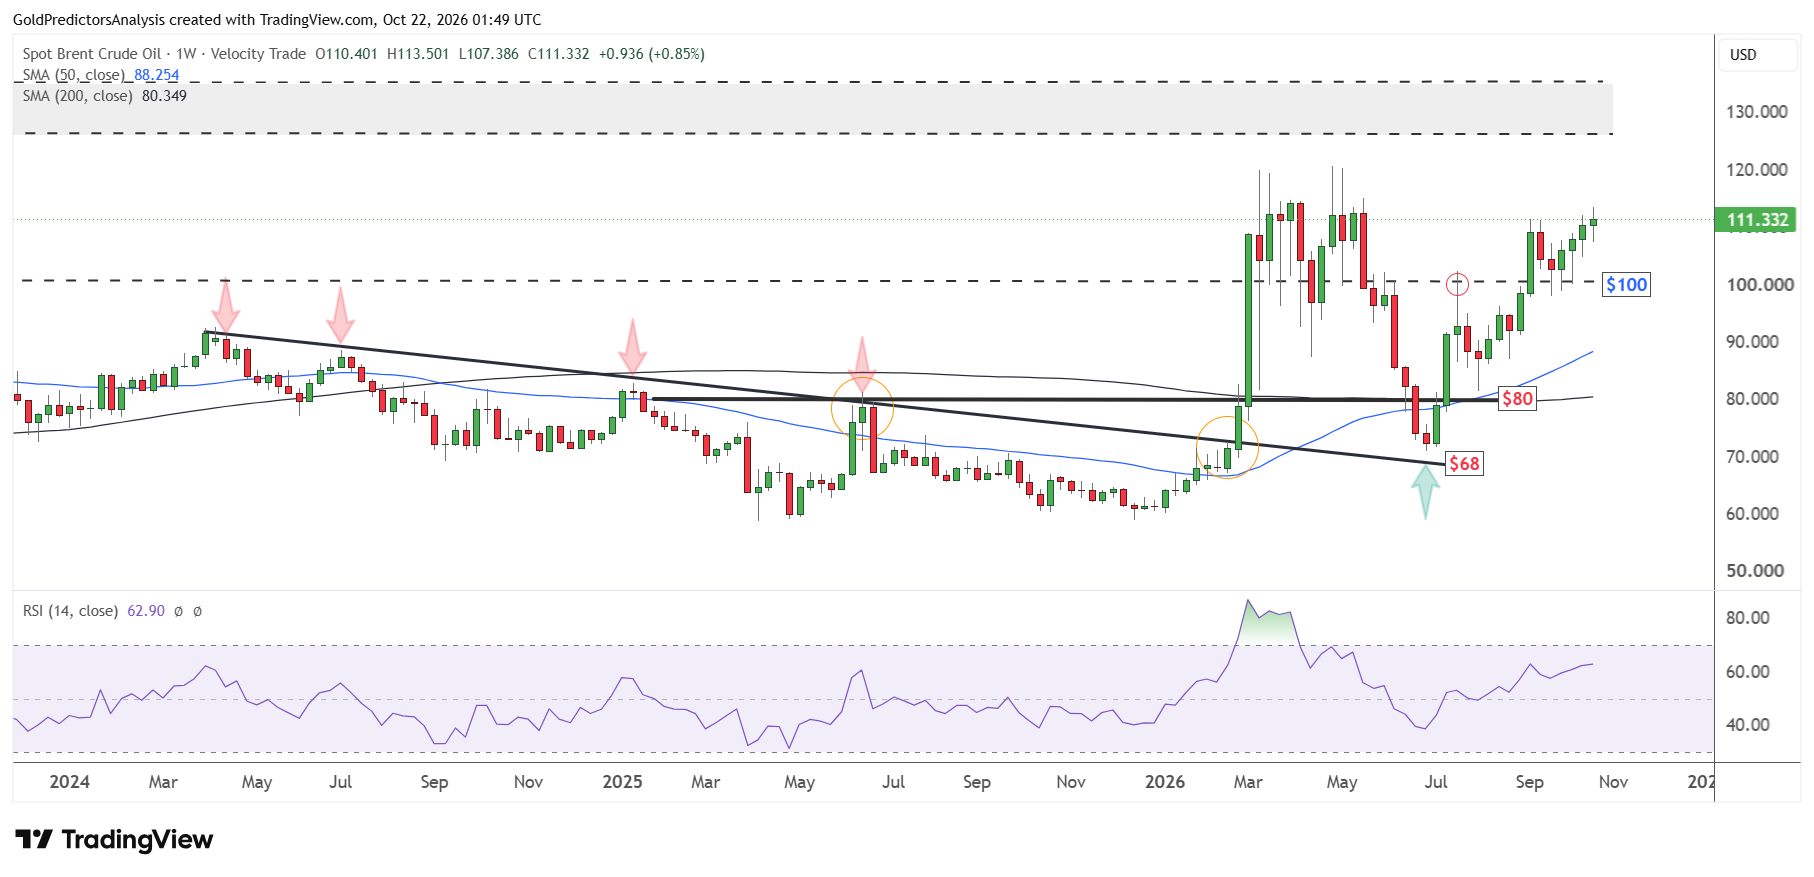
Brent oil remains strong in early Asian trading on Thursday and trades above $111.60 a barrel. On the other hand, WTI oil trades above $100 a barrel. The strength in the oil market was seen after the US ordered some diplomats and their families to leave Saudi Arabia after fresh Houthi attacks.
This escalation renewed fears over safety of oil facilities and shipping in the Gulf. These developments in the Middle East are the main drivers for the oil market in the near term. Any new attacks in the Middle East may disrupt exports and continue to push prices higher.
WTI Oil Price Forecast: The Key Resistance of $102.50
The daily chart for WTI oil shows that the price is rebounding higher from the $87 support area and continues to form a rounding bottom pattern above the key short-term support levels.
The price has been consolidating in between $95 and $100 during the past three days. These consolidations suggest that the next move in WTI oil might be towards the $104 level. But a break below the 50-day SMA near $92 will likely offer another drop towards the $87 region.
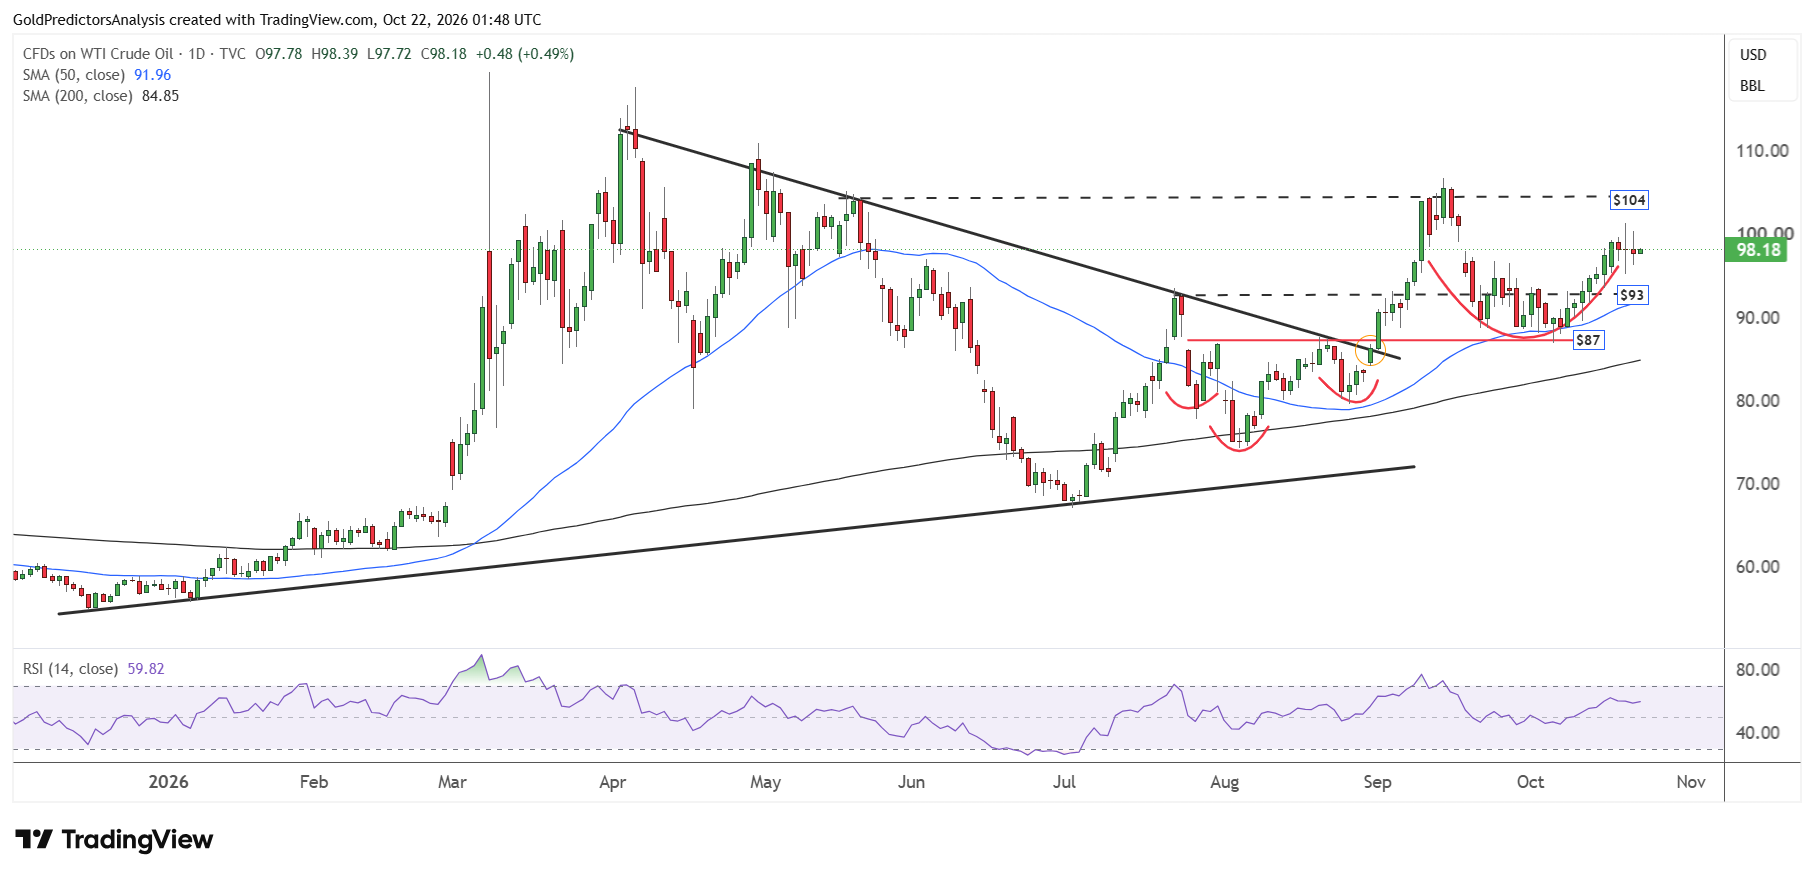
As long as the price remains above the 200-day SMA at the $84.85 level, the possibility of a strong rally towards the $120 level is high. Moreover, the price is forming the inverted head and shoulders pattern in July and August.
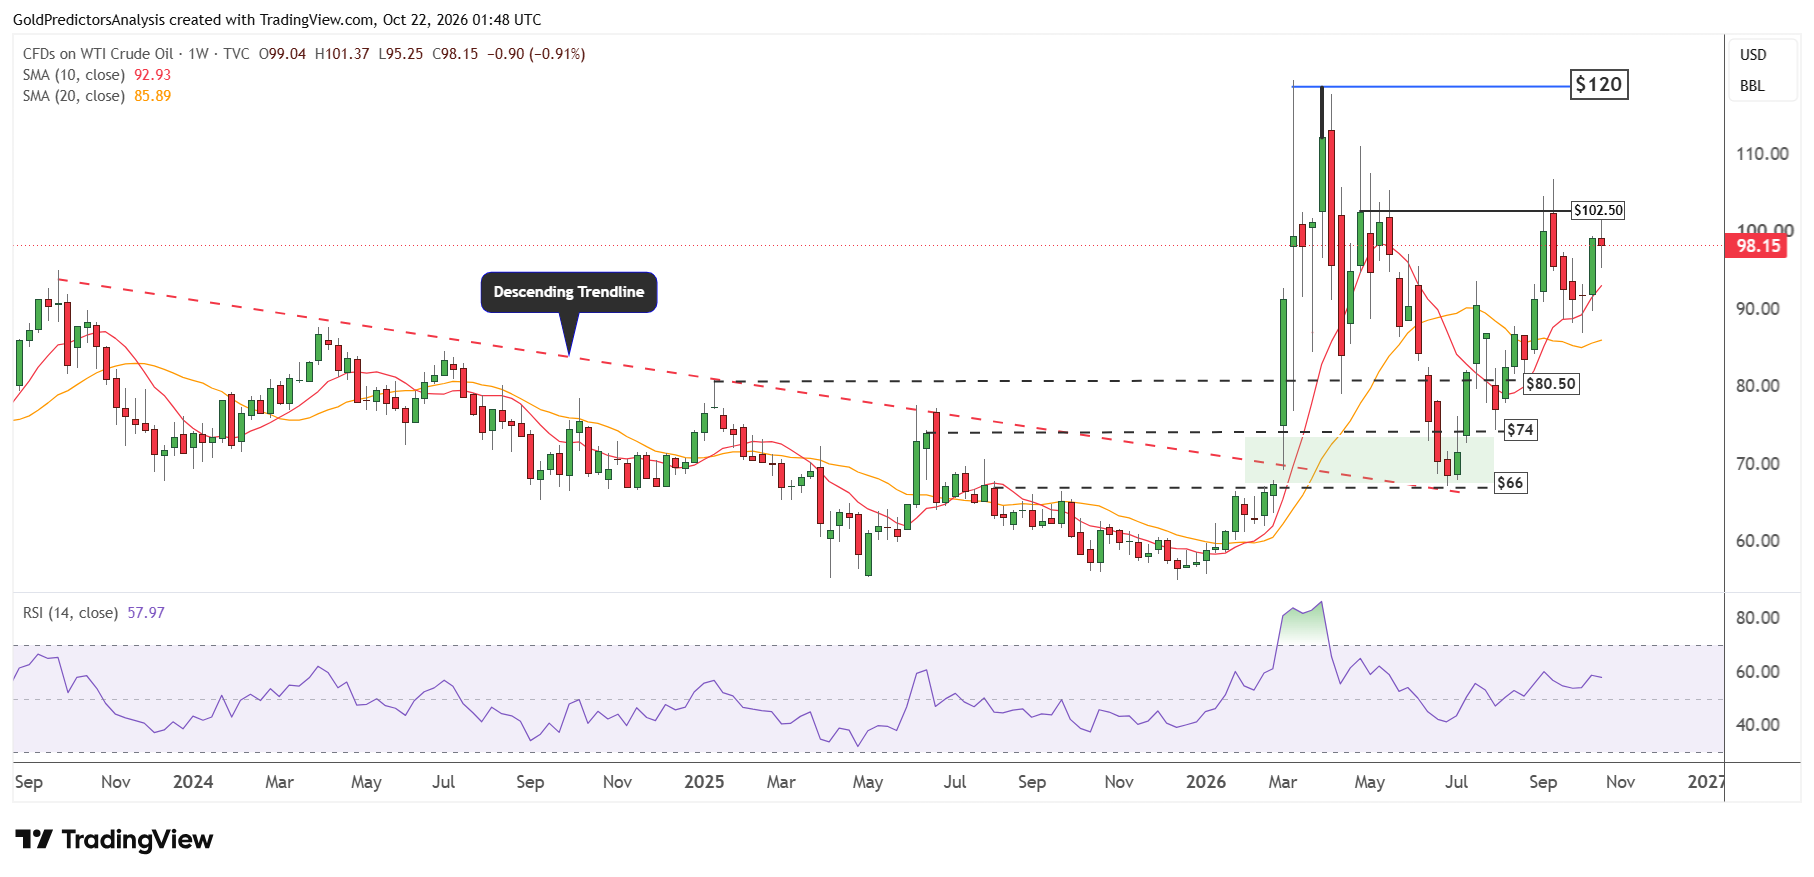
Now the price is forming the rounding bottom pattern, which suggests constructive price action. The weekly chart for WTI crude oil also shows positive developments above the long-term support region of the $66 area.
Last week, the price gained 8.05%, and now the price is consolidating in the short term and is looking for the possibility of an upside breakout. A break above $102.50 will likely offer a strong rally towards $120. On the other hand, a break below the 20-weeks SMA at $87 will likely trigger another drop towards the 80.50 level.
Brent Oil Price Forecast
Every new Brent Oil analysis as it publishes, today's technical signal and key levels, live price — on one page.
See all Brent Oil forecastsBrent Oil Price Forecast: The Key Resistance of $113
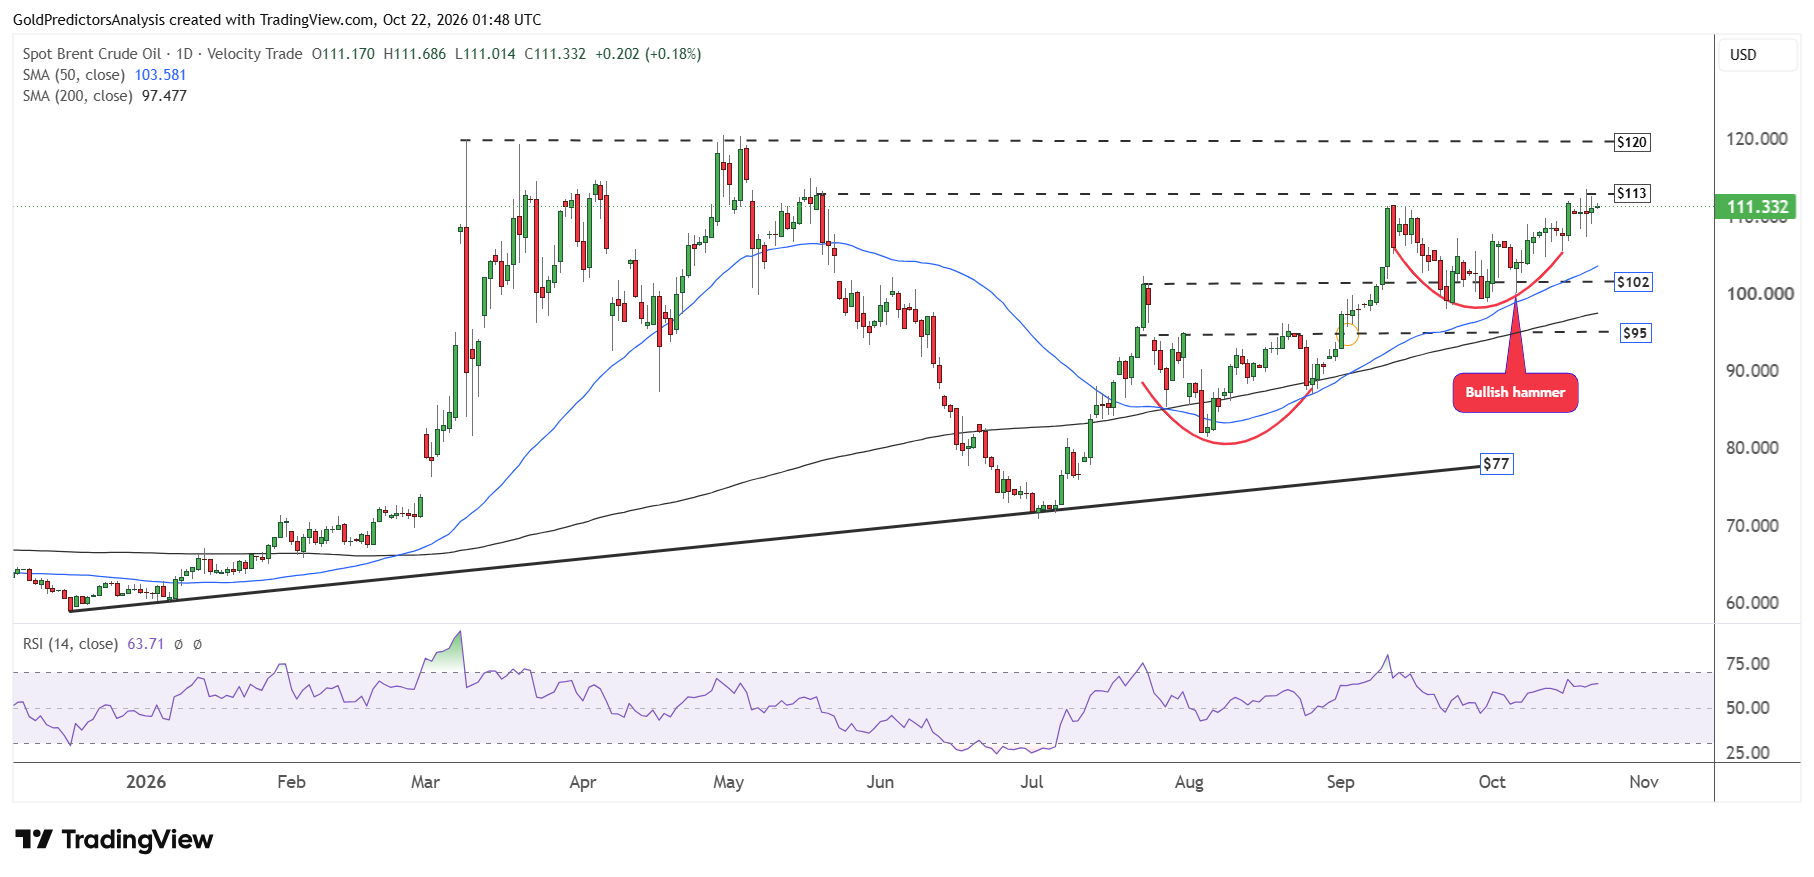
The daily chart for Brent oil also shows constructive price action as the price has formed rounding bottom patterns in August and September. The bullish hammer candle on 6 October suggests that the price may have the possibility of continued upside movement.
Brent oil is challenging the key resistance of the $113 level. A break above $113 level will suggest a rally to $120. But a break below $102 area will likely push prices towards the $95 level. The RSI remains above the midline which suggests a positive trend.
The weekly chart for Brent oil also shows constructive price action after the price rebounded from the lows of June 2026. The price remains constructive above the $100 area and continues to trend higher toward the $120 level.
A break above $120 may offer further upside towards the $125 to $135 region. This level is considered a long-term resistance in the Brent crude oil market.