


WTI Crude Oil
Currently, the WTI crude oil market is all about how crude is moving and how much is sitting in storage. The latest EIA weekly figures, released November 18, show U.S. commercial crude inventories, excluding the Strategic Petroleum Reserve, increasing 3.38 million barrels to 417.80 million barrels in the week ending November 13.
Yet, the same EIA data reveal a substantial rebound in the overseas market. U.S. crude exports averaged 4.488 million barrels per day versus 3.455 million the preceding week. Imports, meanwhile, fell from 6.698 million to 5.576 million barrels per day. Weekly flows, of course, are volatile, but the export increase confirms that American barrels continue to move into the international system.
The Refinery Picture Adds a Second Layer
The EIA reports U.S. refinery operable utilization reaching 95.7%, up from 95.2%, and the sixth weekly observation in the accompanying chart. Gulf Coast utilization was particularly high at 97.1%, which is not a surprise considering exports have done so well. Gross refinery imports increased slightly, but the narrow measure of crude imports slipped from 17.047 million to 16.918 million barrels per day. Higher utilization is therefore not proof of higher crude throughput.
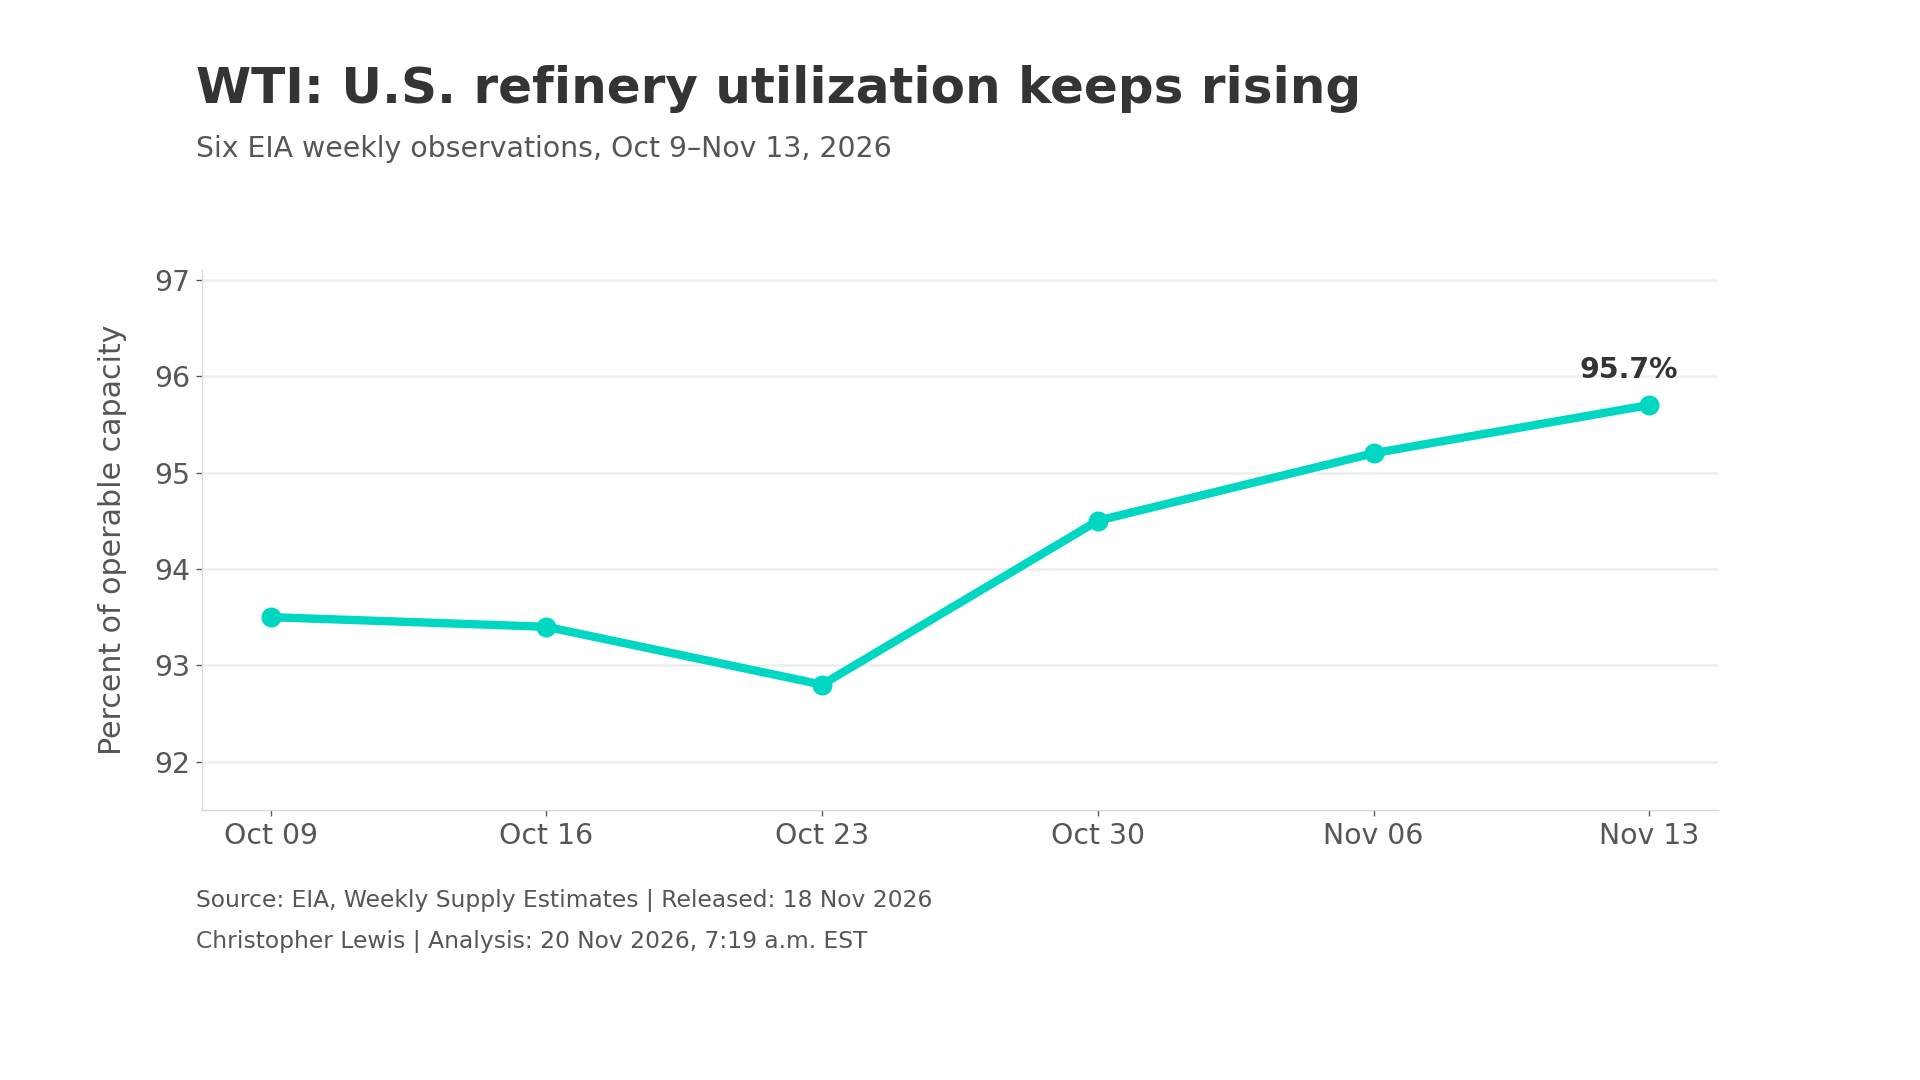
There is a detail for anyone looking for a sustained bullish recovery that should make us a bit uncomfortable. The latest EIA balance sheet puts gasoline inventories up 5.19 million barrels and distillate stocks up 1.57 million. When finished fuels accumulate alongside crude, it is harder to argue that refinery activity automatically represents a strengthening consumer market. The balance is not uniformly tight.
Third Consecutive Fall in Weekly Price
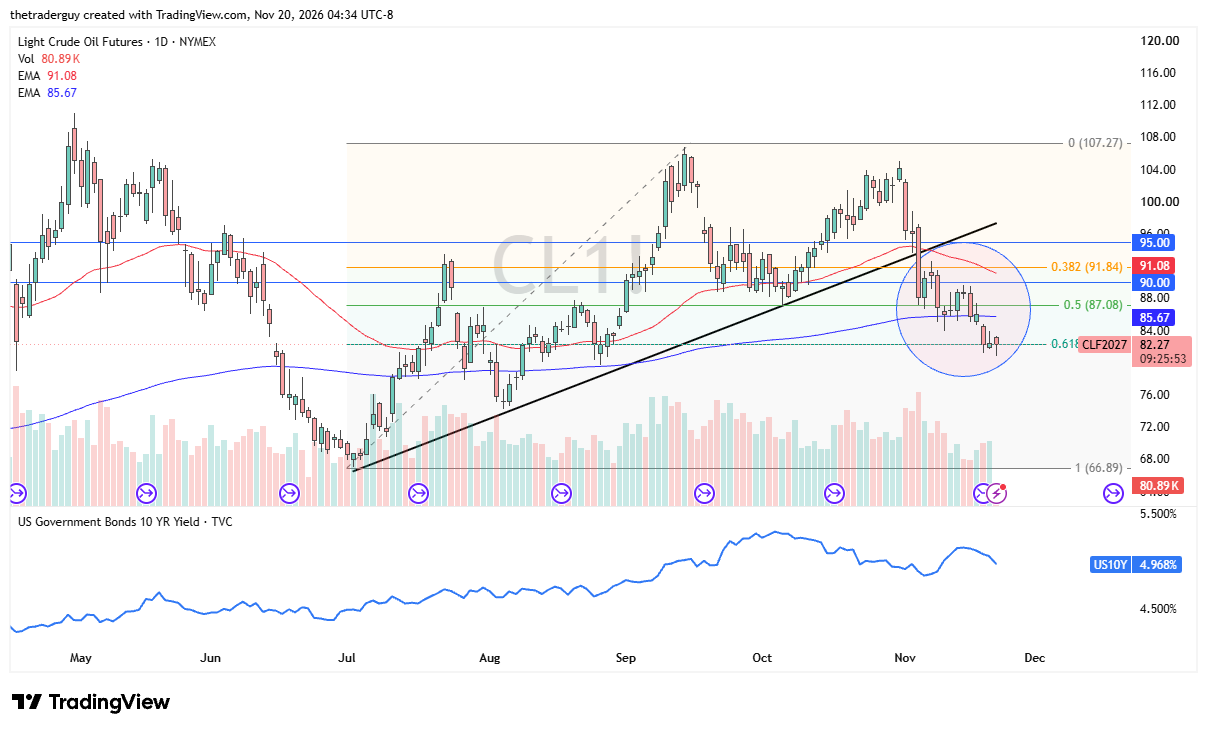
Reuters reported this morning that WTI was heading for a third consecutive weekly fall as Middle Eastern shipments recovered. The charts look very much like they are supported near the $80 level, and the 200-day EMA above sits as potential resistance. The 61.8% Fibonacci retracement level from the move higher in July still holds as support so far.
Brent Crude Oil
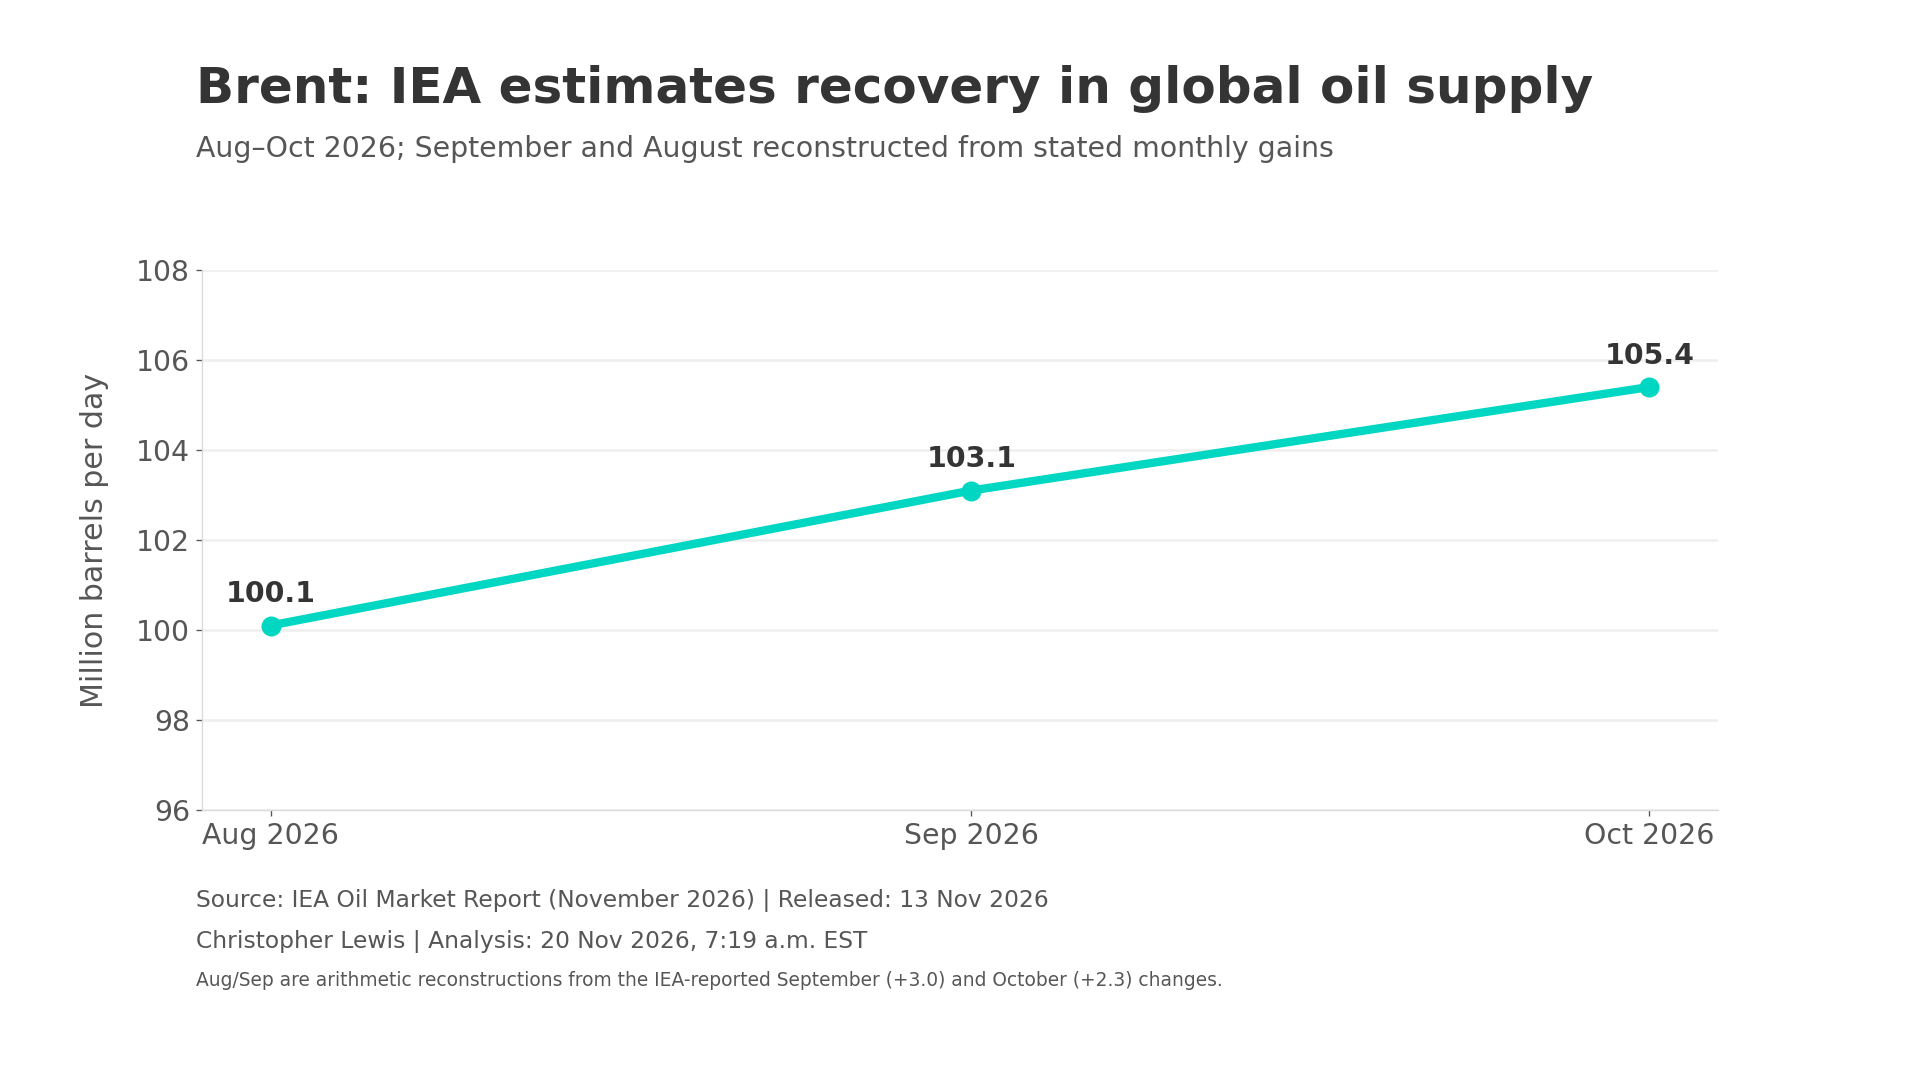
Brent has a totally different set of problems out there, with the key development being the speed at which international production and shipments have returned. In its November 13 Oil Market Report, the International Energy Agency estimated that world oil supply rose 2.3 million barrels per day in October to 105.4 million barrels per day. Following an increase of 3 million in September, the accompanying chart reconstructs August and September from the IEA’s monthly reported changes.
Brent Oil Price Forecast
Every new Brent Oil analysis as it publishes, today's technical signal and key levels, live price — on one page.
See all Brent Oil forecastsOil Moving Around at the Moment
The recovery has changed the location of oil inventories. The IEA reported observed stocks increasing by 52 million barrels in October, with oil held on water rising 86 million barrels. Yet, onshore inventories continue to decline, and OECD total stocks fell by 47 million barrels. Oil afloat is not equivalent to immediately accessible refinery supply.
Concerns About Attacks Remain
Reuters reported a Houthi warning involving Saudi Red Sea ports following attacks on Riyadh. Reuters also relayed an Iranian Revolutionary Guards Navy claim that two tankers struck mines in the Strait of Hormuz. The claim is attributed to the Iranian force, but it has not been independently established at the time of this report. The verifiable point is that participants still face threats to navigation even as actual export volumes improve.
The IEA estimated that Middle East-to-Asia crude freight costs remain near records in its November publication, and that October global refinery runs fell to 81.3 million barrels per day. This is why the relationship between Brent and WTI is not simply a comparison of two inventory figures. Brent reflects the marginal economics of seaborne delivery. Risk insurance and shipping availability can change the effective landed costs for European and Asian customers.
Charting Brent
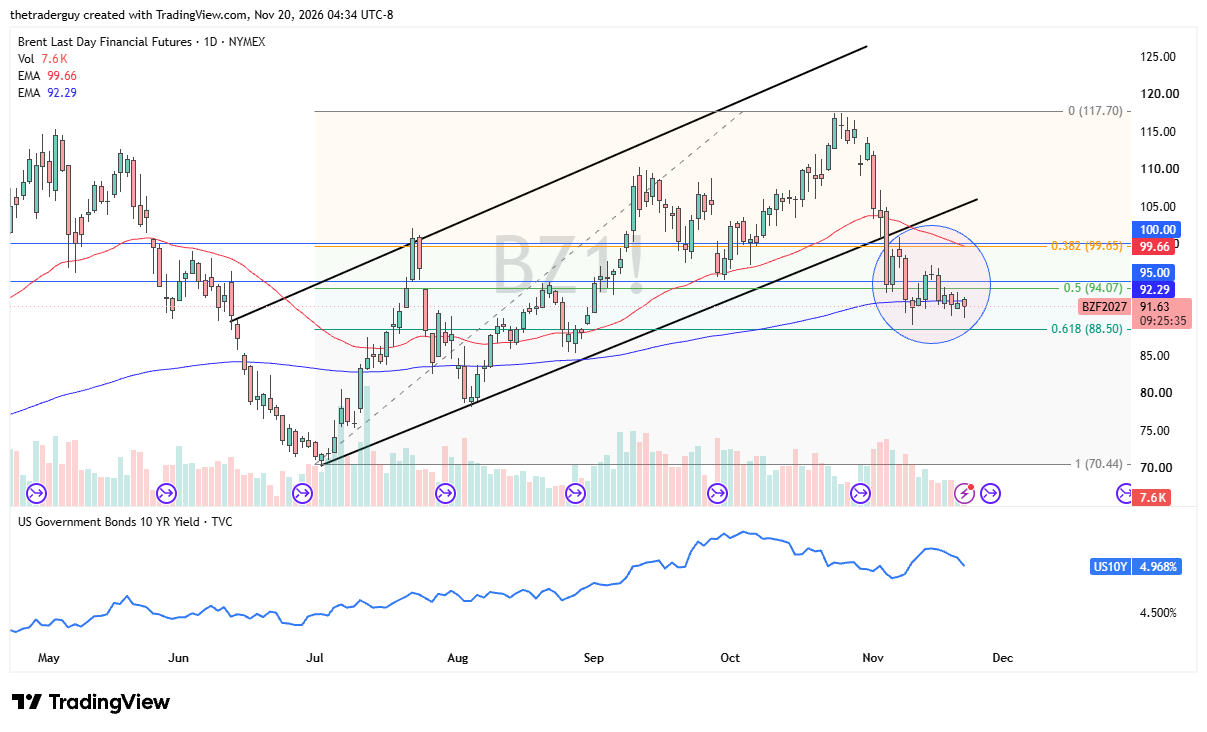
The next OPEC+ meeting is on November 29 and is going to be watched very closely by Brent traders. Looking at the chart, we can see that there is a bit of support just above the 61.8% Fibonacci retracement level, and we continue to hang around the 200-day EMA. If the market were going to offer a little bit of support and then break above the $97 level, the next resistance would more likely than not be the 50-day EMA.
If you’d like to know more about how to trade crude oil, please visit our educational area.