


WTI Crude Oil
The latest U.S. petroleum balance is a mixed signal for West Texas Intermediate crude. The EIA report for the week ending November 6 showed commercial crude inventories rising 4.7 million barrels to 414.4 million. Gasoline stocks increased 1.8 million barrels to 210.8 million, and distillates added 4.1 million to 103.3 million. These product builds matter because they suggest that the refinery system was supplying the market faster than final demand for transport fuels during that week.
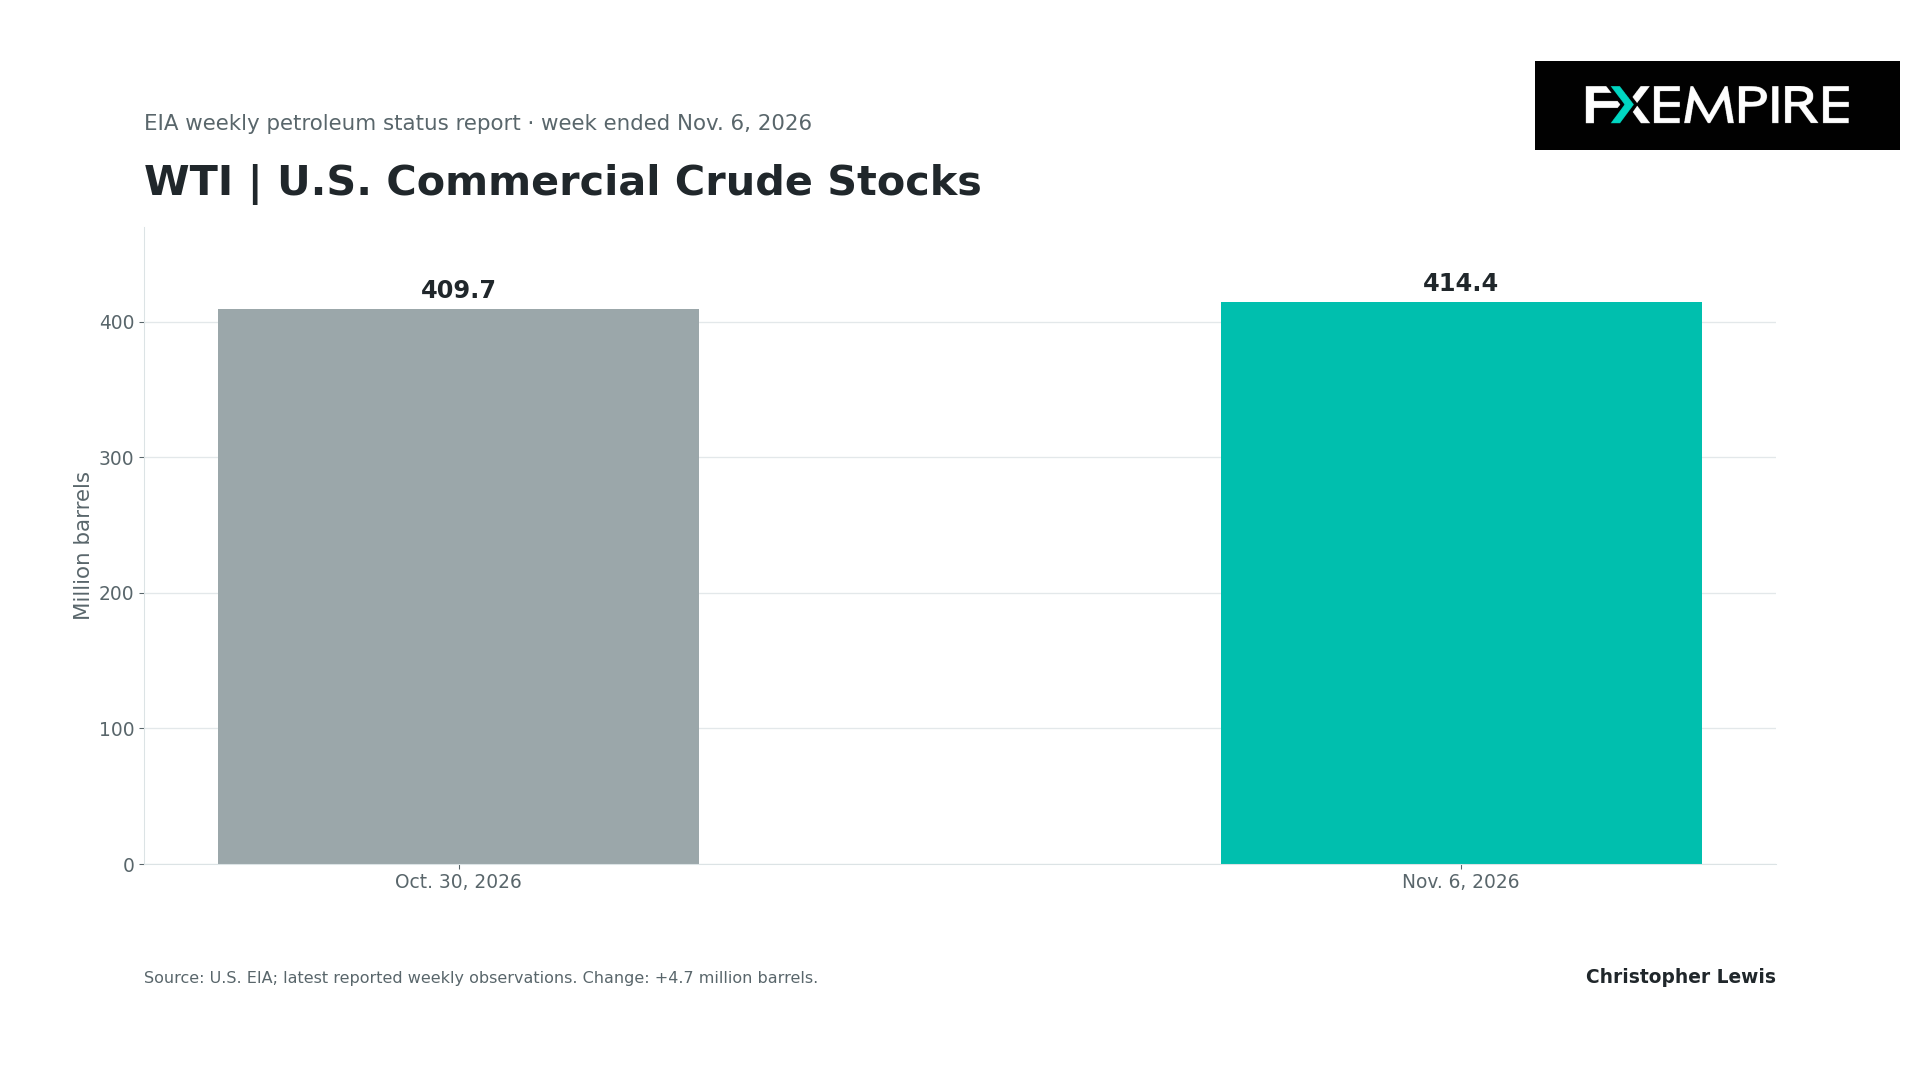
A single weekly movement, of course, is noisy, but the combination does not support a convincing near-term storage story. At the same time, refinery activity was strong. Crude inputs at U.S. refineries averaged 17.047 million barrels per day, up 322,000 barrels per day from the prior week. That is supportive of crude consumption. Refiners were taking in more feedstock even as crude inventories increased.
U.S. Production
U.S. field production was estimated at 14.013 million barrels per day, while imports averaged 6.698 million barrels per day and crude exports 3.455 million barrels per day. The weekly figures are estimates and can be revised. They are best read together as a snapshot of the domestic balance rather than proof of a durable trend. A four-week average of crude exports is more informative than one week’s flow, and the report puts it at 3.857 million barrels per day.
The market’s next test is whether higher refinery runs persist and whether product stocks begin drawing as colder weather and transport demand evolve. If runs remain high while gasoline and distillate inventories turn lower, the crude build could prove temporary. If product stocks continue to rise, refiners may have less incentive to sustain utilization, leaving more crude in storage. The next EIA weekly petroleum release is the first clear domestic check on the balance.
EIA November Outlook
EIA’s November outlook forecast record U.S. crude production of 14.3 million barrels per day next year, up from an estimated 13.9 million barrels per day this year, while commercial inventories remain below their five-year average into 2027. Growing supply, therefore, may be absorbed if refinery demand and exports remain firm.
Technical Bounce?

During the session here on Tuesday, we have seen a significant amount of strength, but it still looks like a market that is hanging around the 200-day EMA and consolidating more than anything else. This is not a market that is waiting for the next signal.
Brent Oil Price Forecast
Every new Brent Oil analysis as it publishes, today's technical signal and key levels, live price — on one page.
See all Brent Oil forecastsBrent Crude Oil
Brent market’s global backdrop is less one-sided. In its November 13 Oil Market Report, the International Energy Agency estimated that world oil supply rose 2.3 million barrels per day month over month in October to 105.4 million barrels per day, following an increase of 3 million barrels per day in September. Higher Gulf exports drove most of October’s gain.
The same report estimated that observed global inventories rose 52 million barrels in October, or about 1.7 million barrels per day, the first increase since June. The inventory headline needs qualification. The IEA said oil on water increased by 86 million barrels to its highest level since January, while on-land stocks remained at their lowest since 2016. OECD industry inventories fell 41 million barrels during October within a broader OECD stock decline of 47 million barrels.
In other words, more crude and products were counted in the global system, but much of the gain was cargoes at sea rather than immediately available barrels. Longer voyages and elevated freight costs can delay the point at which those barrels ease local tightness.
Demand Expectations
Demand expectations also point towards a looser balance. The IEA forecasts demand falling 2.7 million barrels per day in 2026 to 102.3 million barrels per day, then rebounding to 2 million barrels per day in 2027. It sees supply declining by 4.8 million barrels per day this year before recovering 6.6 million barrels per day next year. These are projections, obviously, not measurements.
October refinery runs fell an estimated 1.3 million barrels per day to a seasonal low of 81.3 million barrels per day. A December recovery is expected. Refinery utilization and Gulf cargo movements will show whether the inventory build reaches land-based hubs.
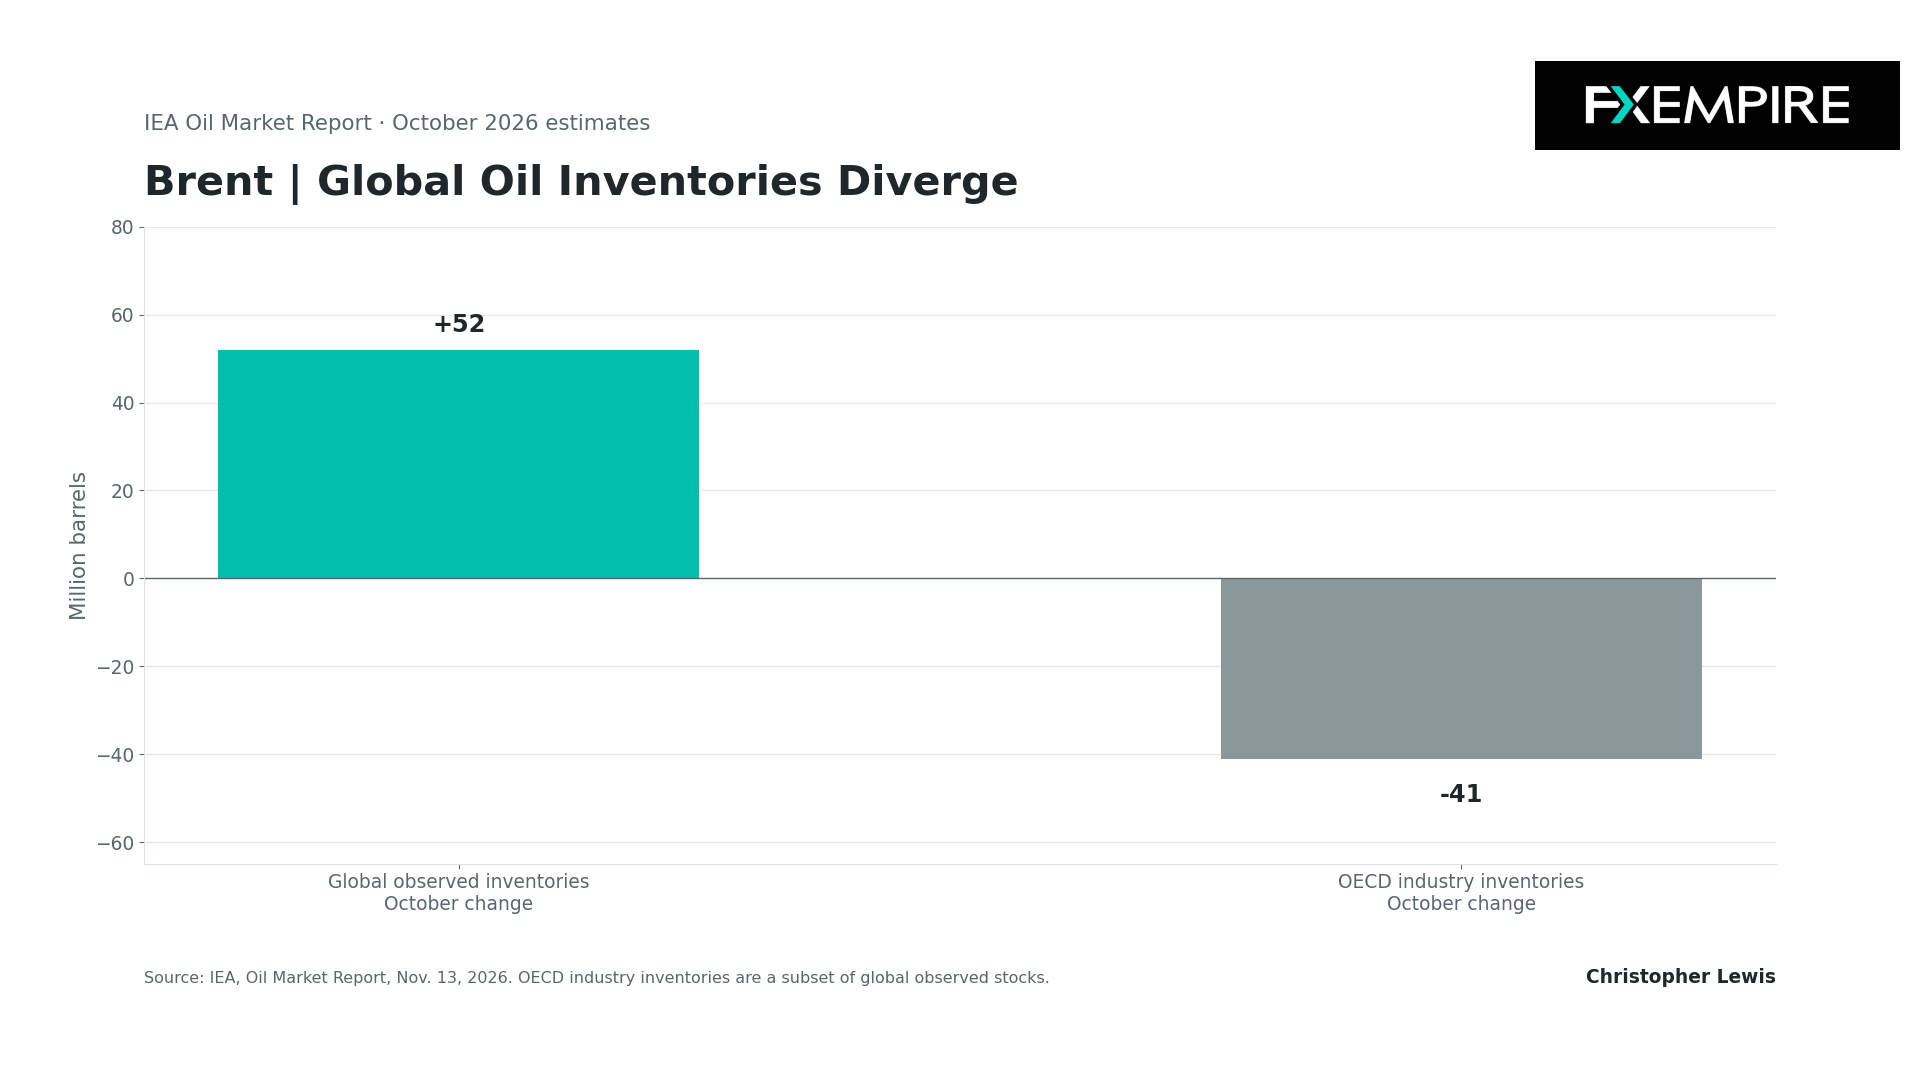
In the Brent market, there are two major competing forces. The October return of global stock accumulation argues against treating scarcity as worsening automatically, while depleted land inventories and disrupted shipping keep the prompt market exposed to delays. OPEC+ in November decided to hold December output for seven participating producers, which is another supply-policy reference point, but the group is scheduled to discuss next year’s quotas later in November and could be a catalyst for movement as well.
Charts Show Indifference
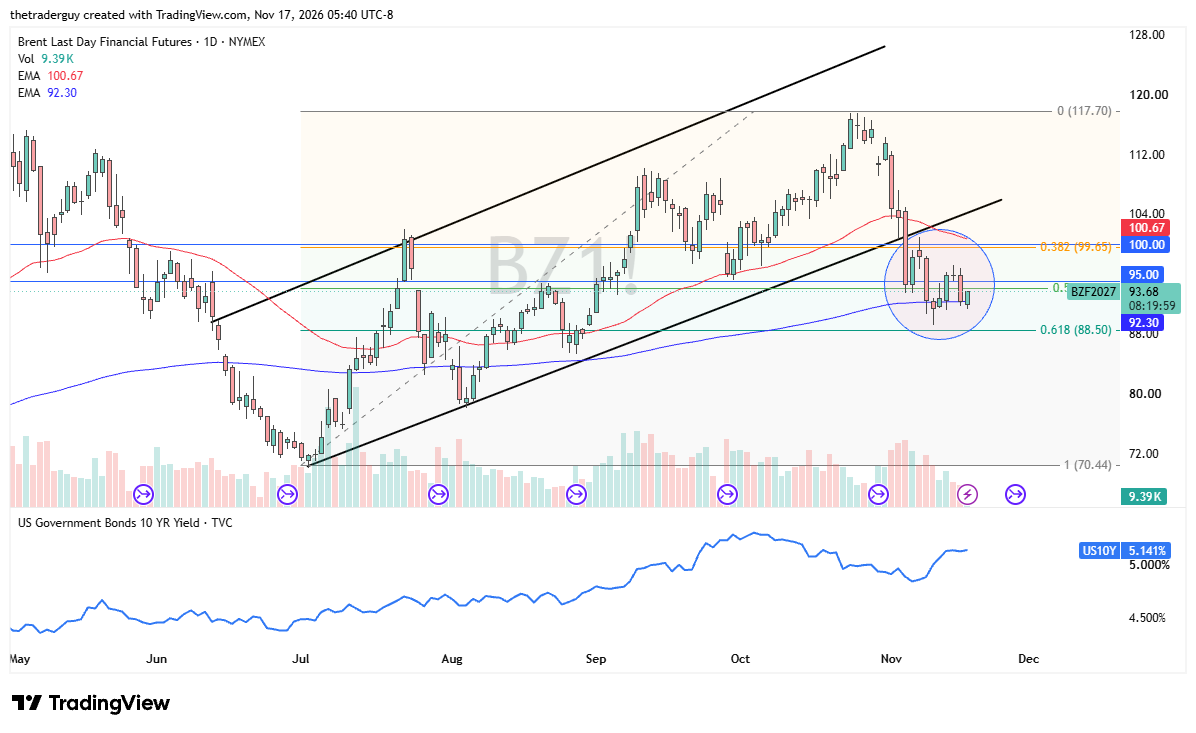
The technical analysis just looks like a market that is consolidating just above the 200-day EMA, much like the WTI crude oil market. Quite frankly, oil markets look very neutral and range-bound.
If you’d like to know more about how to trade crude oil, please visit our educational area.