


WTI Crude Oil
The WTI crude oil market on Monday has seen a bit of supply intervention, which we should probably distinguish from a broad expansion in available crude. On Friday, the Department of Energy authorized an emergency exchange of up to 400,000 barrels from West Hackberry for Phillips 66’s Lake Charles Refinery. The purpose of this action was to bridge the disruption in crude deliveries and protect regional fuel production.
This distinction will matter for the market balance, as an exchange shifts reserve crude into commercial use temporarily and does require repayment with additional barrels. We should think of it more or less as a loan that Phillips 66 will have to pay back with more oil than it received. It does help a refinery maintain operations, but it shouldn’t be thought of as anything along the lines of new domestic production. Its significance is operational continuity in Louisiana rather than a durable solution.
EIA Weekly Estimates
The latest EIA weekly estimates, published October 21 for October 16, showed commercial crude stocks falling 3.1 million barrels to 412.5 million. Gasoline stocks declined 3 million barrels, while distillates increased 1.7 million. Refineries were operating at a 93.4% utilization rate.
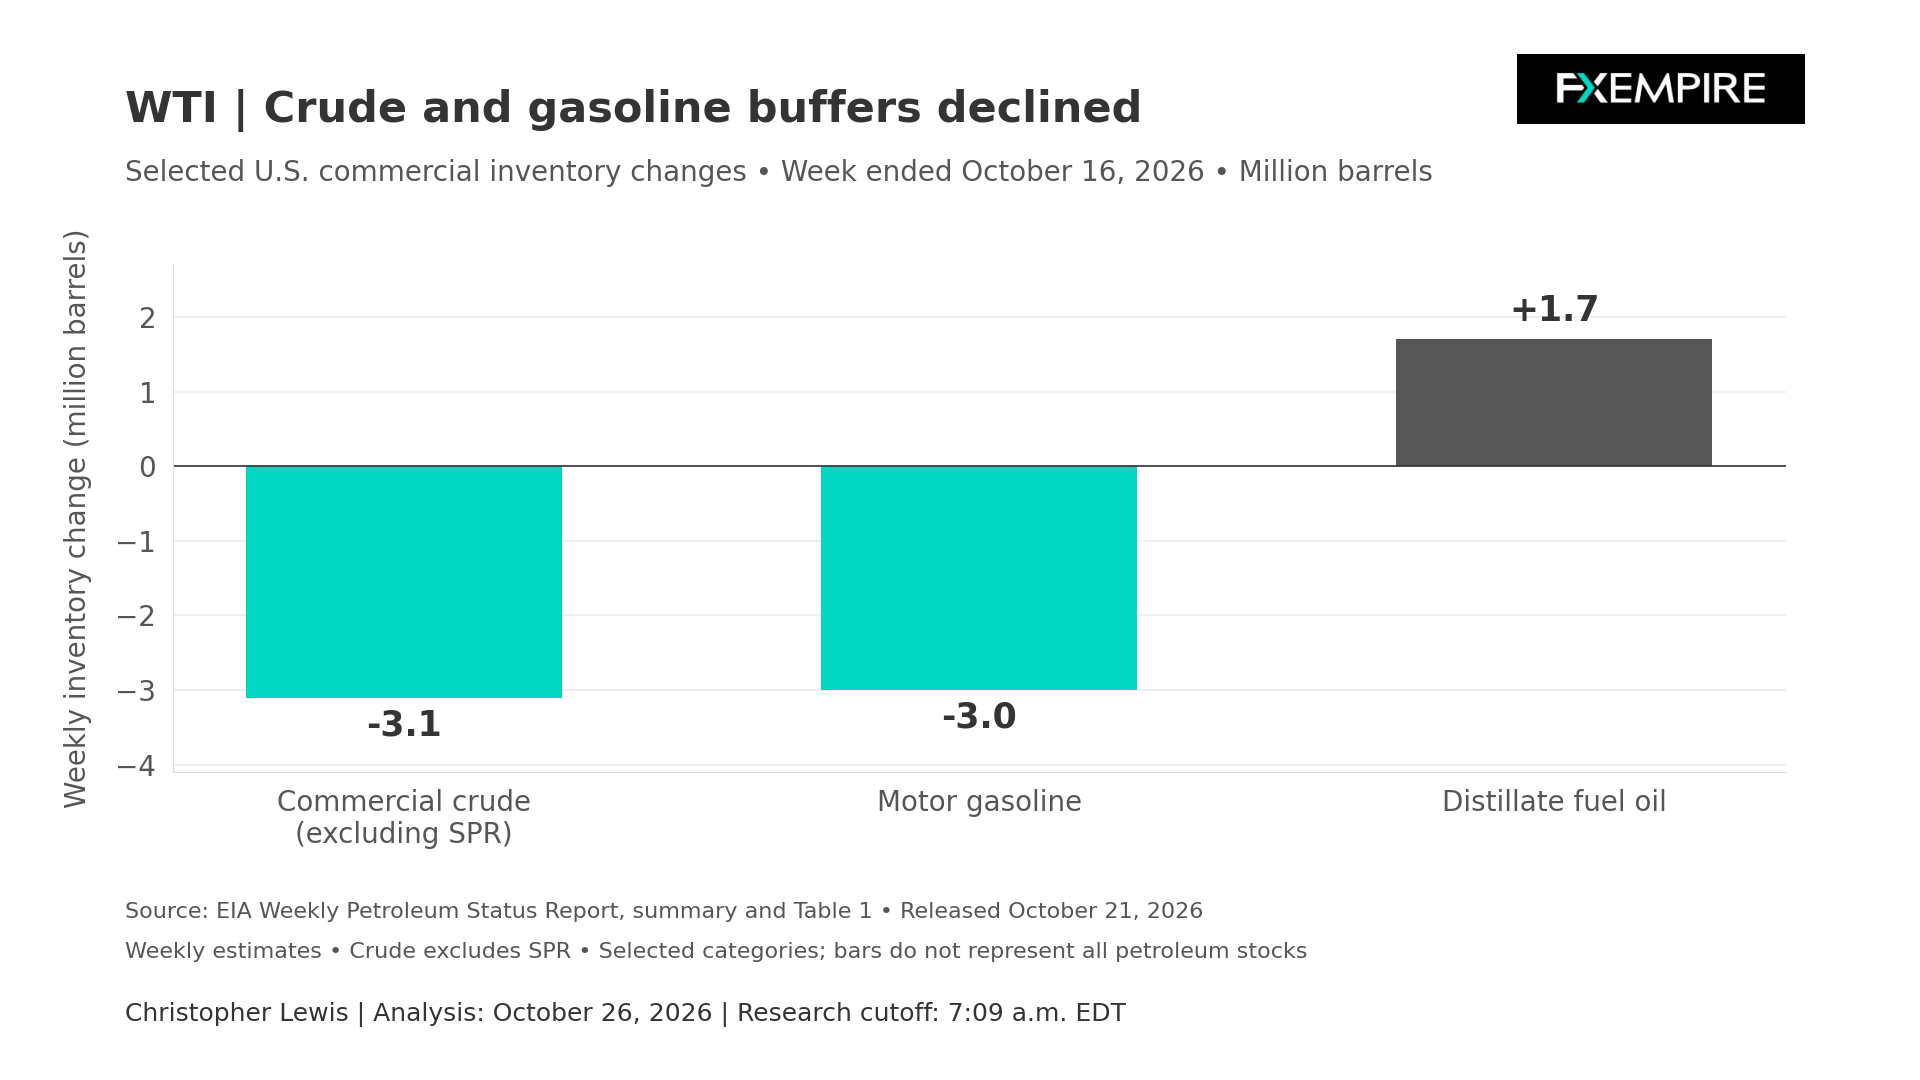
The numbers combined show drawing crude and gasoline buffers alongside some replenishment of diesel and heating oil inventories. The balance sheet detail adds a useful counterweight. Estimated crude exports fell to 3.442 million barrels per day from 4.57 million the previous week. Having a crude draw, therefore, should not automatically be thought of as evidence of accelerating exports.
Sustained refinery demand and further product draws would reinforce concern about available barrels. Softer runs or rebuilding inventories could weaken that argument, even if geopolitical problems persist. The next petroleum update is scheduled for Wednesday, October 28, at 10:30 a.m. Eastern. WTI’s domestic fundamentals favor attention to stock replenishment and refinery continuity more than anything else.
WTI Technical Analysis
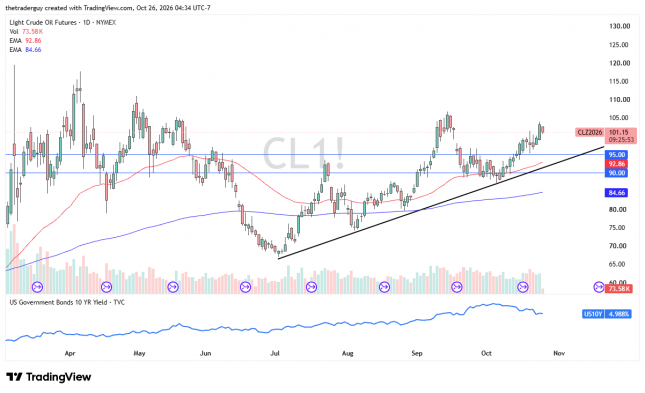
From a technical analysis standpoint, it’s worth noting that the market did gap lower to kick off the Monday session and then proceeded to drop. After the big range on Friday, this may be a little bit of profit-taking, but the technical setup still favors buying dips. As the trend has been decidedly bullish, there seems to be a significant amount of support below near the $95 level.
Brent Oil Price Forecast
Every new Brent Oil analysis as it publishes, today's technical signal and key levels, live price — on one page.
See all Brent Oil forecastsBrent
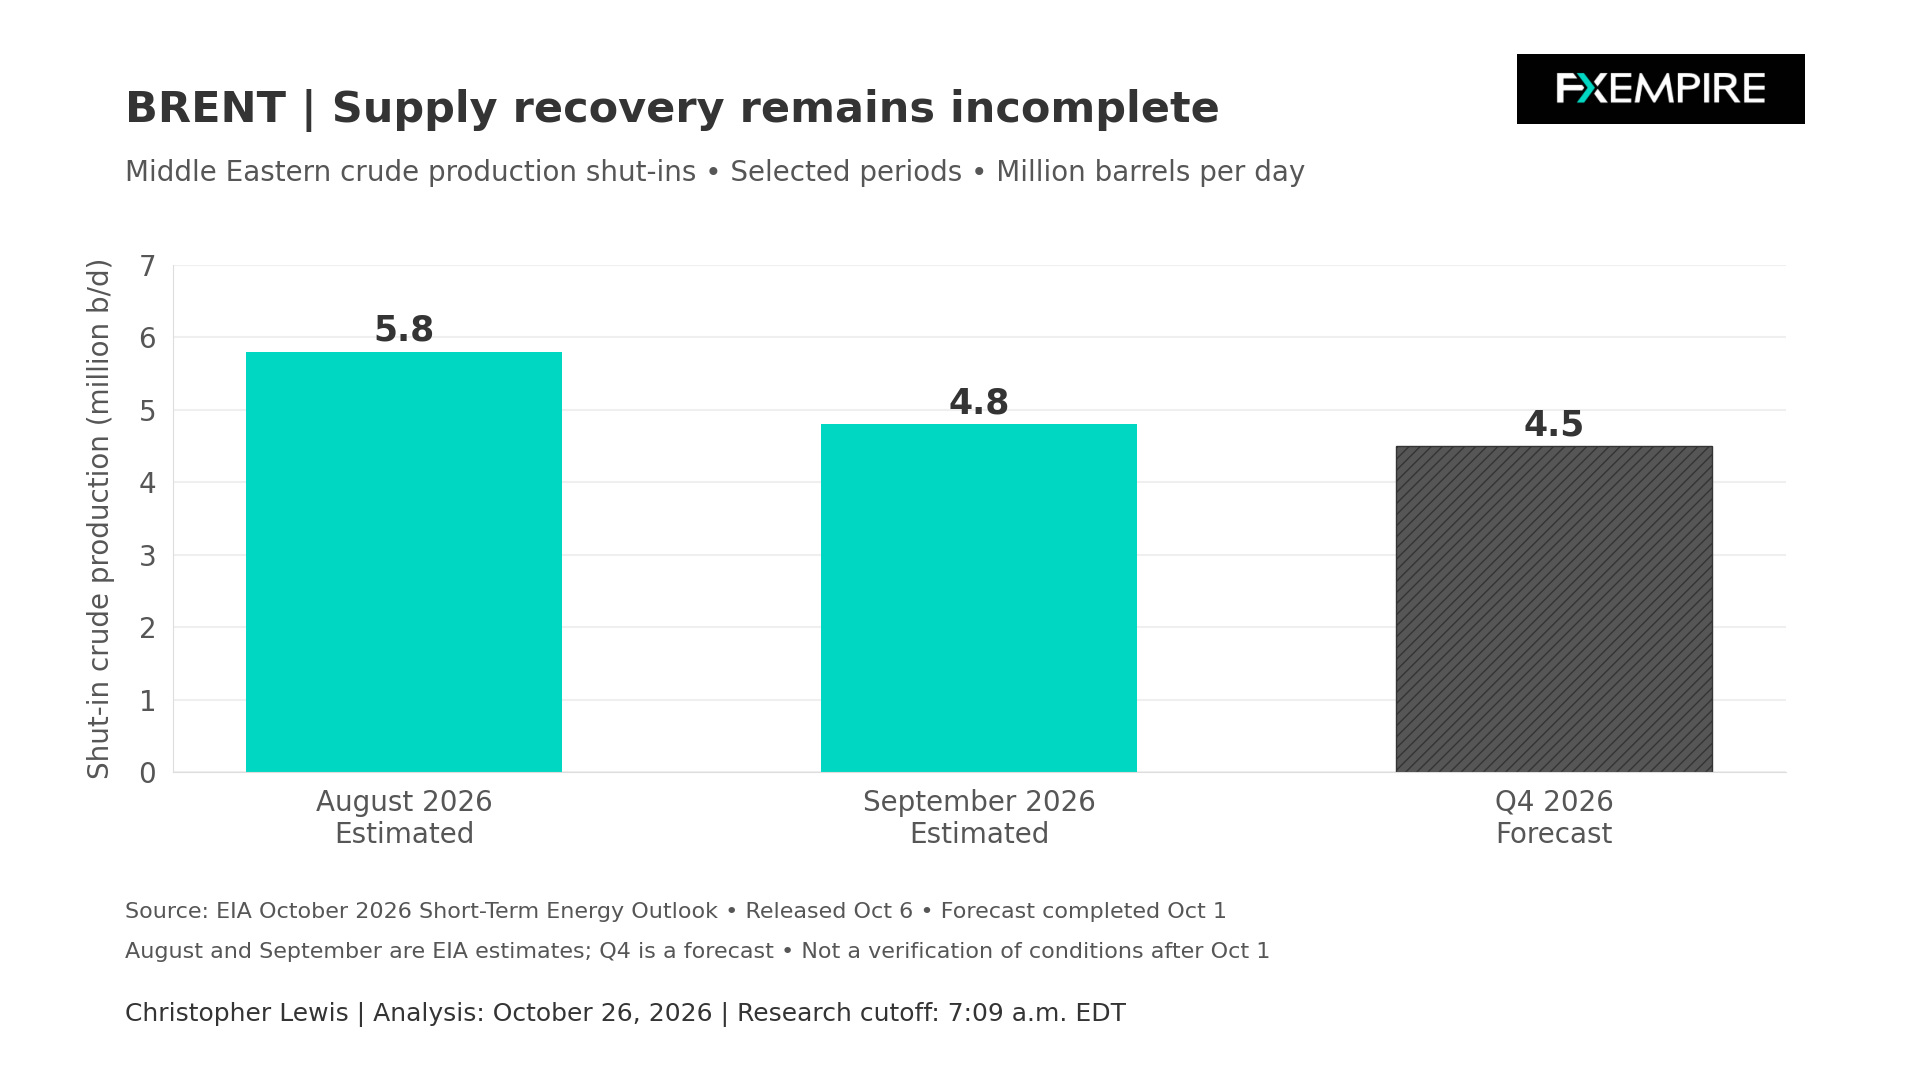
Brent‘s fundamental emphasis is the ability to move international crude to refiners. EIA estimated Middle Eastern production shut-ins at 5.8 million barrels per day in August and 4.8 million in September, with 4.5 million forecast for the fourth quarter. This is a partial improvement from the severely constrained conditions that we had seen earlier in the summer, but not necessarily something that we could describe as normalization.
Withdrawal of Brent Supplies
There are also estimated inventory withdrawals averaging 1.9 million barrels per day in the third quarter and forecast at another 0.7 million in the fourth. This report was released October 6, and its forecast was completed October 1. This does not take into account changes in transport conditions, production, or reserve deliveries that occur after that date.
Clearly, the geopolitical situation can change to shift the discussion and expectations that traders will price in. It’s going to be more or less the pace of supply restoration than simply identifying that some barrels are returning. If the market can replenish, but that replenishment is slower than consumption, a recovery in exports may coincide with scarce immediately delivered crude. On the other hand, sustained restoration of export capacity could weaken the scarcity case before the annual production numbers visibly recover.
WTI and Brent both connect through export economics, product demand, and competition for replacement supplies. But that being said, the exchange in Louisiana addressed a specific domestic delivery problem. It does not establish that international shipping concerns have eased equally. A U.S. commercial draw doesn’t change the global deficit.
Demand Side in Focus This Week
The demand side will be in focus this week, as the Federal Reserve announcement on Wednesday and U.S. GDP and spending data on Thursday may alter some of the conditions involved from the demand side of the supply-and-demand question.
Trading Brent This Week
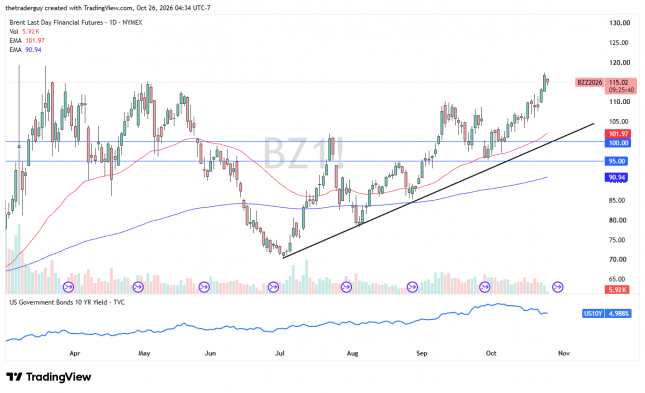
From a technical analysis standpoint, Brent did gap lower to kick off the day, but still remains fairly elevated. At this point, it looks like a very bullish market, with $110 below being a major support level and the $117 level above being a bit of short-term resistance. If $117 gets broken, the next big figure to watch out for will more likely than not be $120. This remains a buy-the-dip market.