


WTI Crude Oil
West Texas Intermediate kicks off the Friday session with the latest weekly U.S. inventory report showing builds across crude and refined products. The EIA’s November 12 Weekly Petroleum Status Report, covering the week ending November 6, showed commercial crude inventories rose 4.7 million barrels to 414.4 million. The Strategic Petroleum Reserve declined 2.6 million to 279.5 million. Gasoline inventories increased 1.8 million to 210.8 million, and distillate stocks rose 4.1 million to 103.3 million.
Crude Levels Still Low Despite Builds
Despite the weekly builds, crude was 3.1% below the readings a year earlier, and distillates remain 6.8% lower. The weekly flow picture shows higher activity on both sides of the crude balance. Imports rose 324,000 barrels per day to 6.698 million. Refinery crude inputs increased 322,000 barrels a day to 17.047 million, and exports increased 347 barrels per day to 7.543 million. Domestic production was estimated at 14.013 million barrels per day, up 10,000 barrels per day.
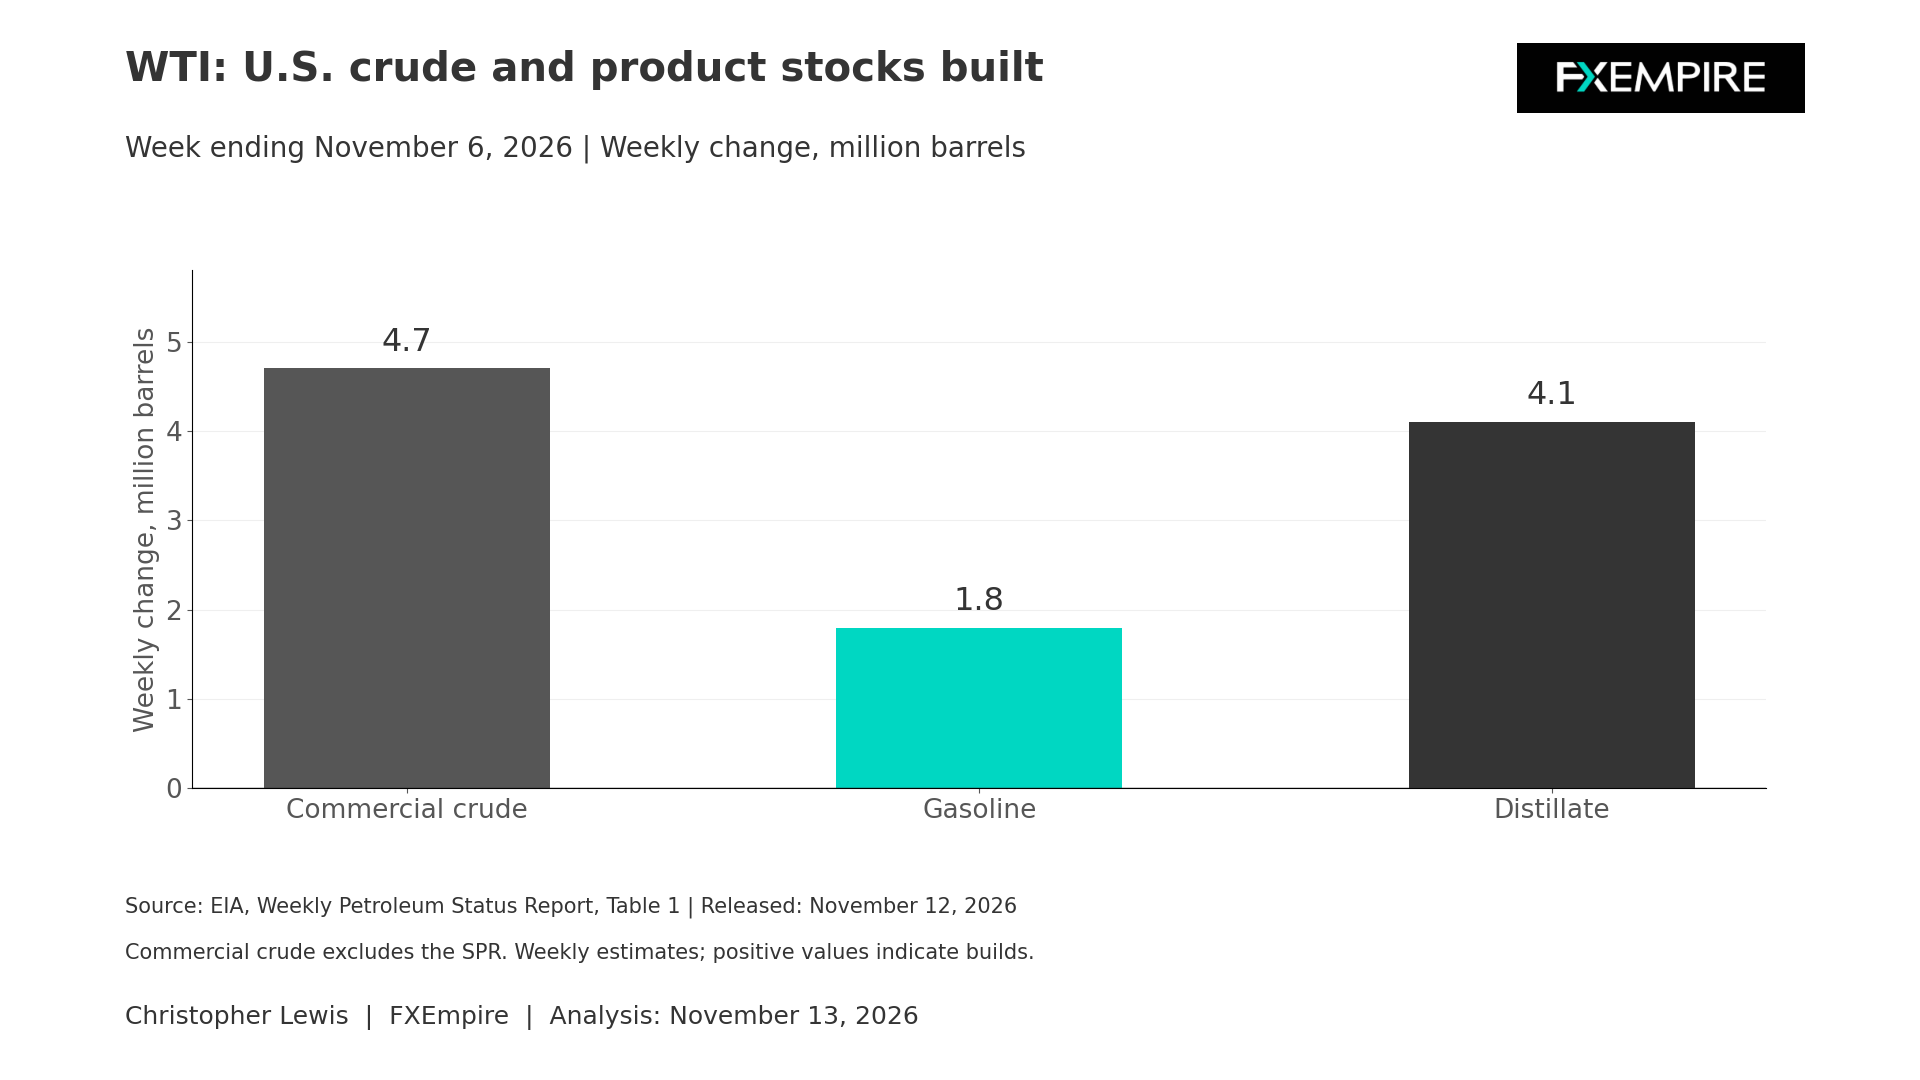
The stock build, despite higher refinery runs, reflects the combined movement in imports, exports, and other components. With readings like this, it’s a bit of a reminder that weekly petroleum data can be very volatile.
EIA Short-Term Energy Outlook
The EIA’s November 10 Short-Term Energy Outlook adds a broader inventory context. It estimates U.S. commercial crude stocks fell to about 410 million barrels at October’s end, the lowest end-October level since 2014. The agency attributes the draw to a wide Brent-WTI spread that encouraged exports and discouraged imports alongside high refinery throughput. It expects inventories to remain below the five-year average through the middle of next year before rebuilding as the spread narrows and domestic production rises.
The November 12 report is the latest official weekly balance sheet at this time. This is a sign that perhaps things are moving in the correct direction, but not necessarily a guarantee. The markets right now have some fundamentally mild supportive action while distillate remains scarce, but it’s conditional. High domestic production and uncertain export flows can quickly soften this balance.
Brent Oil Price Forecast
Every new Brent Oil analysis as it publishes, today's technical signal and key levels, live price — on one page.
See all Brent Oil forecastsTechnical Analysis
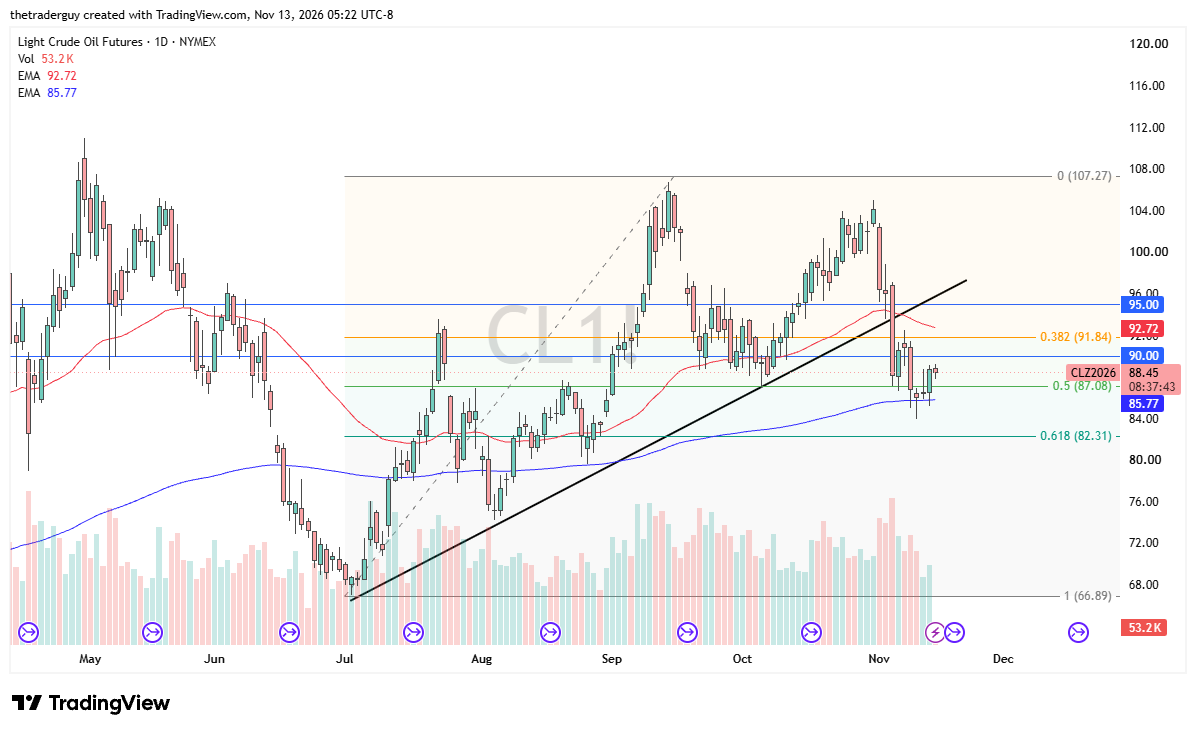
The markets look as if they are trying to rally again, bouncing from the 200-day EMA, perhaps mainly in response to geopolitical tensions, as U.S. President Donald Trump stated yesterday that he did not need a deal with the Iranians. Because of this, I am a buyer of short-term dips as long as we can stay above the lows of the week.
Brent
Brent faces a broader international problem than WTI because its seaborne market is exposed to shipping capacity, tanker security, and, of course, all of the noise coming out of the Middle East. The latest EIA outlook, released November 10, says global crude prices rose for a third consecutive month in October as inventories fell, tanker attacks occurred in the Persian Gulf, and shipping capacity was constrained, with transportation costs increasing.
The agency expects Brent near $100 a barrel for the remainder of the year, while assuming most Middle Eastern production outside Iran returns to pre-conflict averages by the middle of next year. Using this assumption, the EIA projects Brent coming in at $77 per barrel on average next year. This, of course, depends on a gradual return of supply and easing transport constraints.
Any Disruption Could Cause Issues
Any renewed disruption or longer activity could keep available barrels tighter and prices higher than the forecast path. On the other hand, successful restoration of production, improved shipping availability, or weaker consumption could reduce the premium. The EIA also forecasts U.S. crude production at a record 14.3 million barrels per day next year, which doesn’t necessarily determine Brent prices, but it can narrow the Brent-WTI differential through excess supply and changing trade flows.
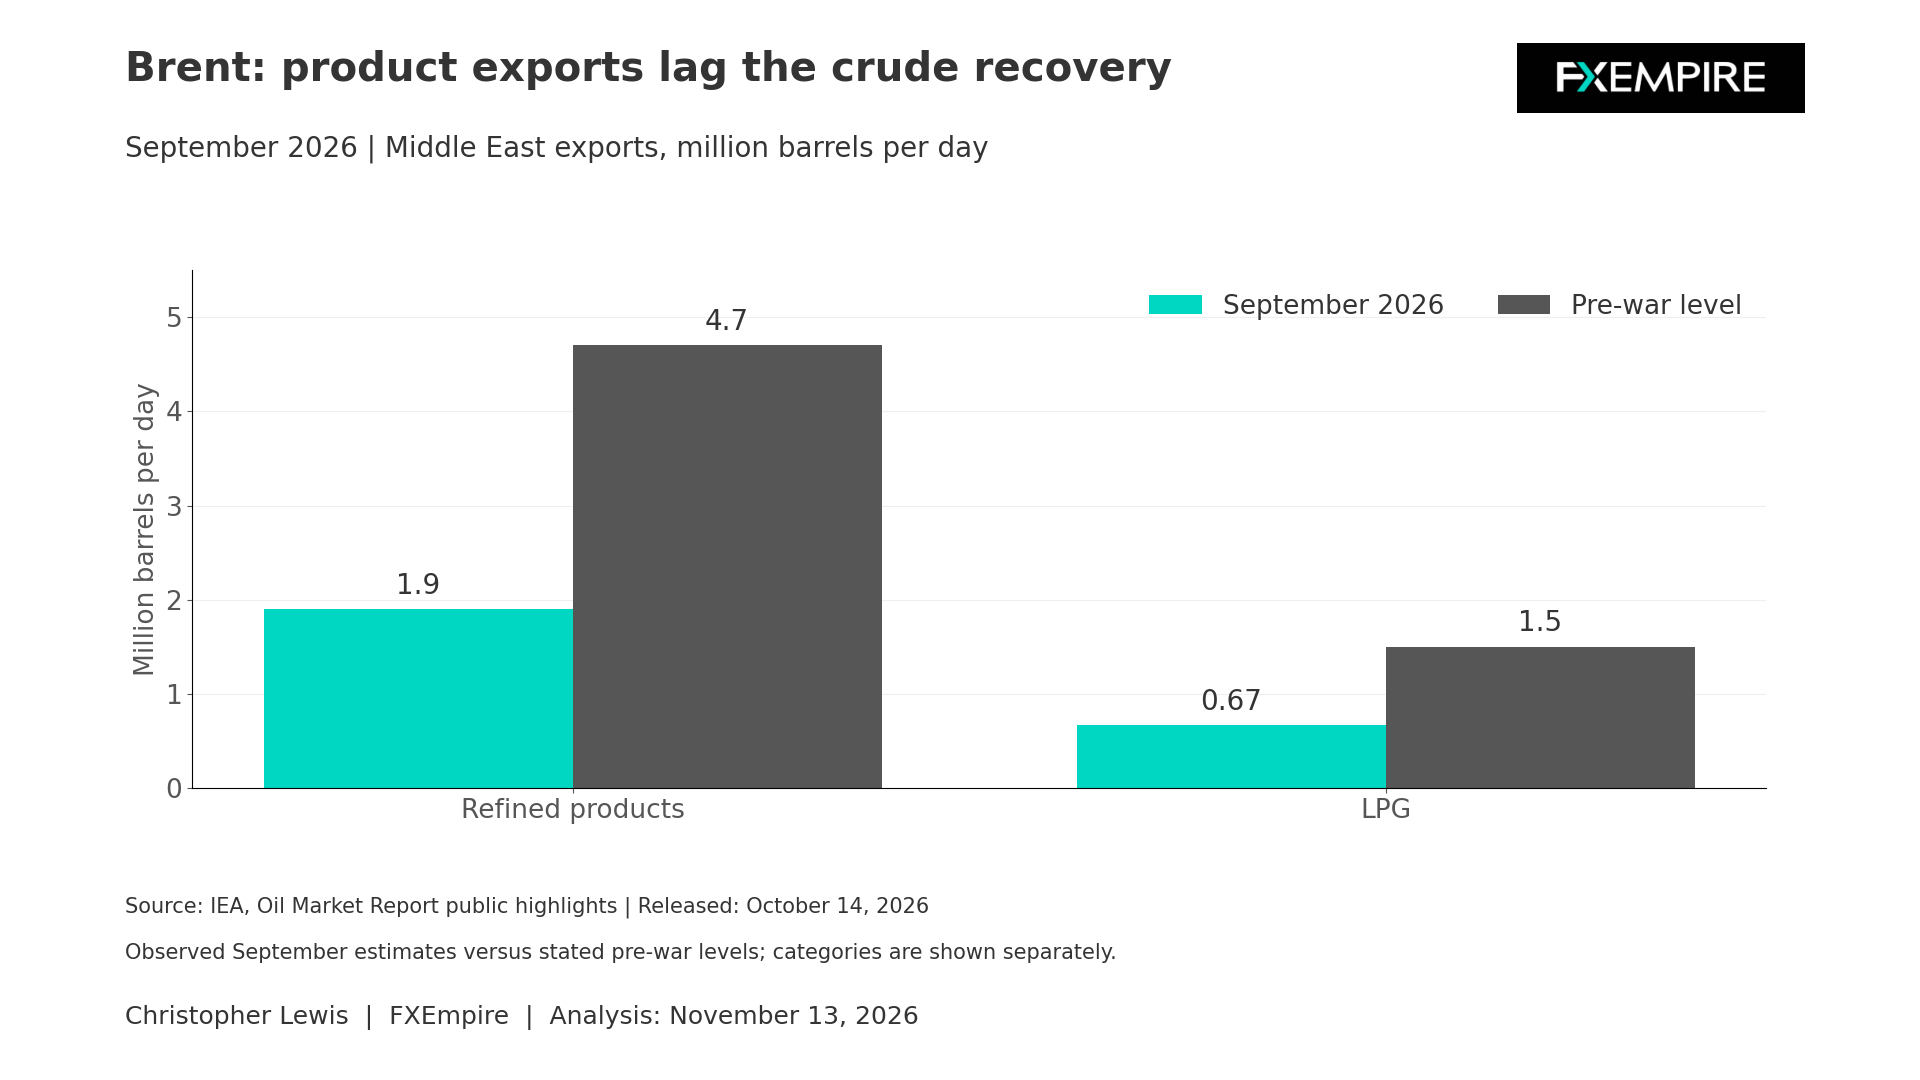
The latest EIA report was finalized on November 5, so of course it does not take the latest headlines into consideration, but it gives us a baseline from which to work. While President Donald Trump described a deal with Iran as unnecessary, the Iranians claim four tankers were struck in the Strait of Hormuz, but Reuters cannot verify that tanker claim. Yemen’s Houthis also reported attacks on Saudi infrastructure in its energy complex. These are risk signals, not necessarily confirmed loss of supply.
Transportation and the Middle East
The Brent market retains stronger geopolitical and freight-sensitive support over WTI, while the EIA’s forecast expects the premium to fade as supply normalizes. The next directional move will come from whether the supply recovery is visible in actual flows, not simply embedded in a forecast.
Technical Analysis
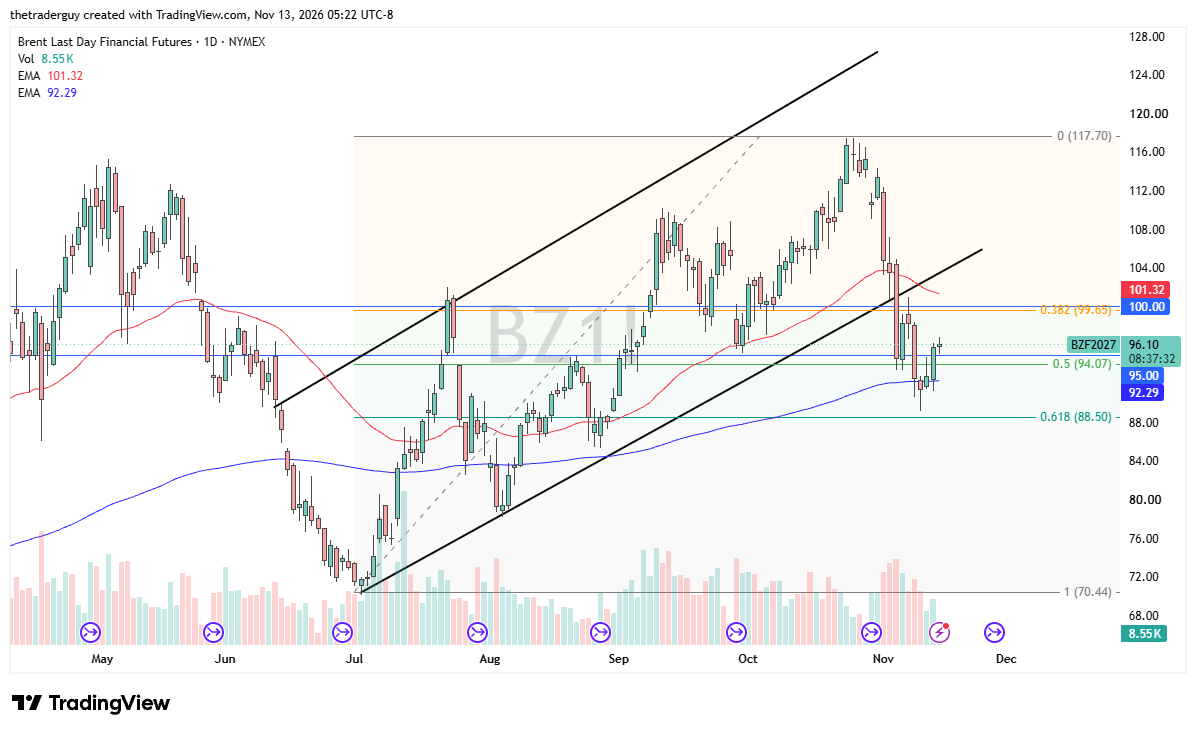
The technical analysis for Brent looks very much like WTI in the sense that we had a very strong Thursday due to those comments coming out of both the Houthis in Yemen and Donald Trump. The question is, can we continue to see upward pressure? I suspect that the market is oversold at this point, and I’ll be using the 200-day EMA as support for a buy-the-dip short-term strategy. I suspect also that while supply has strengthened a bit, there is still quite a bit of fear to be placed around the Middle Eastern trade.