


WTI Crude Oil
The WTI light sweet crude oil contract has a little bit of positive momentum in the early hours of Friday, as the latest U.S. figures show a bit of a bullish signal. The EIA’s October 21 release put commercial crude inventories at 412.517 million barrels for the week ending October 16, down 3.060 million from the previous week. Stocks have declined in each of the last 3 reports, with estimated production falling to 13.269 million barrels per day from 13.679 million, while refinery crude imports have edged up to 16.649 million barrels per day.
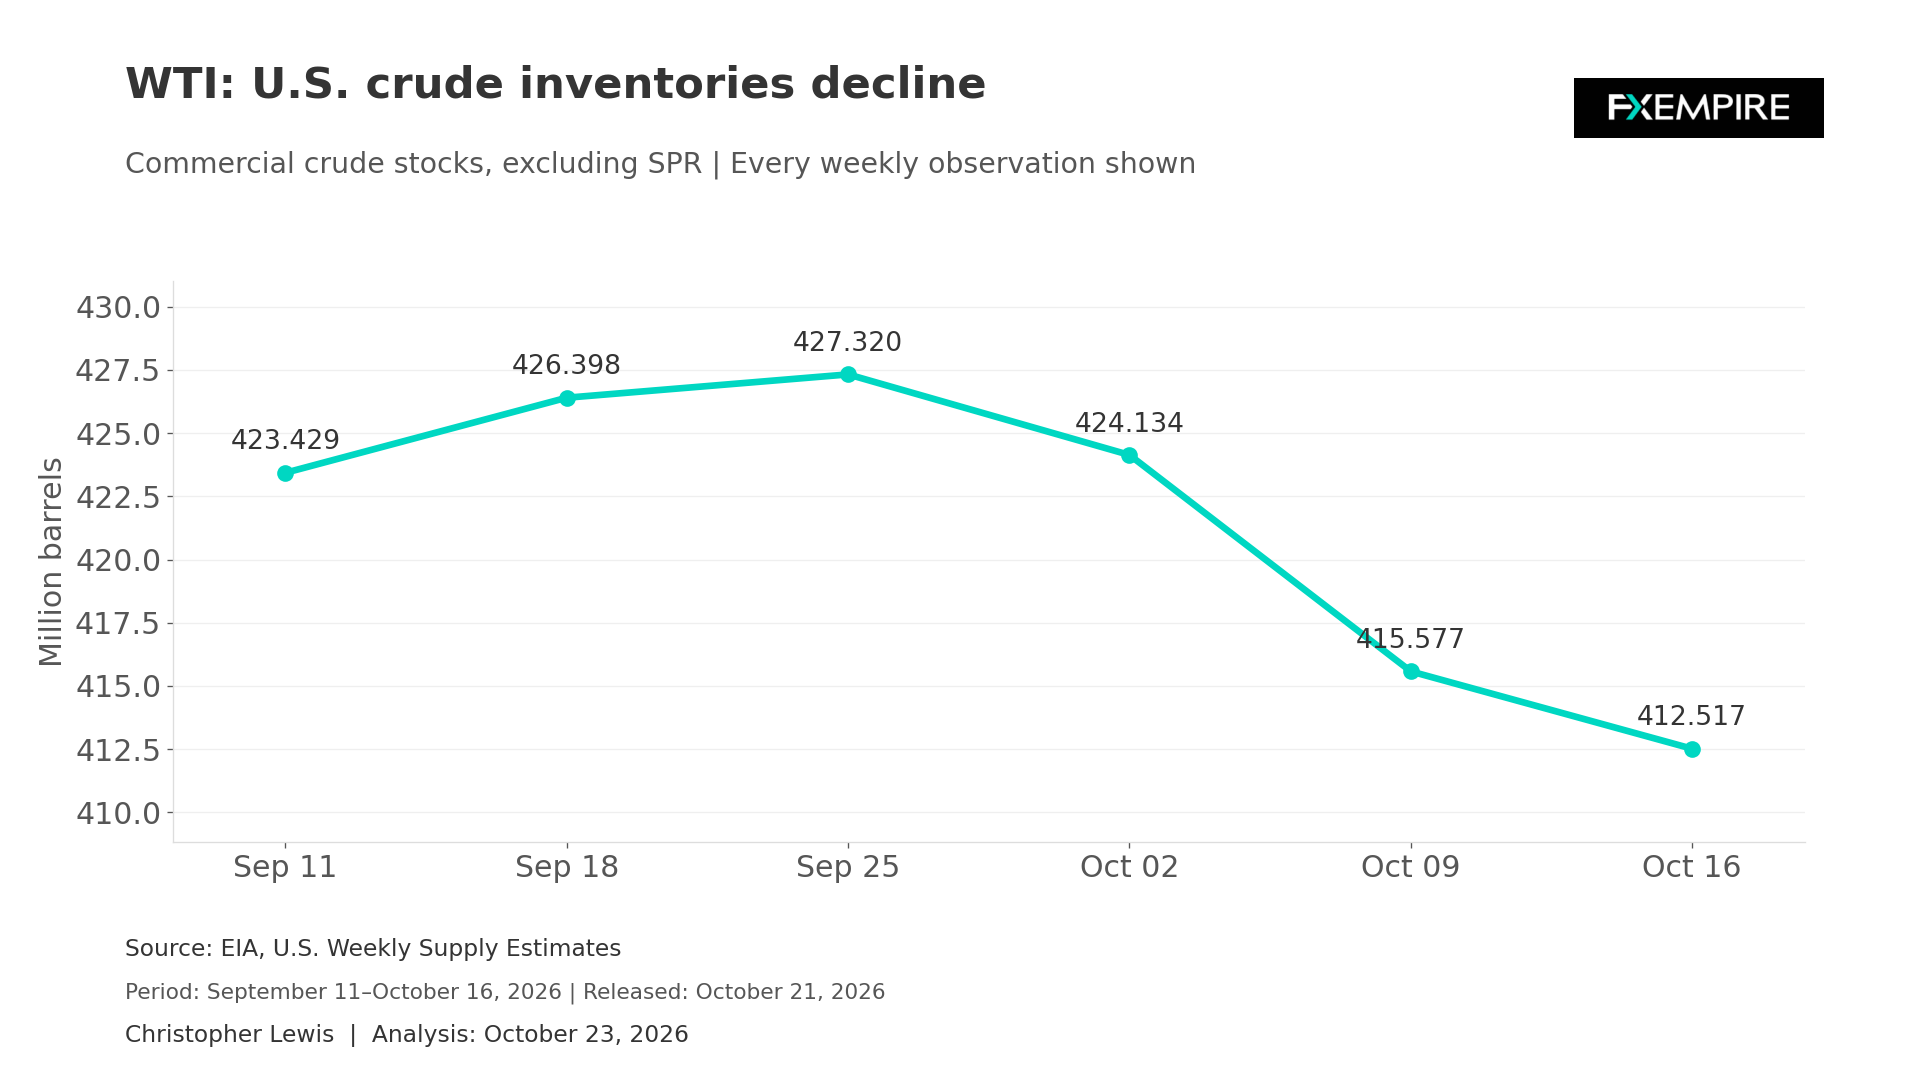
Reduced domestic supply helps explain the inventory pressure. Refineries continue drawing crude into processing while less oil is being produced. This combination is supportive for available barrels, but the durability of the signal will depend partly on whether or not production rebounds. It is important to remember that we are still recovering from the recent hurricane in the Gulf of Mexico.
Refined Product Balance
Product balance is a bit less uniform, with gasoline stocks declining to 205.31 million barrels from 208.262 million, while distillate inventories increased to 104.286 million from 102.611 million. This argues against describing every part of the petroleum ecosystem as tightening simultaneously.
For WTI, this makes the next inventory cycle important. Another draw alongside recovering production would suggest that tighter conditions extend beyond a simple temporary supply reduction. A production recovery combined with slower refinery intake could allow inventories to rebuild. The connection to overseas markets will also matter, as U.S. crude can help satisfy some international requirements, but exports depend on shipping costs, crude quality, and relative prices.
Technical Setup
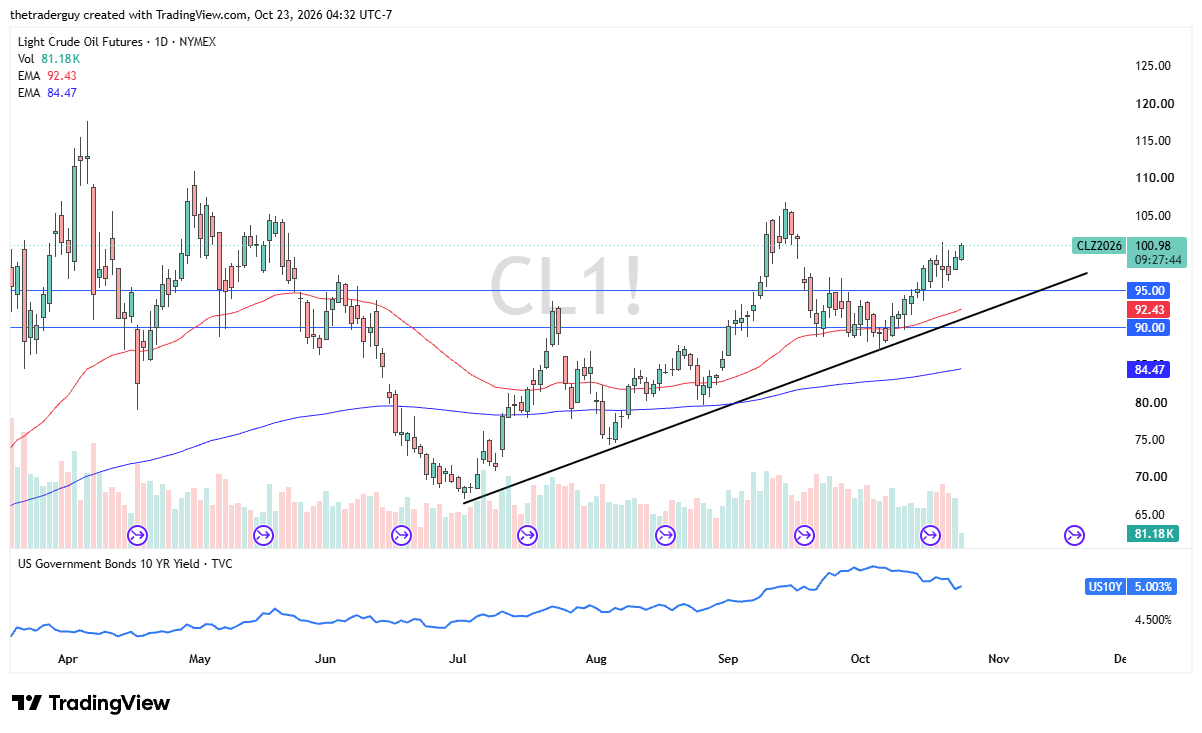
From a technical analysis standpoint, it looks as if the market is trying to break above the crucial $101 level and fill the gap from September 17. This market remains very much a buy-the-dip market and should see significant support near the $95 level if memory in the market holds. This is a general uptrend, and, of course, tensions in the Middle East flaring keep oil somewhat bid.
Brent
Brent also opens the session with some positive momentum and is threatening the $115 level, as its backdrop remains tension between recovering Middle Eastern supply and continuing restraints on its delivery. The most useful way to look at this is between improvement from the worst disruption and a return to normal availability.
Brent Oil Price Forecast
Every new Brent Oil analysis as it publishes, today's technical signal and key levels, live price — on one page.
See all Brent Oil forecastsLatest EIA Report
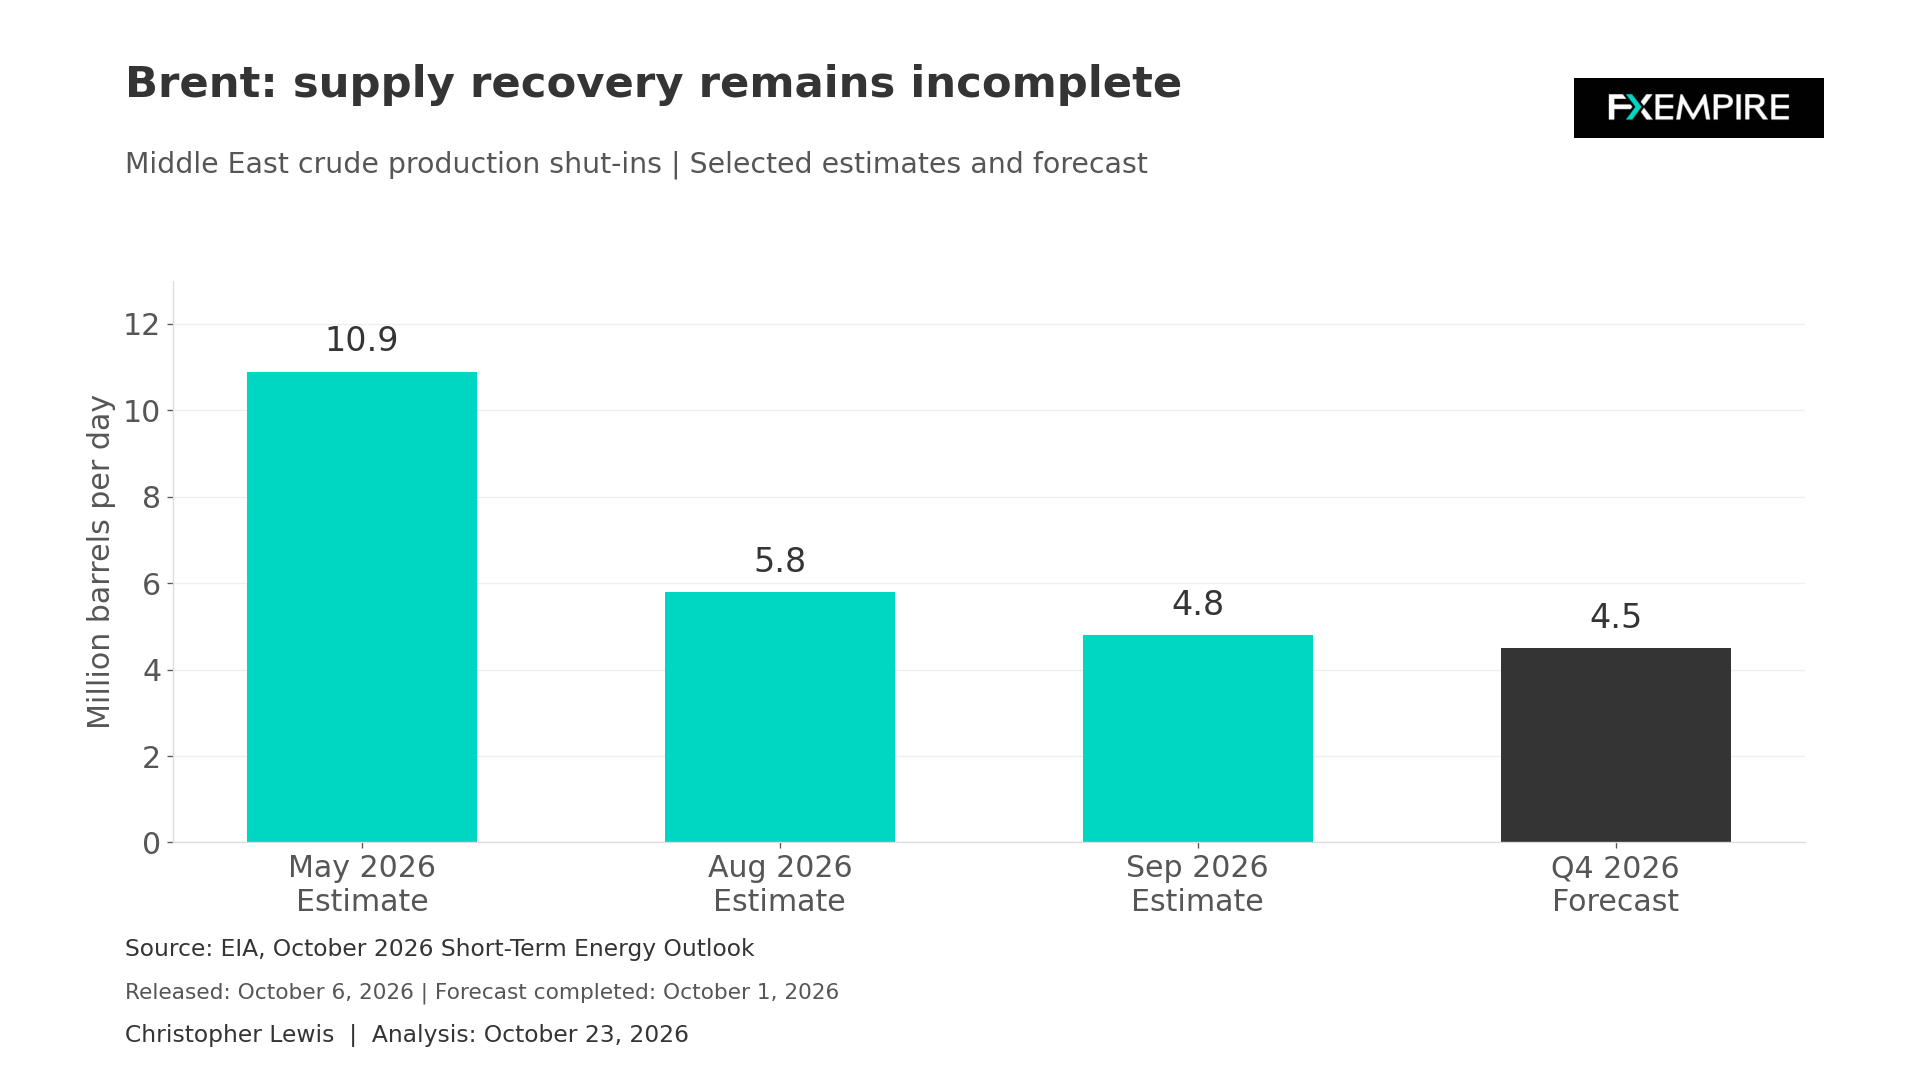
In its October 6 report, the EIA estimated regional crude production shut-ins at 4.8 million barrels per day in September, compared to 5.8 million in August and 10.9 million at the peak in May. It forecasts average shut-ins of 4.5 million barrels per day in the fourth quarter.
Restored output should ease competition for replacement barrels at the margin, but that being said, a recovery that leaves substantial production unavailable can coexist with a tight market. EIA estimates global inventory depletion at 1.9 million barrels per day in the third quarter and projects another 700,000-barrel daily draw in the fourth. If this turns out to be true, the pace of tightening would slow without stocks actually rebuilding. It would be an improvement, but you would still be worried about drawing on inventory instead of newer production coming to refineries.
Technical Setup for Brent
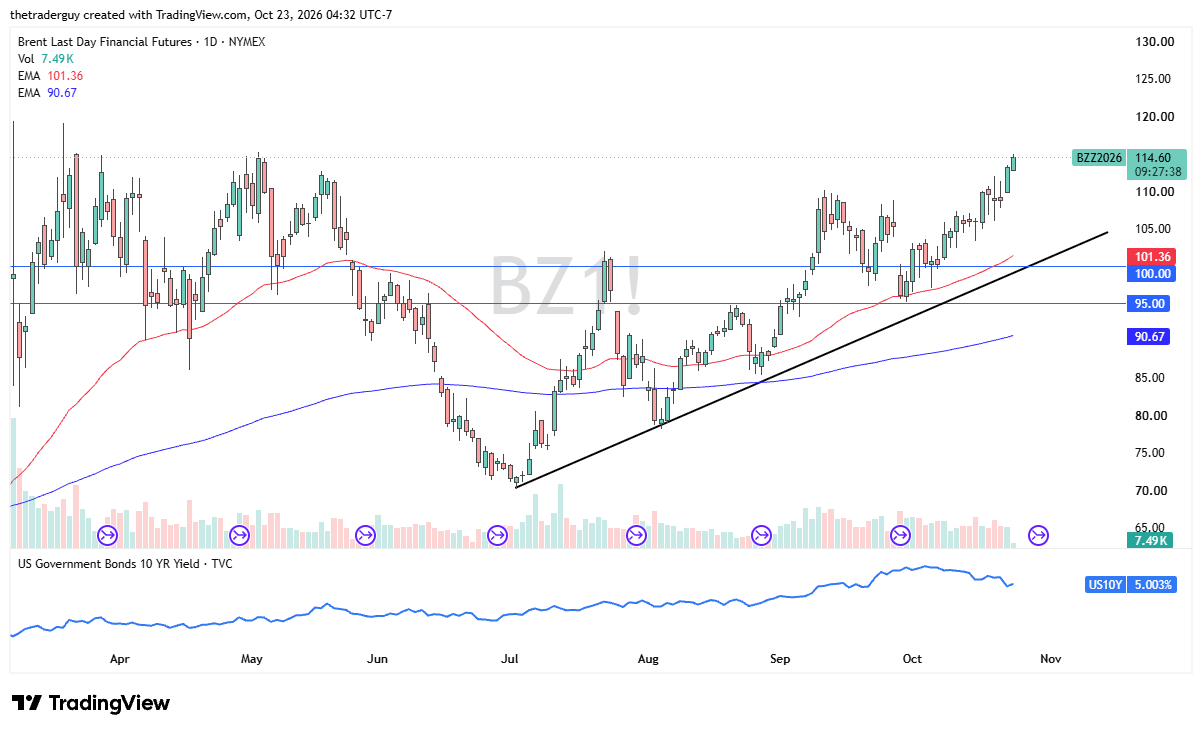
From a technical analysis standpoint, it looks as if Brent is doing everything it can to break above the $115 barrier, an area that looks to be important from market memory and action in spring. Short-term pullbacks at this point in time, therefore, should be looked at as potential opportunities, as there is so much in the way of bullish pressure here. Breaking out above the $116 level could bring more of a FOMO trade to the forefront.