


WTI Crude Oil
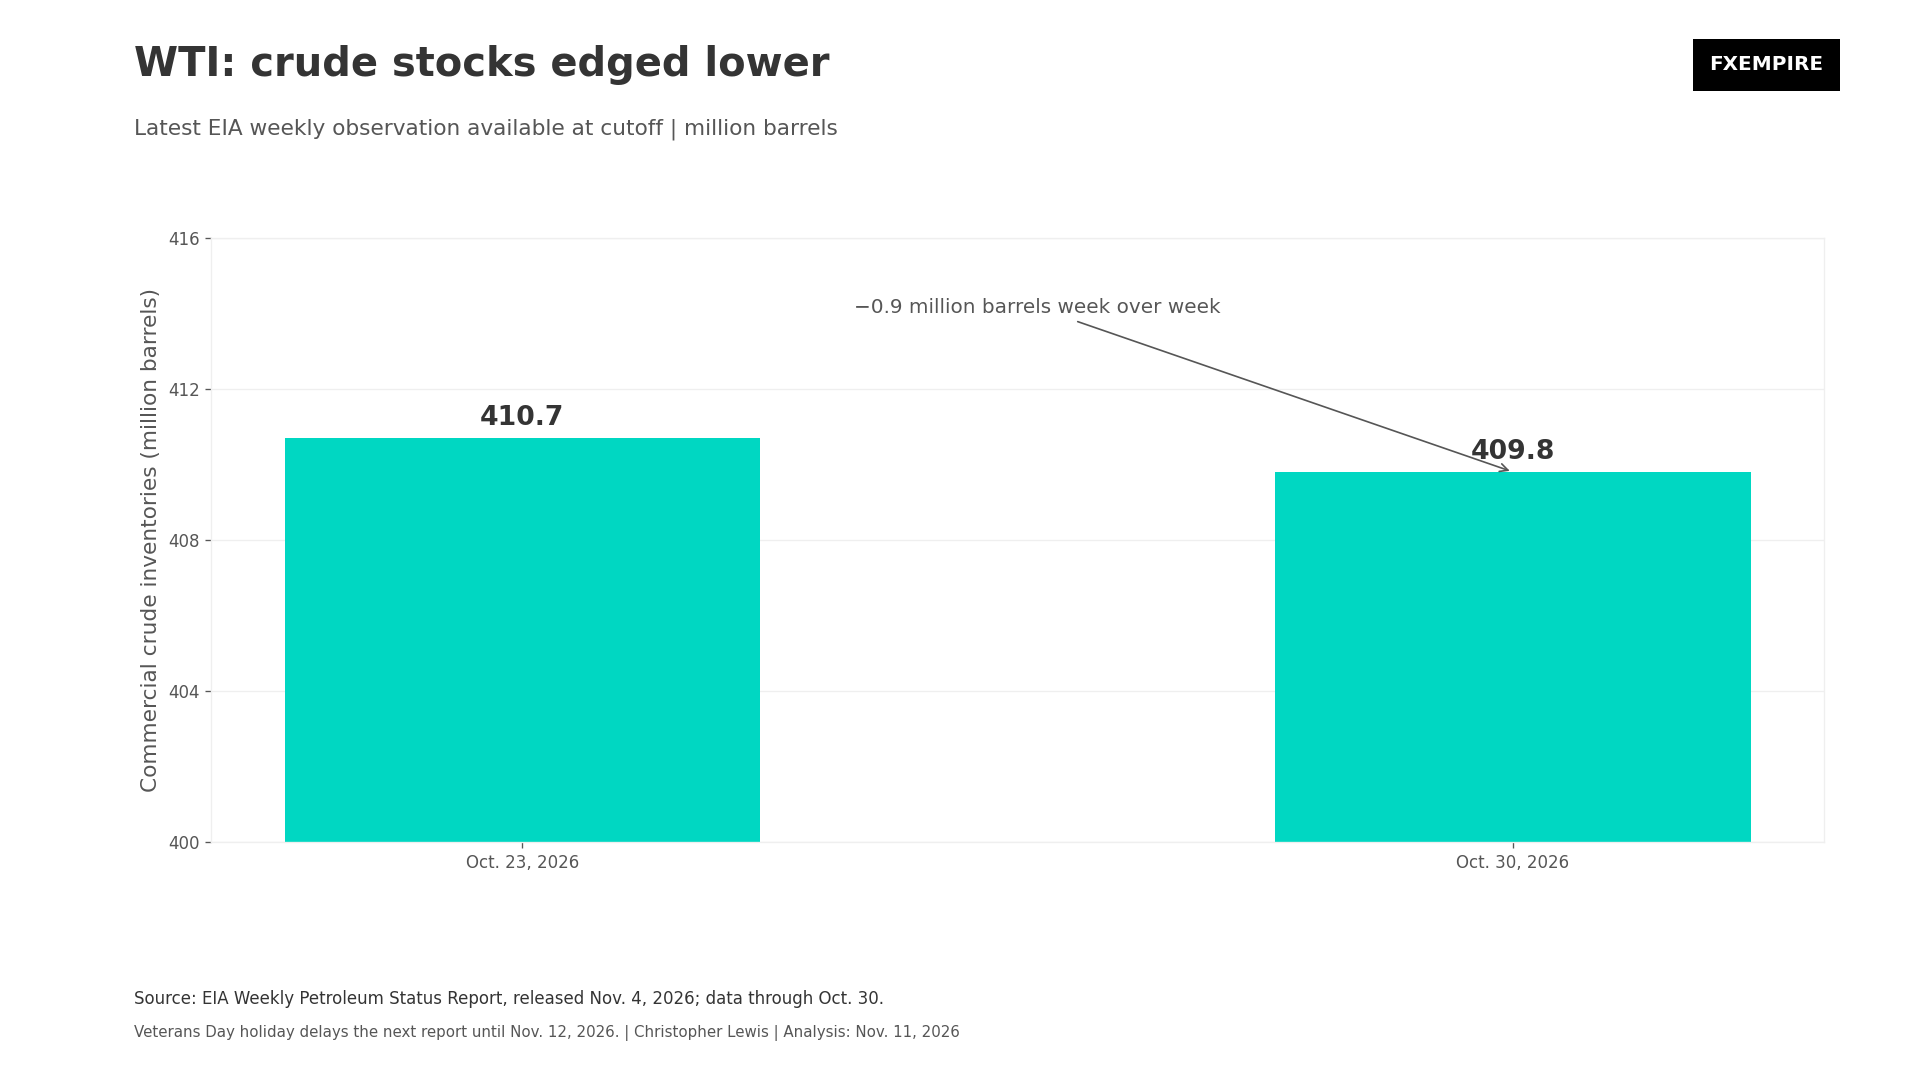
West Texas Intermediate crude kicked off the Wednesday session with the latest U.S. inventory report still pointing at a tight product balance, while crude supply itself remains well supported. The EIA’s November 4 Weekly Petroleum Status Report, covering the week ending October 30, estimated commercial crude inventories of 409.8 million barrels, a weekly decline of 900,000 barrels. The Strategic Petroleum Reserve fell 400,000 barrels to 282.2 million. Gasoline inventories declined 200,000 barrels to the 209 million-barrel level, while distillate stocks dropped 3.6 million to 99.3 million barrels.
The biggest concern will be distillate inventories, which are 11% below their levels last year. This will leave less cushion for winter demand if refining operations are disrupted or other distillates are needed for heating, etc.
Both Bullish and Bearish Takeaways From Flow Picture
The weekly flow picture gives us both bullish and bearish points. U.S. crude production was estimated at 14.003 million barrels per day, up 11,000 barrels a day. Refinery crude inputs rose just under 200,000 barrels a day to 16.725 million. That higher refinery demand explains why crude inventories declined despite the fact that we’ve seen steady production.
At the same time, crude exports fell 1.179 million barrels a day to 3.675 million, while imports were little changed at 6.374 million. The export decline reduced overseas demand for U.S. barrels, so the crude draw cannot be treated as proof of any structural supply issues.
EIA’s Short-Term Energy Outlook
The EIA’s November 10 Short-Term Energy Outlook adds a broader inventory context. It estimates U.S. commercial crude stocks fell to about 410 million barrels at October’s end, the lowest October level since 2014. The agency attributes the draw to a wide Brent-WTI spread that encouraged exports and discouraged imports, alongside high refinery throughput. It expects inventories to remain below the five-year average through the middle of next year.
Today is Veterans Day in the United States, and it delays the next weekly petroleum report. The EIA schedules the report covering November 6 for Thursday, November 12, with the report being released at noon Eastern Standard Time. Until then, the market doesn’t have any official weekly balance sheet, and most of the action will be very limited in North America.
Brent Oil Price Forecast
Every new Brent Oil analysis as it publishes, today's technical signal and key levels, live price — on one page.
See all Brent Oil forecastsThe Chart
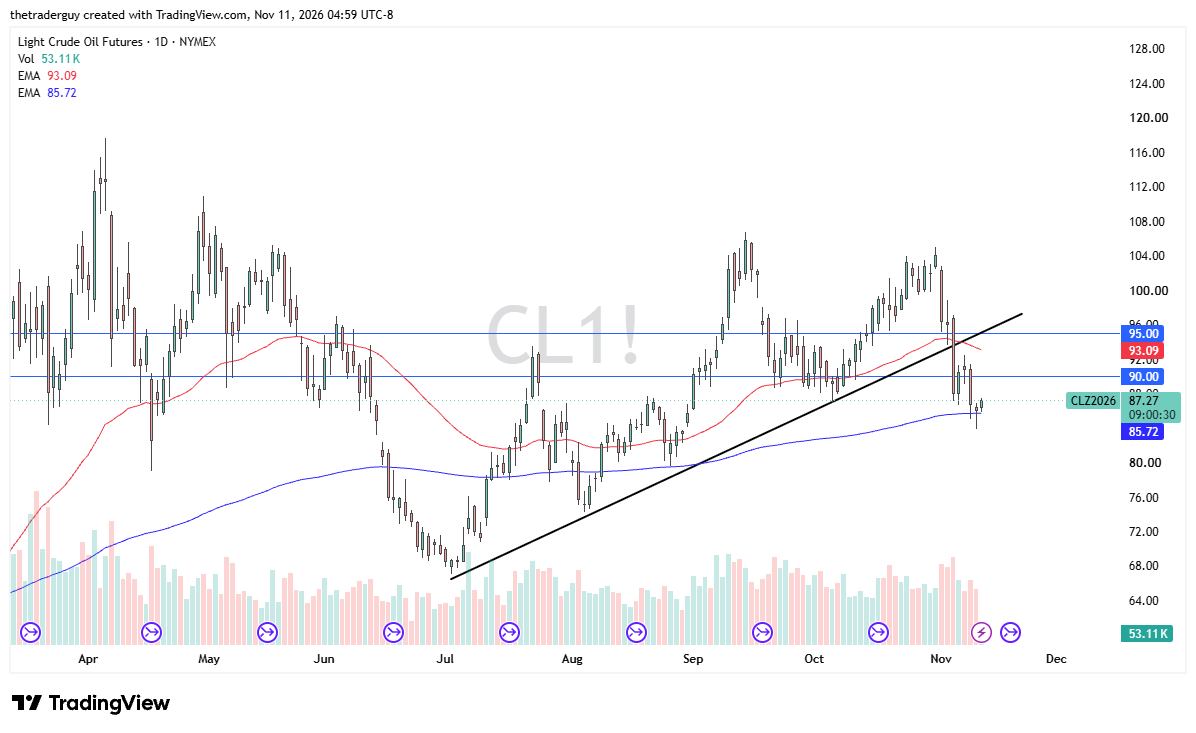
The fundamental view is mildly supportive while distillate remains scarce, but it is conditional in the sense that high domestic production and uncertain export flows can quickly soften the balance. What we have seen early during the trading session on Wednesday has been a bit of a recovery, as the light sweet crude market has bounced from the crucial 200-day EMA. The question now is whether or not crude oil ends up breaking above the $90 level.
Tensions remain in the Middle East, and Donald Trump continues to go back and forth with his hawkish and dovish stance with Iran. Quite frankly, we are probably in a wait-and-see mode.
Brent Crude Oil
Brent faces a broader international risk premium than WTI because it is highly dependent on seaborne traffic. It is exposed to shipping capacity, tanker security, and Middle Eastern flows. The latest EIA outlook, released November 10, says global crude prices rose for a third consecutive month in October as inventories continue to fall. Tanker attacks occurred in the Persian Gulf, shipping capacity was constrained, and transportation costs have increased.
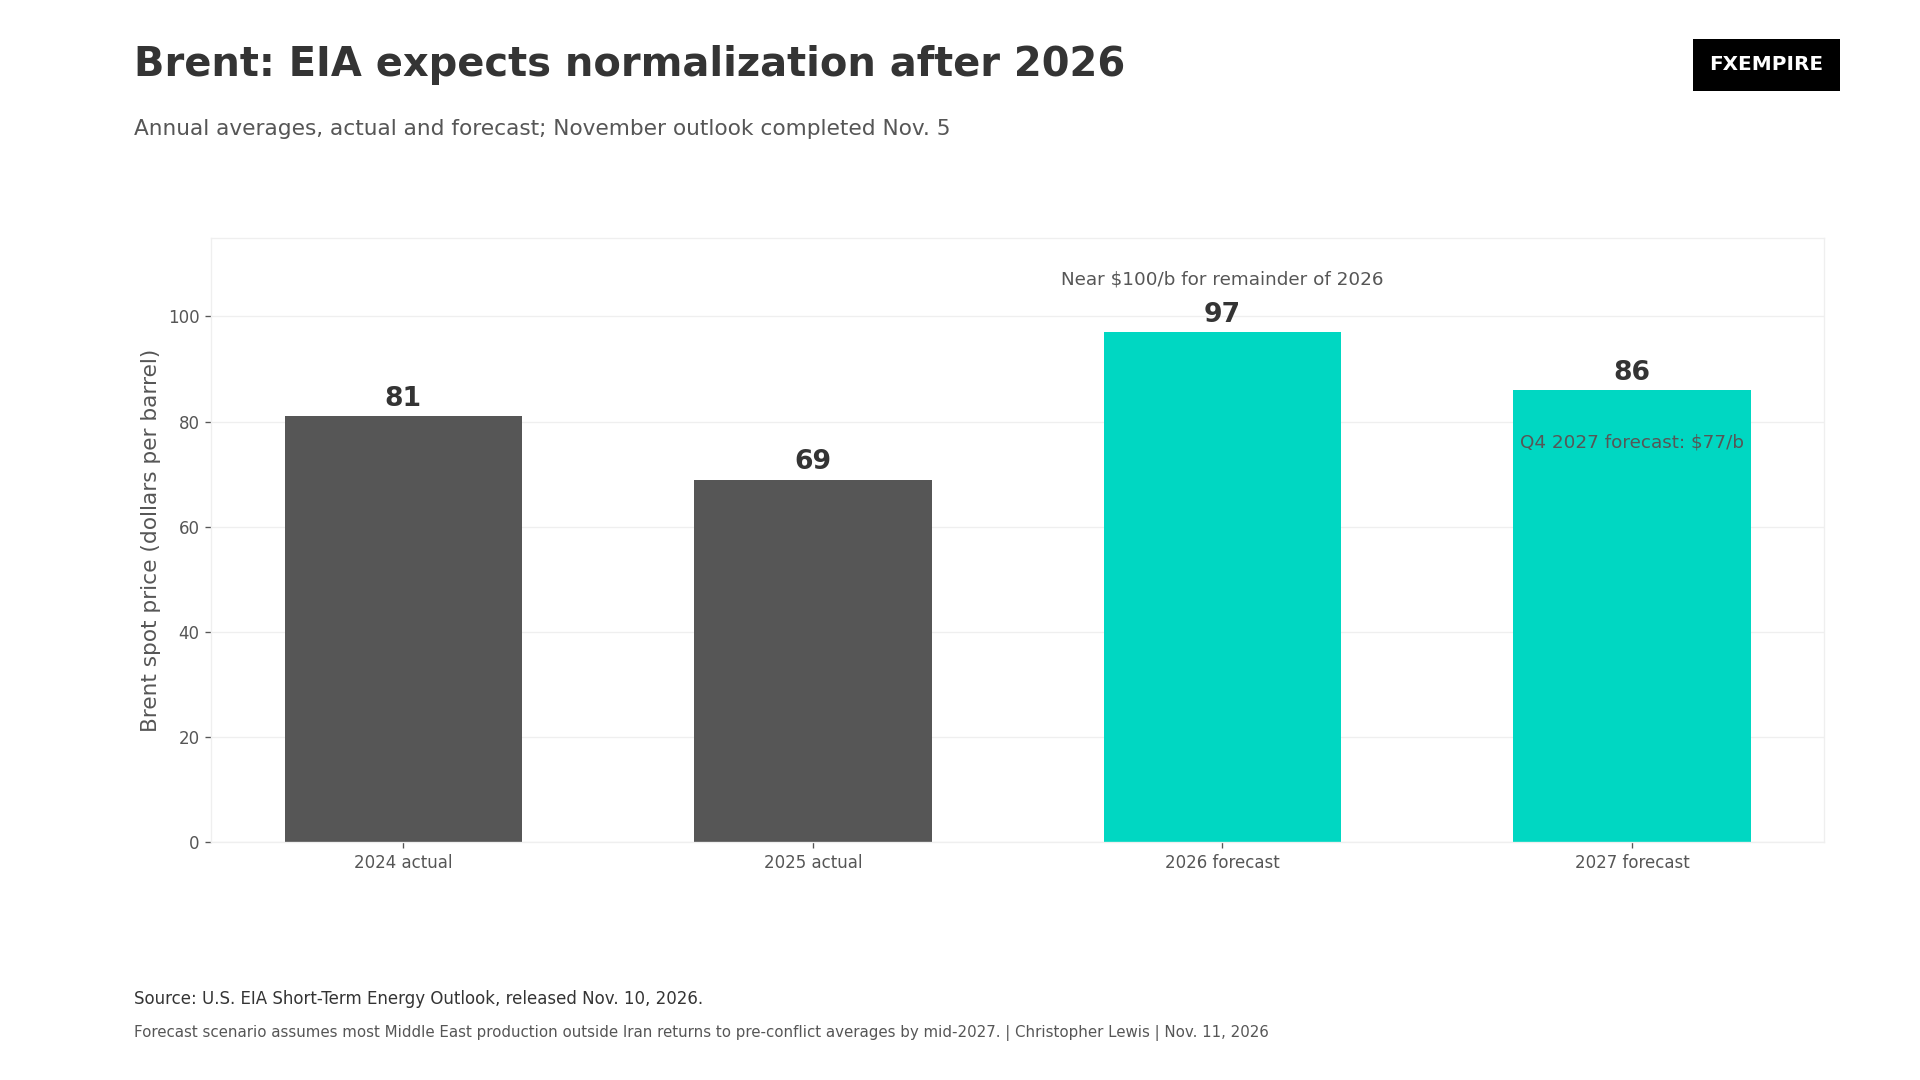
The EIA expects Brent near $100 a barrel for the remainder of the year, while assuming Middle East production outside Iran returns to pre-conflict averages by the middle of next year. Under that assumption, it expects Brent to average $77 in the fourth quarter of next year as global inventories rebuild. This will depend on a gradual return of supply and easing transport constraints.
Any renewed disruption or longer recovery could keep available barrels tighter and prices higher in the meantime. Conversely, the successful restoration of production, improved shipping availability, or weaker consumption could reduce the premium.
US Production to Help Ease Brent Concerns?
The EIA also forecasts U.S. crude production at a record 14.3 million barrels a day in 2027. While that doesn’t directly determine Brent, it can increase Atlantic Basin supply. The EIA finalizes its model inputs on November 5 before the November 10 publication, and any market developments after that date warrant checking the Thursday EIA petroleum data and subsequent updates on shipping production in the Middle East.
Brent Technical Outlook
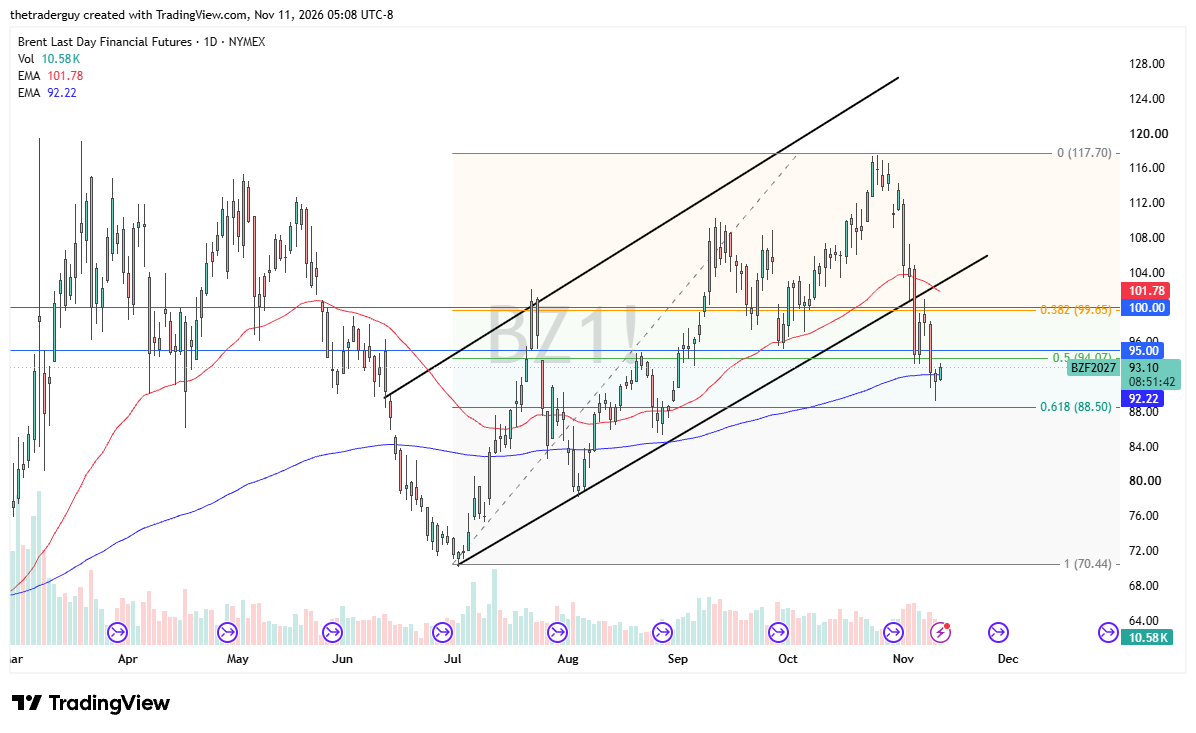
Brent remains a higher geopolitical risk and freight-sensitive market than WTI, and it is worth noting that it too has bounced from the 200-day EMA after a massive sell-off. The problem with the Brent market is that it is heavily influenced by geopolitics. Regardless, when we look at the market, it has sold off so much that one would not be surprised at all to see some type of attempt at recovery.
For what it’s worth, we are bouncing from the 61.8% Fibonacci retracement level as well, so it does look like a recovery could be the next phase.