


Bearish Momentum Builds Ahead of Earnings
Palantir Technologies (PLTR) is showing increasing technical weakness, with Friday’s breakdown adding to signs that the stock may be vulnerable to further short-term downside. However, the company reports its Q3 2026 results after the close on Monday, November 2, which could keep volatility elevated and complicate the near-term technical outlook. On Friday, a bearish continuation signal triggered following the first pullback after the breakdown of a rising bearish wedge from two weeks ago.
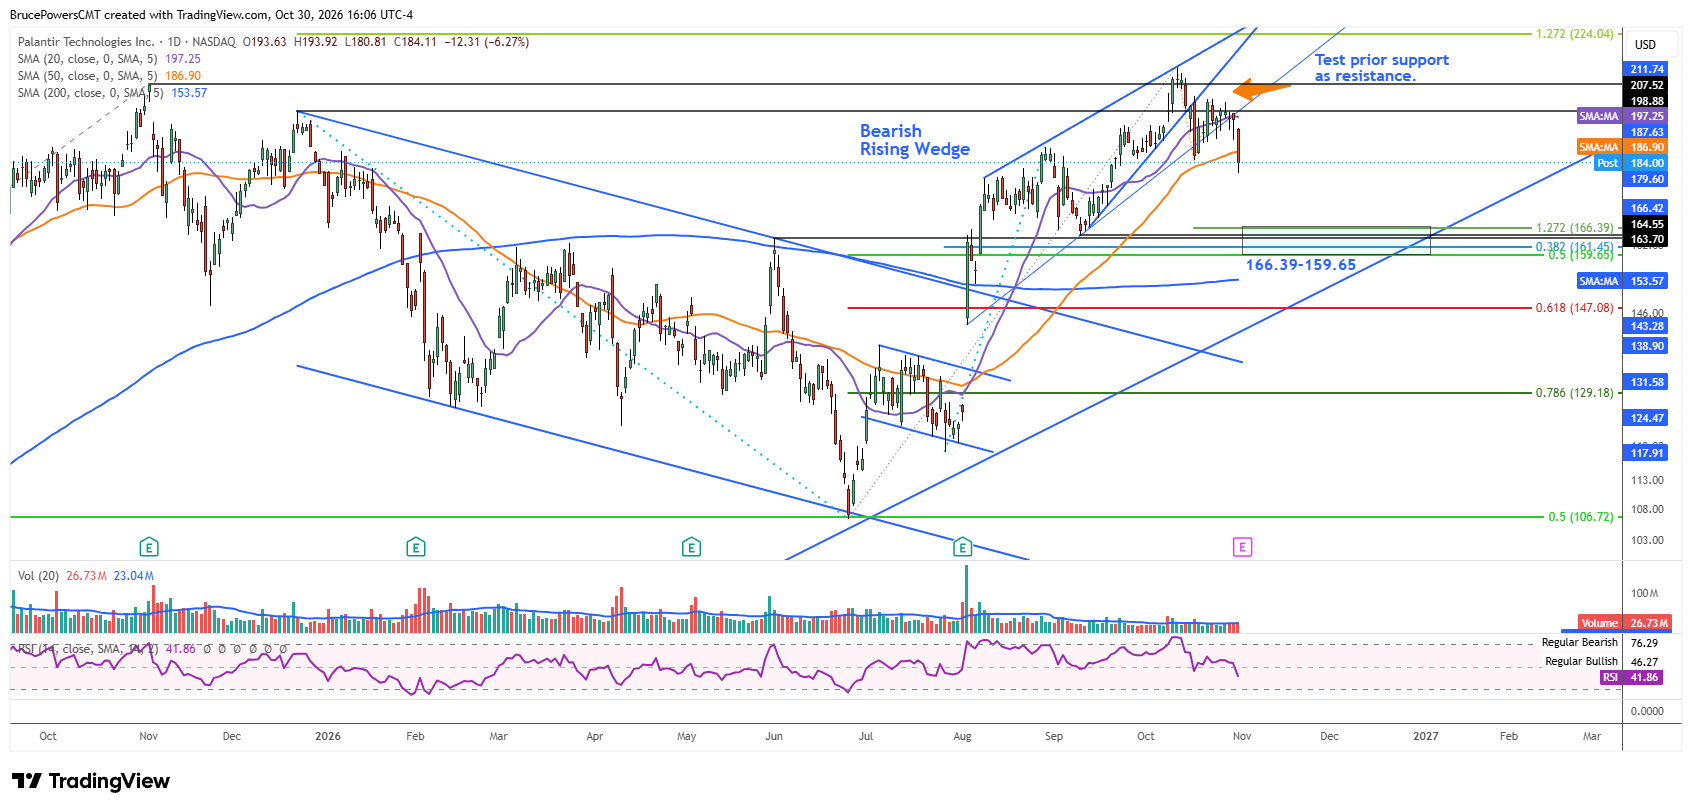
Breakdown Confirms Weakness, Puts $180.81 in Focus
Weakness on Friday was confirmed by a decline below the recent swing low at $184.45. The stock also fell below the 50-day moving average near $187, with a daily close below the average confirming the loss of support. Friday’s low of $180.81 now defines short-term support, and a break below it would trigger another bearish signal. Until that level is violated, however, it remains a potential area for a pause or short-term rebound.
Deeper Support Zone Emerges Near $160–$166
The wedge pattern suggests a potential downside target near the beginning of its formation, around the September swing low at $164.55. That level is reinforced by the confluence of support indicators from approximately $166.39 to $159.65. This creates a broader support zone that could attract buyers on an extended decline. If that zone fails, the 200-day moving average near $154 marks the next lower potential support level.
Countertrend Rallies Face Increasing Resistance
Given the potential downside, rallies from here would be countertrend and vulnerable to resistance, potentially setting the stage for another leg lower. Since the 200-day moving average was reclaimed on August 4, it has not been tested as support during the pullback. The absence of a successful retest may increase the risk that PLTR eventually falls through the next support zone, particularly if selling pressure persists following earnings.
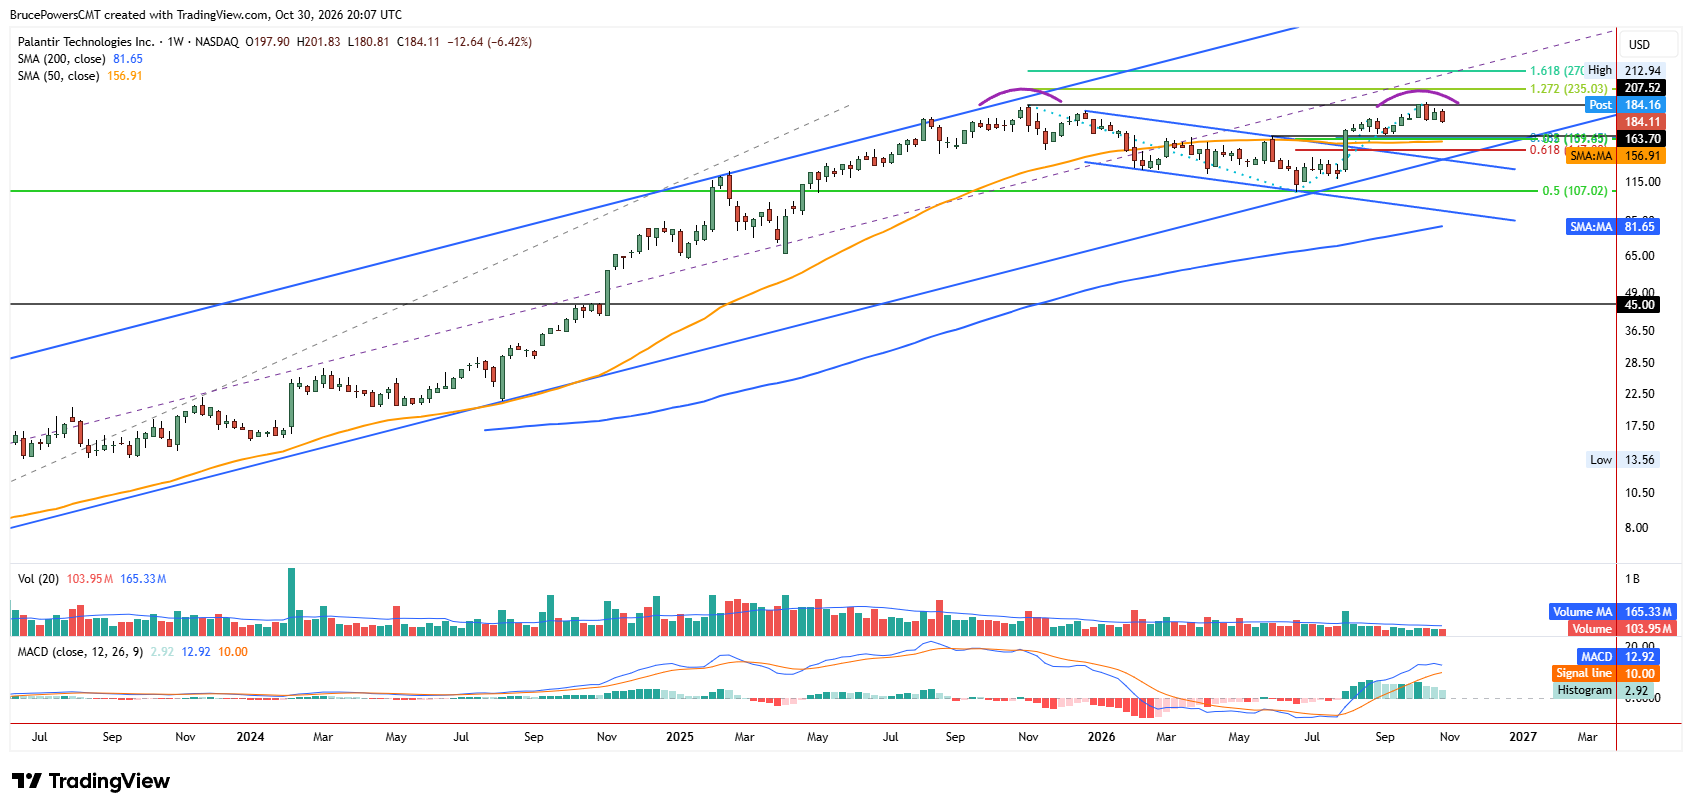
Weekly Chart Reinforces Broader Downside Risk
The weekly chart adds to analysis, showing the potential development of a double top pattern, and key dynamic support near the 50-week moving average around $157. That average aligns closely with the daily chart’s 200-day moving average near $154, reinforcing the importance of the broader support area. The alignment also strengthens the significance of the September swing low at $164.55, which sits just above this confluence. In that sense, the daily and weekly charts point to a similar downside region, bringing the analysis back to the key levels that could determine whether the recent weakness develops into a deeper correction.
If you’d like to know more about technical analysis and how traders use it, please visit our educational area.