


Two Breakouts Put PAAS Bulls on Watch
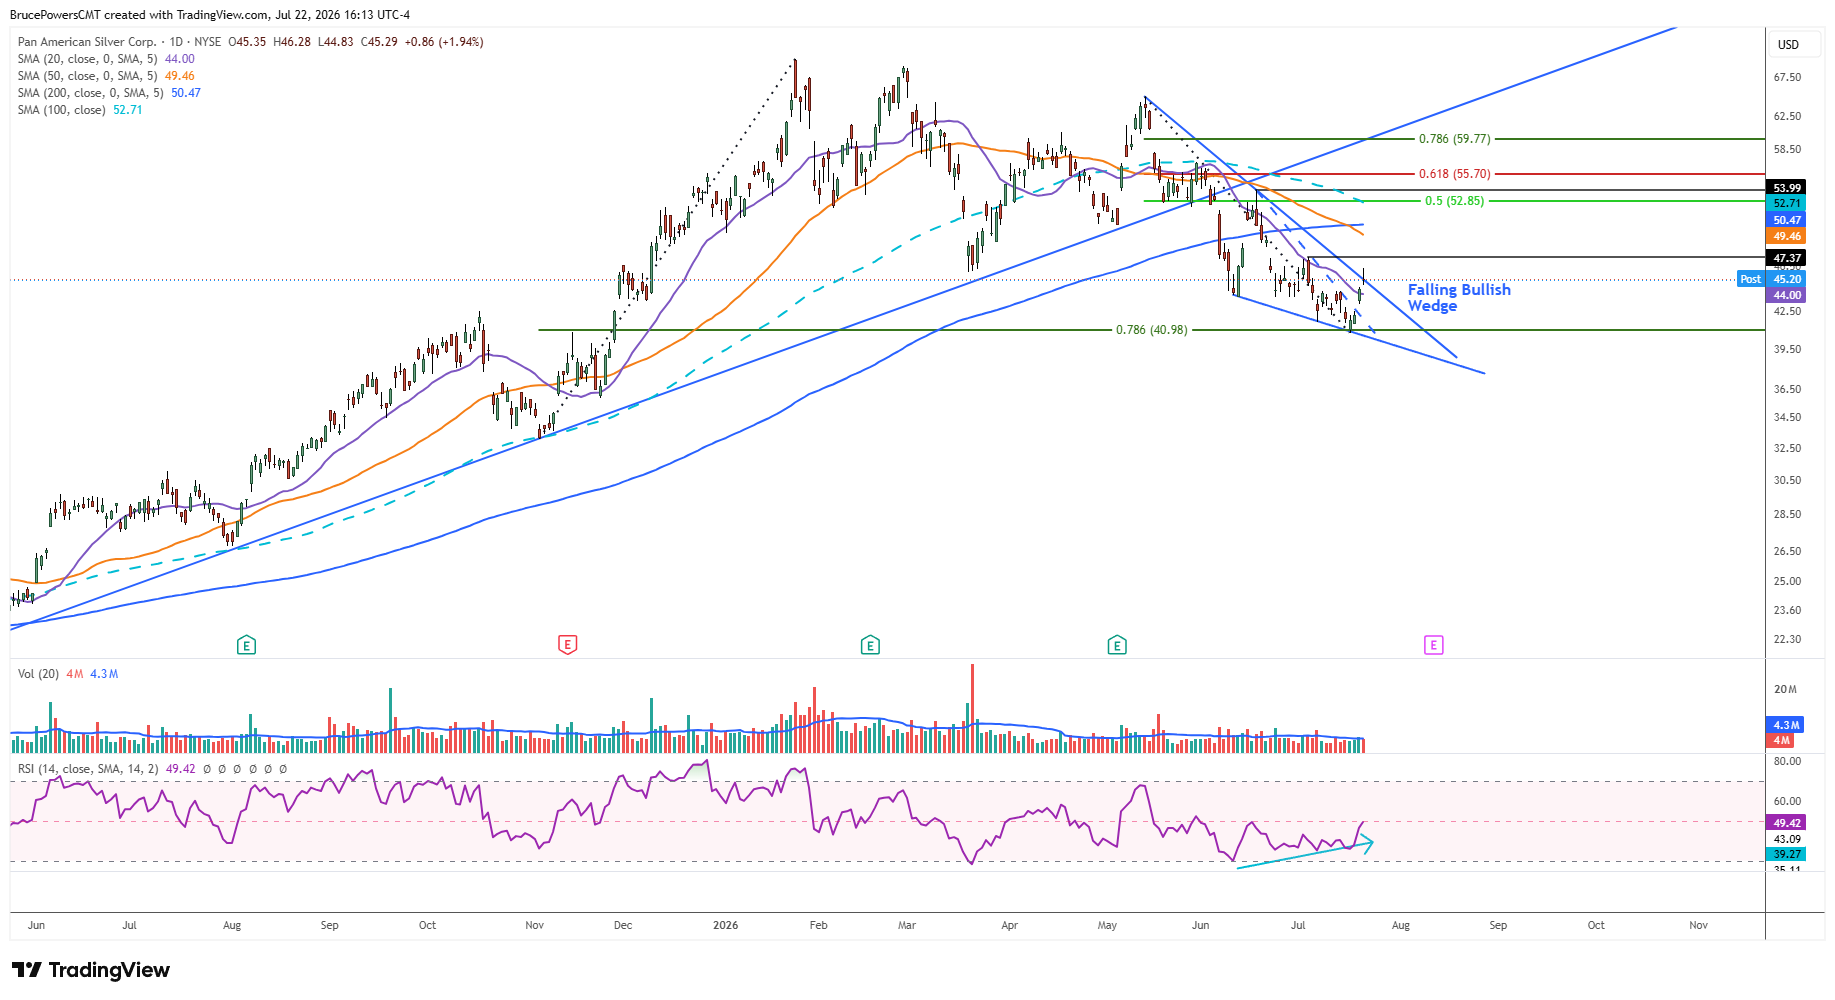
Pan American Silver Corp. (PAAS) stock triggered two upside breakouts this week, generating bullish reversal signals for the corrective decline that recently found a bottom after completing a 78.6% Fibonacci retracement of the prior advance. The company is a large precious-metals minor focussed on silver. An upside breakout from a falling bullish wedge triggered on Tuesday, along with a confirmed reclaim of the 20-day moving average.
That average has represented dynamic resistance since the breakdown triggered in mid-May. A second wedge formation can also be identified by using the downtrend line from the May high as the top boundary of the falling wedge. Together, these breakouts provide early evidence that the corrective decline may be losing control to buyers.
$47.37 Breakout Could Confirm the Shift
Nevertheless, these early bullish signs suggest the completion of the bearish correction and the start of an initial advance. The smaller wedge formation indicates a potential minimum target near the lower swing high of $53.99, which is the top of that formation. The first upside target, however, is the lower swing high at $47.37. There was a recovery of a smaller lower swing high on Tuesday, which confirmed strength, but that the $53.99 high presents a more significant level, as a move above it will provide a more significant signal for a reversal of the declining trend structure. A move through $47.37 would therefore provide an important confirmation that the recent bottom is developing into a more meaningful bullish reversal.
Resistance Builds Toward $53.99
That price area looks like it may soon be joined by the falling 50-day moving average at $49.46. The 50-day moving average represents the next key dynamic resistance zone, which was confirmed as resistance during the advance that established the $53.99 swing high. A sustained move above the 50-day moving average would further strengthen the reversal signal. For the health of the long-term trend, the 200-day moving average would need to be reclaimed. Although at first there might be signs of resistance near the average, the completion of recent corrective price action would suggest that it may be reclaimed. Certainly, if the target from the wedge pattern is to be reached, it will need to be.
Weekly Reversal Adds Bigger-Picture Support
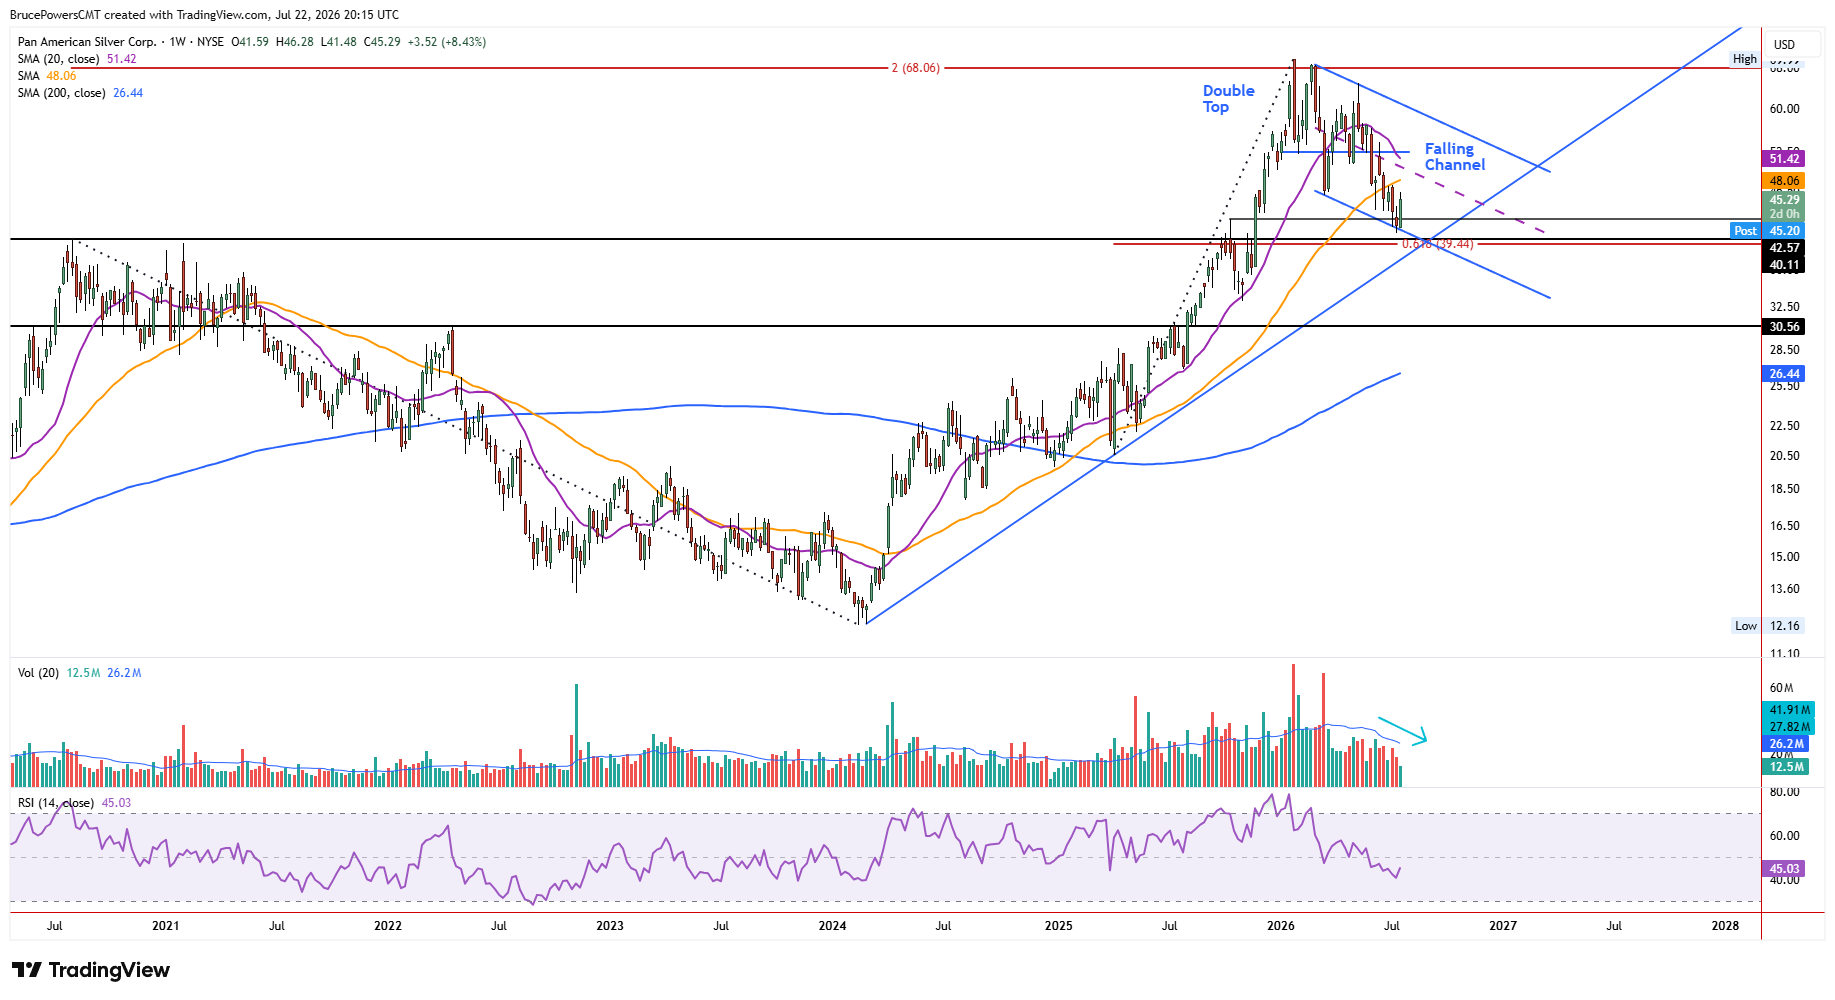
The weekly chart shows a declining trend channel defining the boundaries of the decline that followed the $69.99 peak in January. A one-week upside reversal triggered this week, establishing a higher weekly high and higher low. Moreover, it occurred from the lower channel boundary, suggesting an eventual approach to the upper boundary of the falling channel.
That higher-time-frame reversal reinforces the bullish signals on the daily chart and supports the potential for the recent correction to have ended. If PAAS can continue to reclaim the resistance levels above, the weekly reversal could provide the foundation for a broader advance toward the upper boundary of the declining channel.
If you’d like to know more about technical analysis and how traders use it, please visit our educational area.