


Rising Wedge Breakdown Undermines Bullish Trend
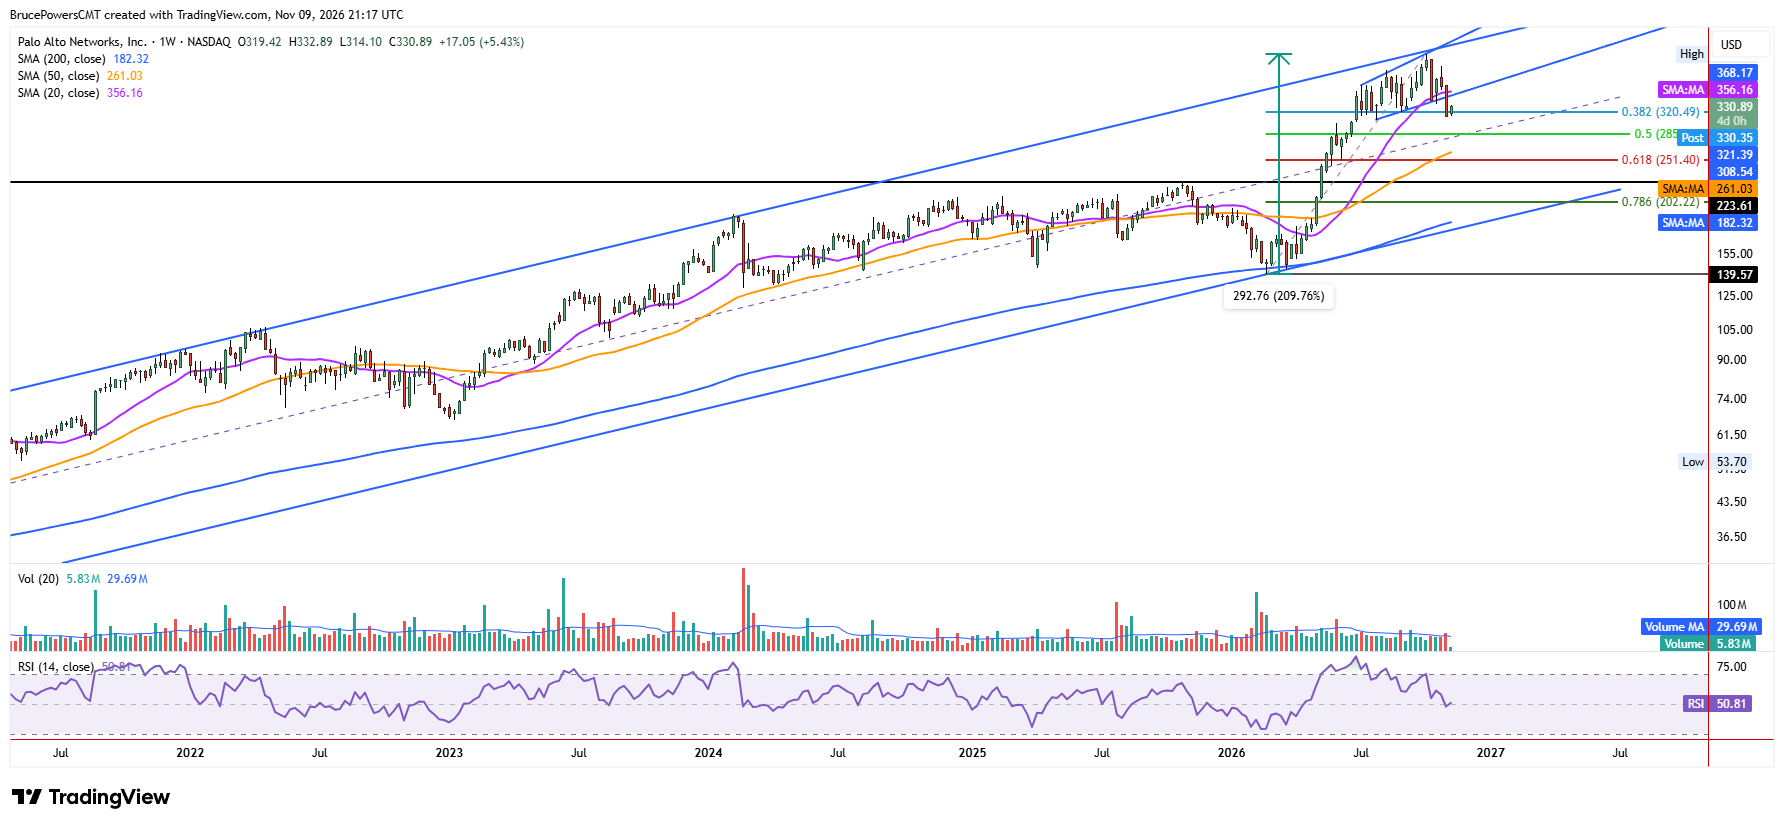
Palo Alto Networks, Inc. (PANW), a leading cybersecurity company, failed to retain its bullish trend last week, as it broke down from an expanding rising wedge consolidation pattern with a decline below the lower swing high at $334.75. Bearish momentum was decisive, with the stock reaching a 13-week low of $312.12 and closing nearby at $313.84. A wide-range bearish candlestick pattern with a full red body was the result.
The decline also led to a weekly close well below the 20-week moving average, further confirming selling strength. During the decline, two recent higher swing lows were broken before initial support was seen near the completion of the 38.2% Fibonacci retracement of the prior advance at $320.49. This breakdown represents a significant deterioration in the technical outlook following an extended advance.
October Peak Raises Risk of Deeper Correction
These bearish signals suggest that a deeper correction may be coming, with the potential for a pullback to test prior support levels as resistance. PANW reached a peak of $432.33 in October, completing a greater than 209% advance from the February low of $139.57. Resistance was seen near the upper boundary of a long-term rising trend channel. Notably, that high was followed by a weekly bearish reversal the following week, accompanies by a sharp decline to the 20-day moving average. The subsequent breakdown now raises the risk that the October peak marked an important corrective turning point.
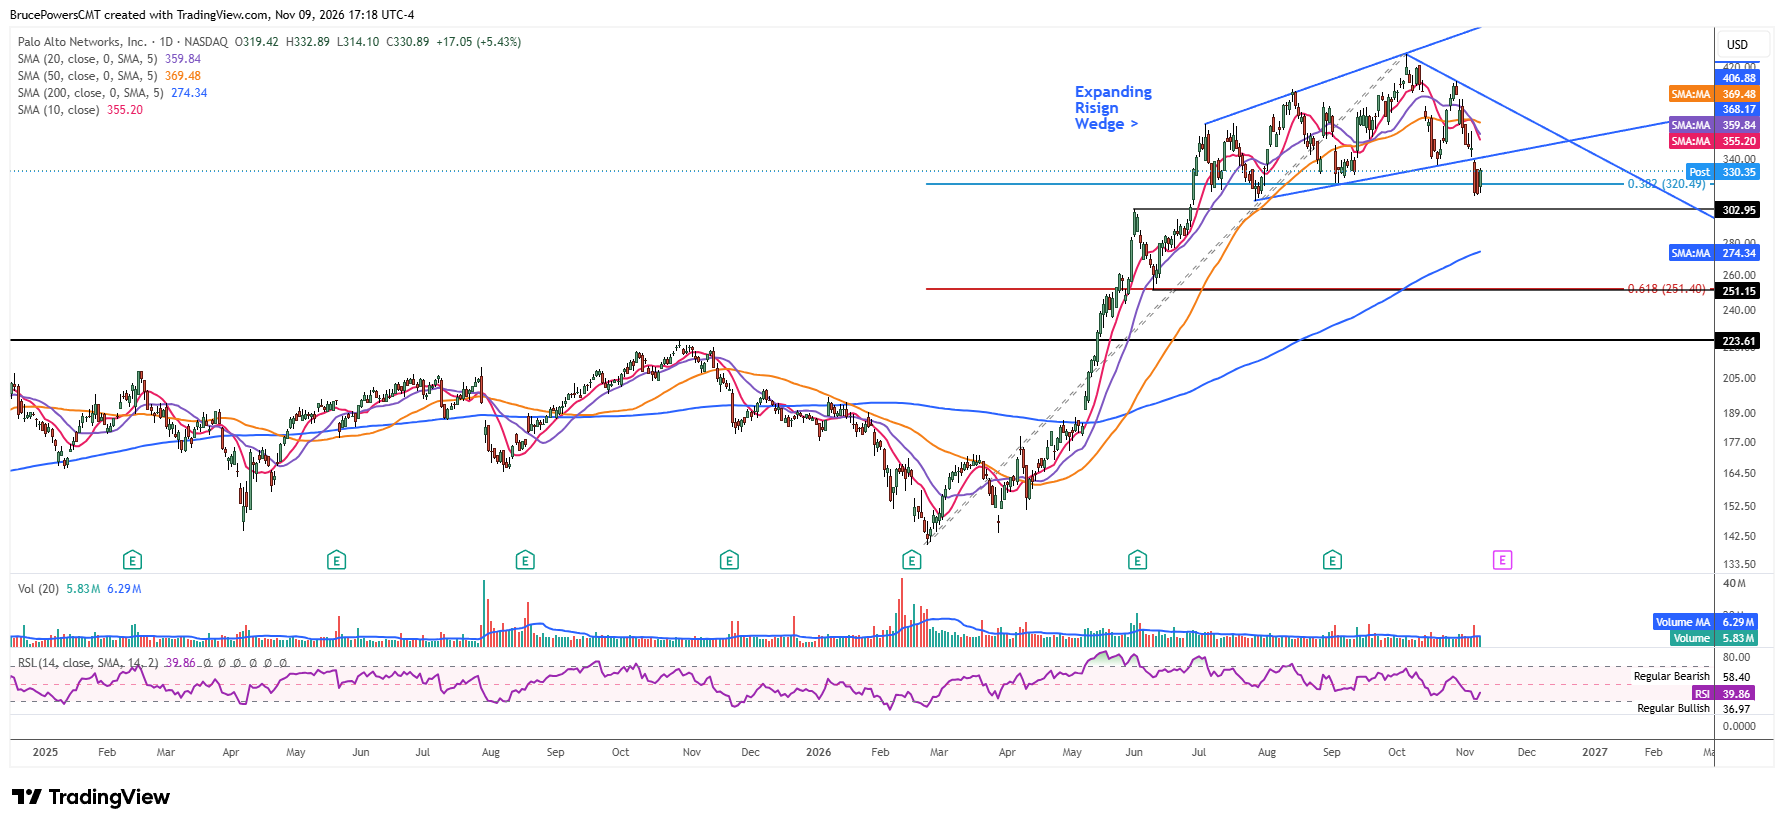
The next lower potential support level is the higher swing low of $308.54. If it breaks, another bearish reversal signal will trigger, thereby increasing the potential for stronger bearish momentum. The rising 200-day moving average near $275 presents an initial key support target, with the next potential support at the higher swing low at $251.15. That level is reinforced by the 61.8% Fibonacci retracement of the prior advance. A decline toward these levels would represent a deeper correction from the October peak.
Short-Term Support Faces Its Next Test
Monday was the third day that tested support near last week’s low of $312.12, emphasizing its significance as short-term support. Although PANW could continue to weaken with a move below that level, there is also a chance for the first pullback after a key breakdown to occur. Potential resistance is near Thursday’s high of $339, which is near the lower boundary of consolidation. Wednesday’s high of $361.91 is a higher target level, but if it is surpassed the bearish potential of last week’s reversal, may be heading towards failure. For now, however, the breakdown, weak weekly close, and loss of multiple swing lows favor sellers, provided near-term support gives way.
If you’d like to know more about technical analysis and how traders use it, please visit our educational area.