


10-Year Yield Technical Analysis
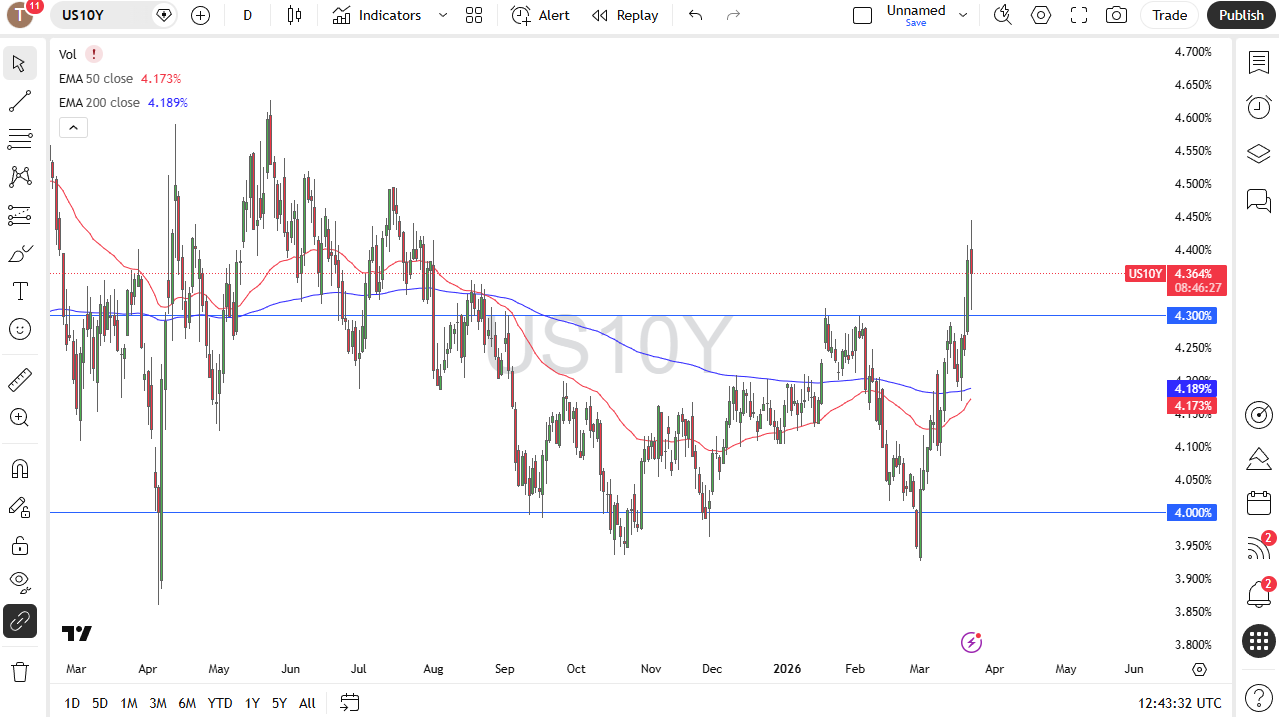
The first thing that I am watching, and this will probably be the case for the rest of the war, actually, I will always have an eye on the 10-year yield. In the United States, it spiked at one point, and then it dropped again, and then it bounced after that. Part of this is due to the headlines coming out of the Trump administration as well as the Iranians.
The Trump administration is suggesting that there could be a deal within the next 5 days with the Iranians. The Iranians claim there are no talks. The Turks have now jumped in and said that they have been passing messages back and forth. This is a moving story, so by the time you see this video, it has probably changed again. This plays chaos and havoc in the bond market as you can see, and it plays havoc with the US dollar.
Keep in mind that the 4.3% level should be supported. If it gets broken to the downside, that means it is probably a major “risk on” type of scenario, which will greatly influence everything else.
USD/ZAR Technical Analysis
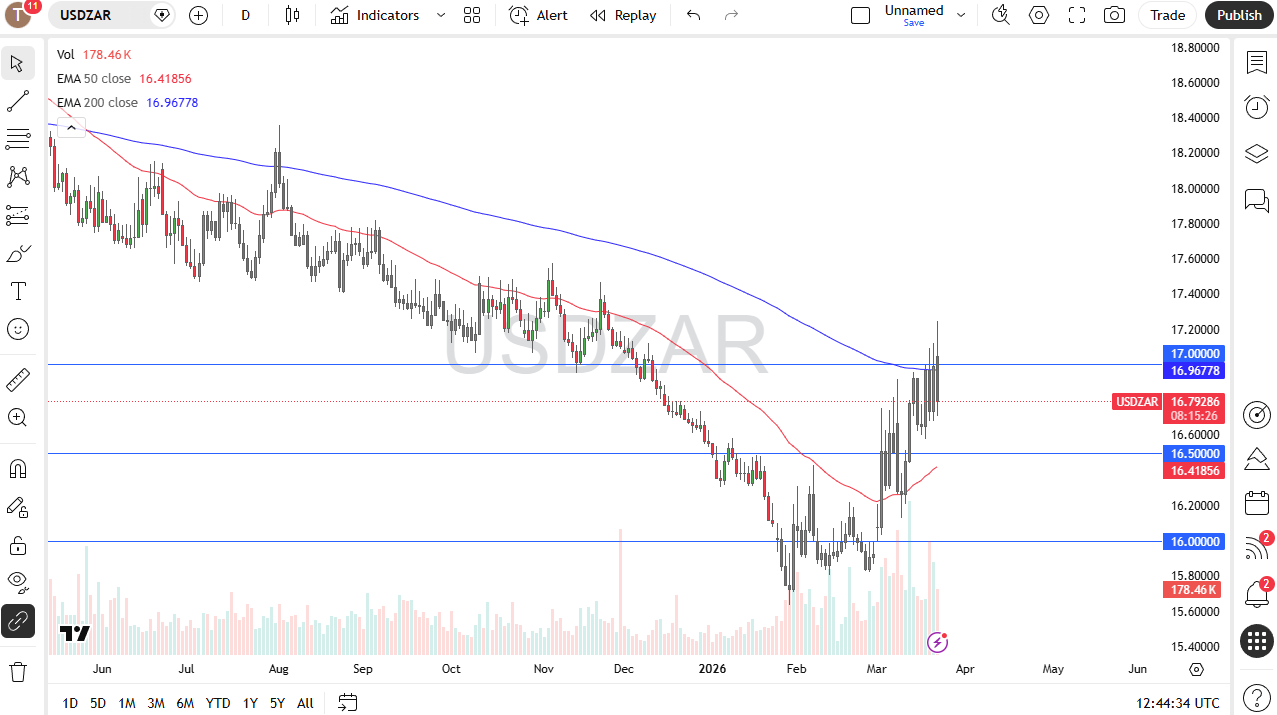
I am also watching the US dollar against the South African rand. We are bumping up against the 200-day EMA, and I am looking to fade short-term rallies that show signs of exhaustion, probably on the hourly chart. I am not looking to swing massive positions here but somewhere around 17 if we get a bounce and show any proclivity to roll over, I would be interested. You can also make an argument that perhaps we could sell off here and go looking at the 16.5 level as well.
Russell 2000 Technical Analysis
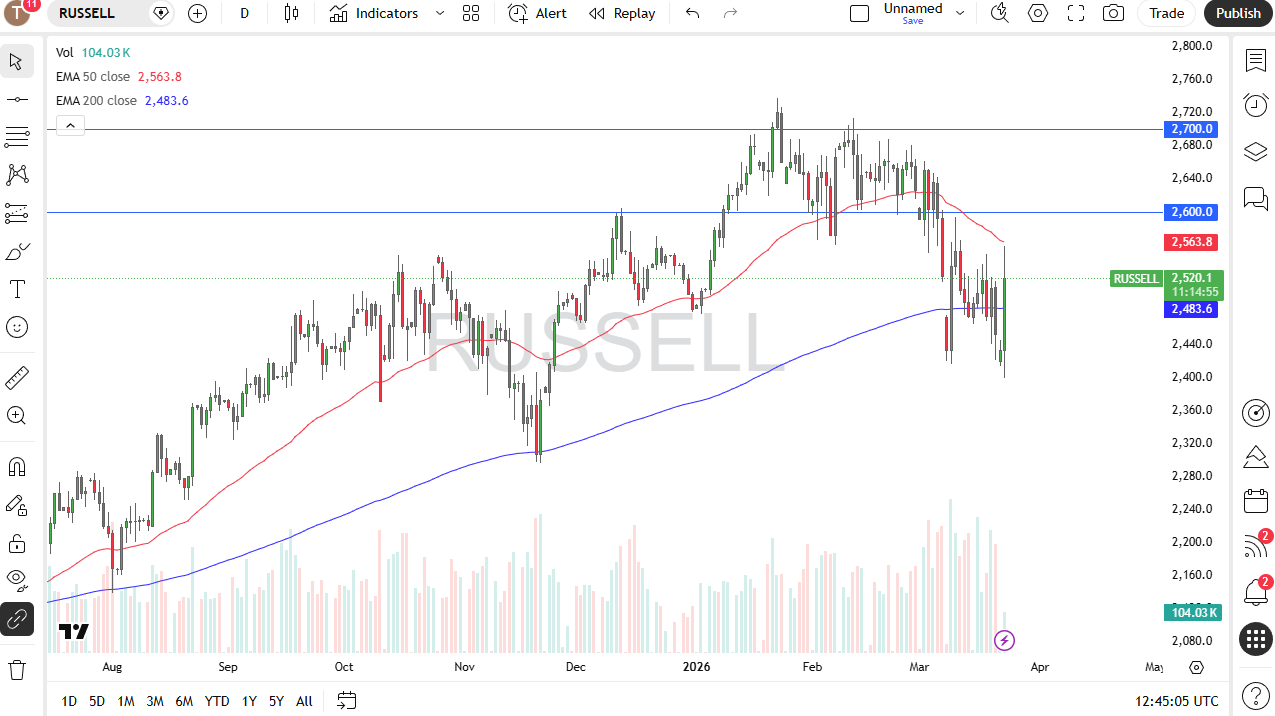
I am also watching Russell 2,000, and it is not to trade the Russell 2,000, it is to give me an idea of what the other indices may do. We were very quiet in the morning heading towards the open and then we got word that supposedly the Americans and the Iranians are speaking, and we got a massive jump of at one point somewhere in the neighborhood of around 5% suddenly.
We have backed off of that and now I need to see whether or not we are going to be able to clear this 50-day EMA. If we do, then I suspect that the Nasdaq 100 and the S&P 500 take off to the upside. The biggest problem we have here is that the next headline could be the Iranians saying there is no chance of a deal and the market turns around and collapses. Keep your position size reasonable.
BTC/USD Technical Analysis
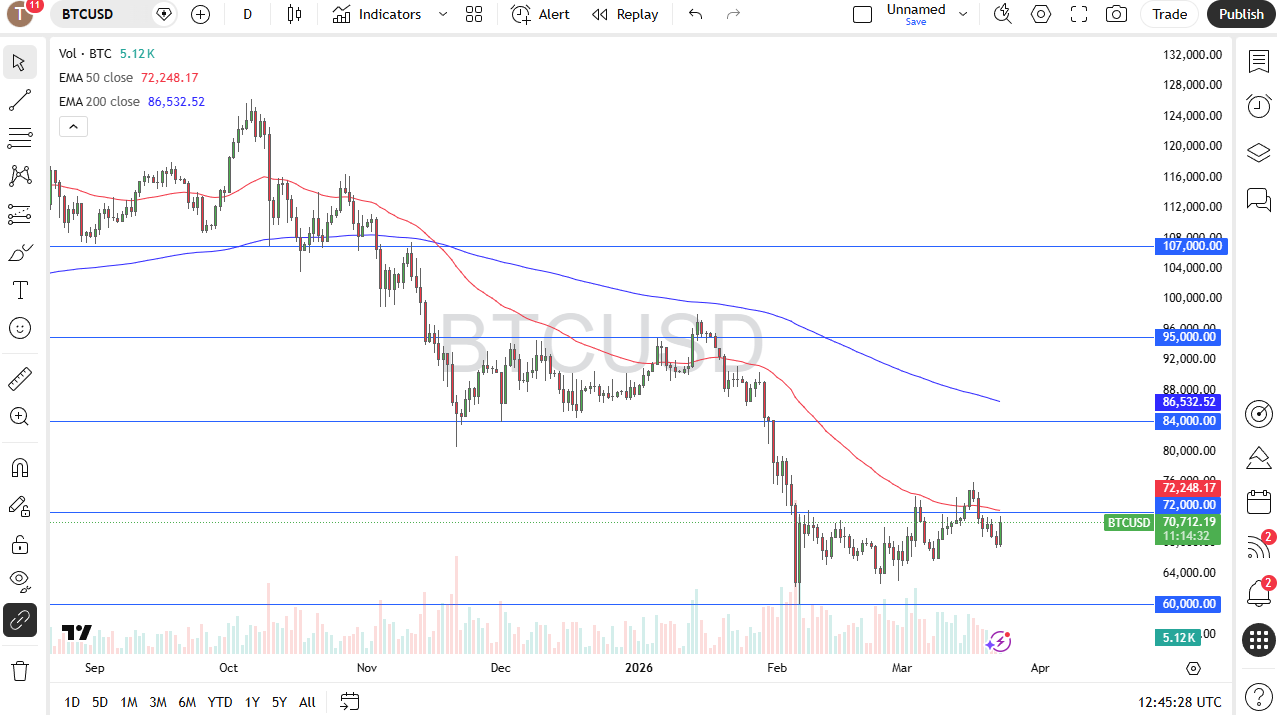
The final chart I am watching is Bitcoin. Bitcoin continues to threaten $72,000. If it can break above there, I believe that after about an hour or so above that level, I am going to start buying. Bitcoin is beaten down. I don’t even believe in Bitcoin, but I recognize a technical bounce setting up when I see it.