
HOME
PREMIUM
US and Japanese flags and money.

10 YR Yield, USD/JPY, RUSSELL 2000 and FTSE 100 Forecasts – Fear Continues to Grip the Markets

By
Christopher Lewis

With rates climbing yet again, risk appetite is being destroyed.

US 10-Year Yield Technical Analysis
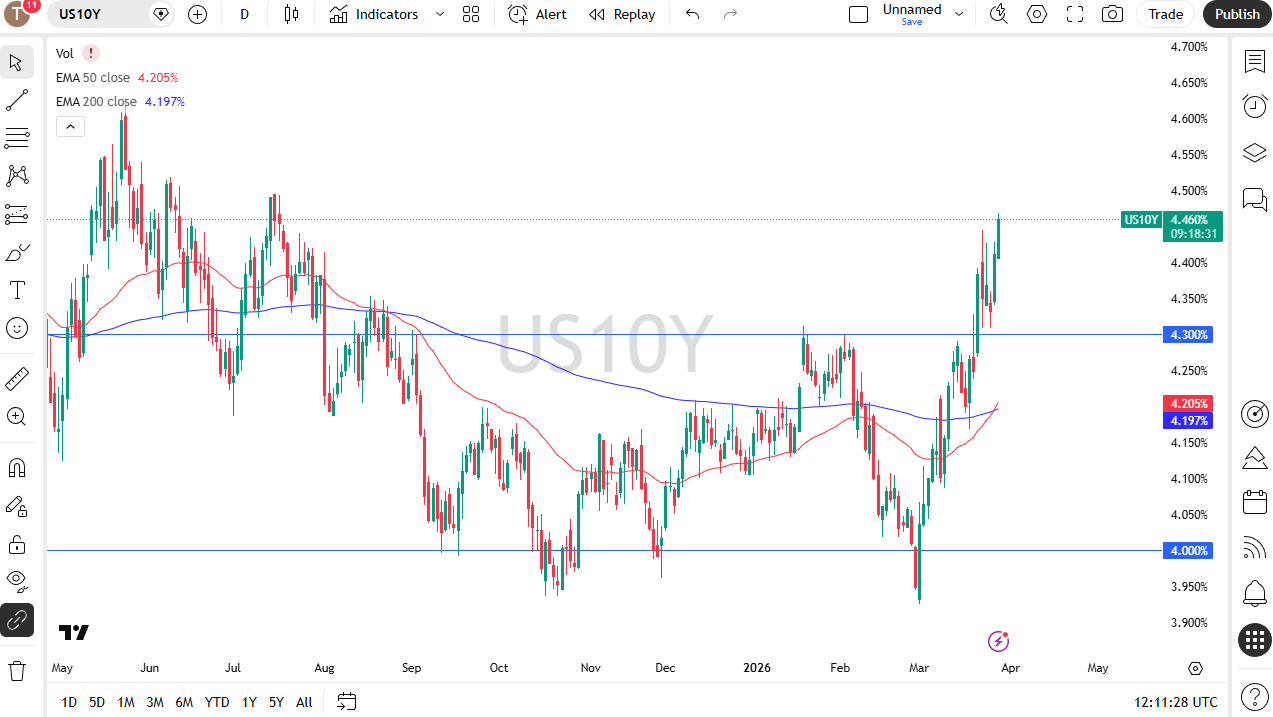
US 10YR Yield daily candlestick chart. Source: TradingView

So, if you’ve been watching over the last week and a half or so, I’ve brought up the 10-year yield chart almost every day. Today won’t be any different. We’re at 4.46% and rates are screaming higher, and this is going to have a very negative effect on risk appetite.