



Copper (XCU) prices remain under short term pressure as slower growth in China raises concerns about demand. But the stronger industrial production, lower exchange inventories and possible supply disruptions continue to support the market. Copper may test the key support area before the next major rally begins, while the long term outlook remains positive. This article examines the mixed economic data of China, tightening supply, inflation risks and the price levels that can determine the next move in copper prices.
China’s Slowdown Raises Copper Demand Concerns
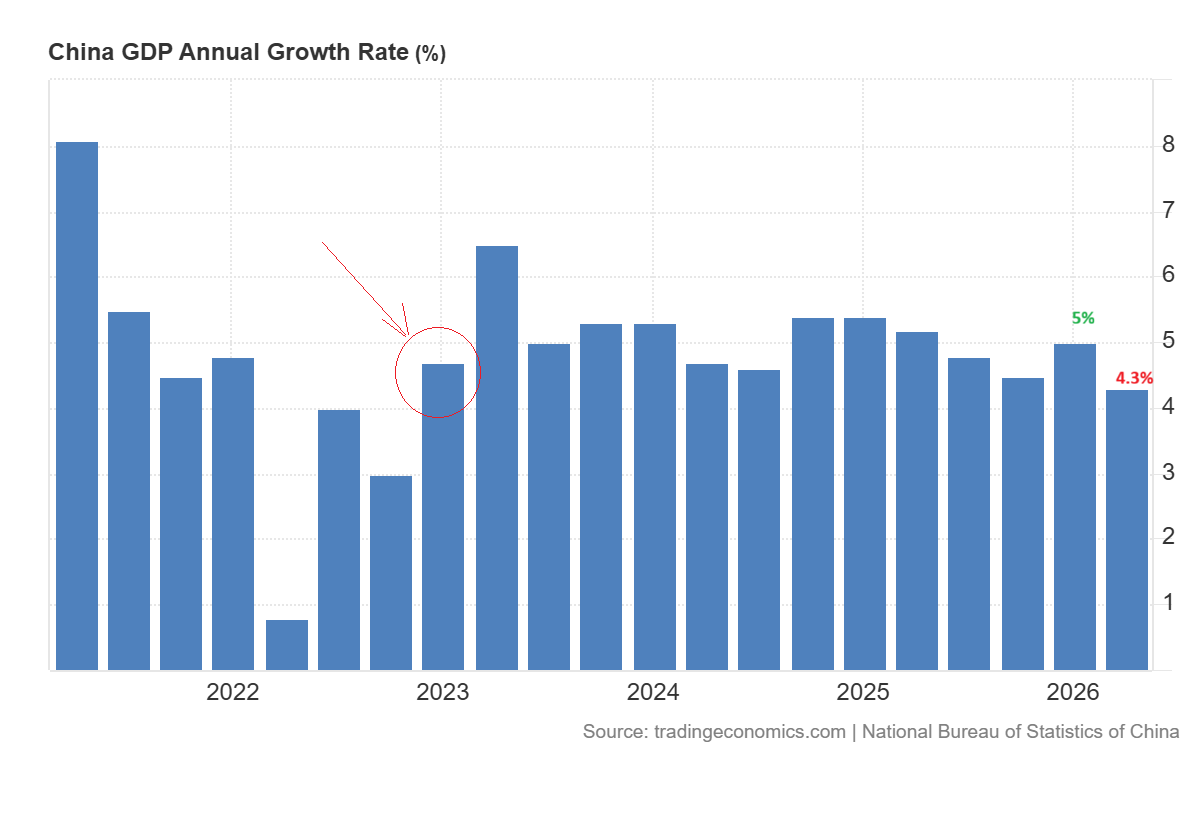
China’s economy sends mixed signals this week. The chart below shows that the annual GDP of China decelerated to 4.3% in Q2 2026 as compared to the 5% in Q1 2026. This was less than the market estimate of 4.5% and it was the lowest increase since the end of 2022.
Most of this slowdown was due to weak domestic demand and declining investment. The property sector was a major drag as the property investment dropped significantly. The chart below shows that the property investment dropped to 18% YoY in first half of 2026 due to the weak housing demand, tighter financial conditions and debt burdens among developers.
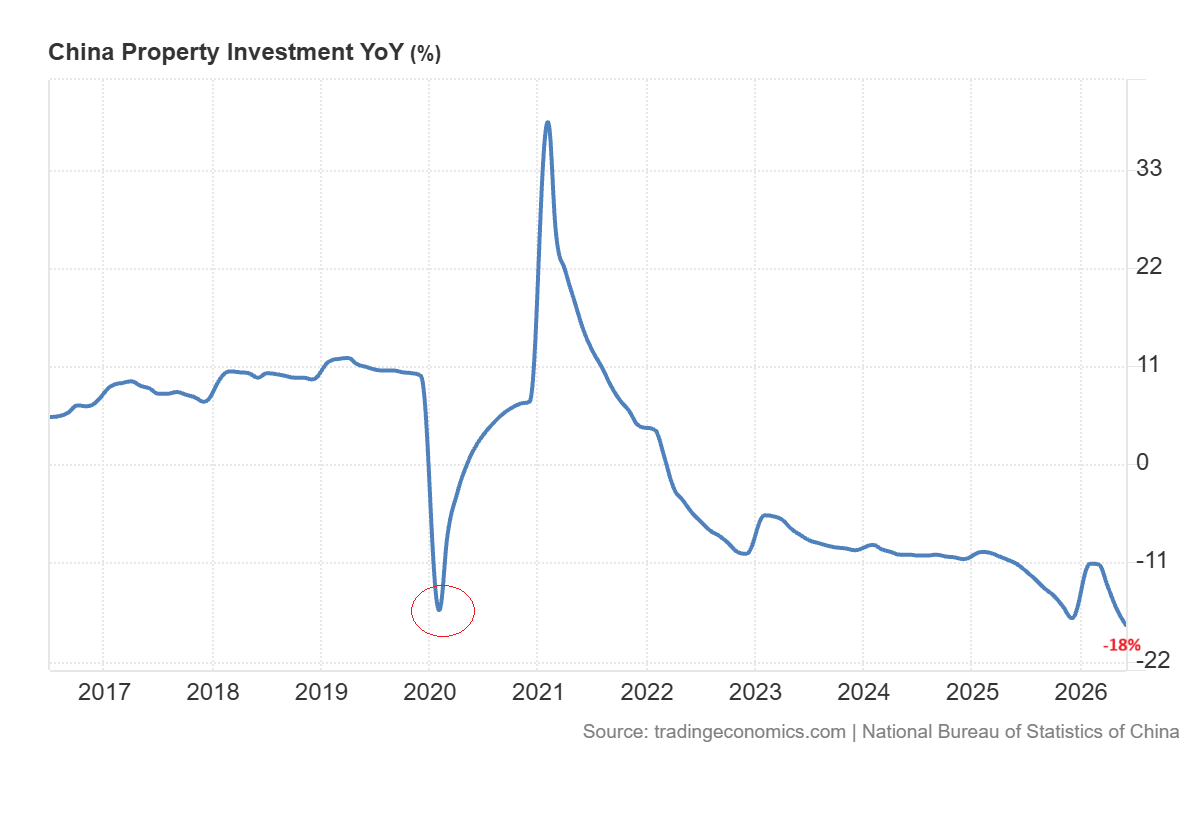
This creates a short term risk on copper as construction continues to be a significant demand driver.
However, the industrial data were more positive. The industrial output of China rose by 5.3% in June. This was the strongest growth in industrial production since March.
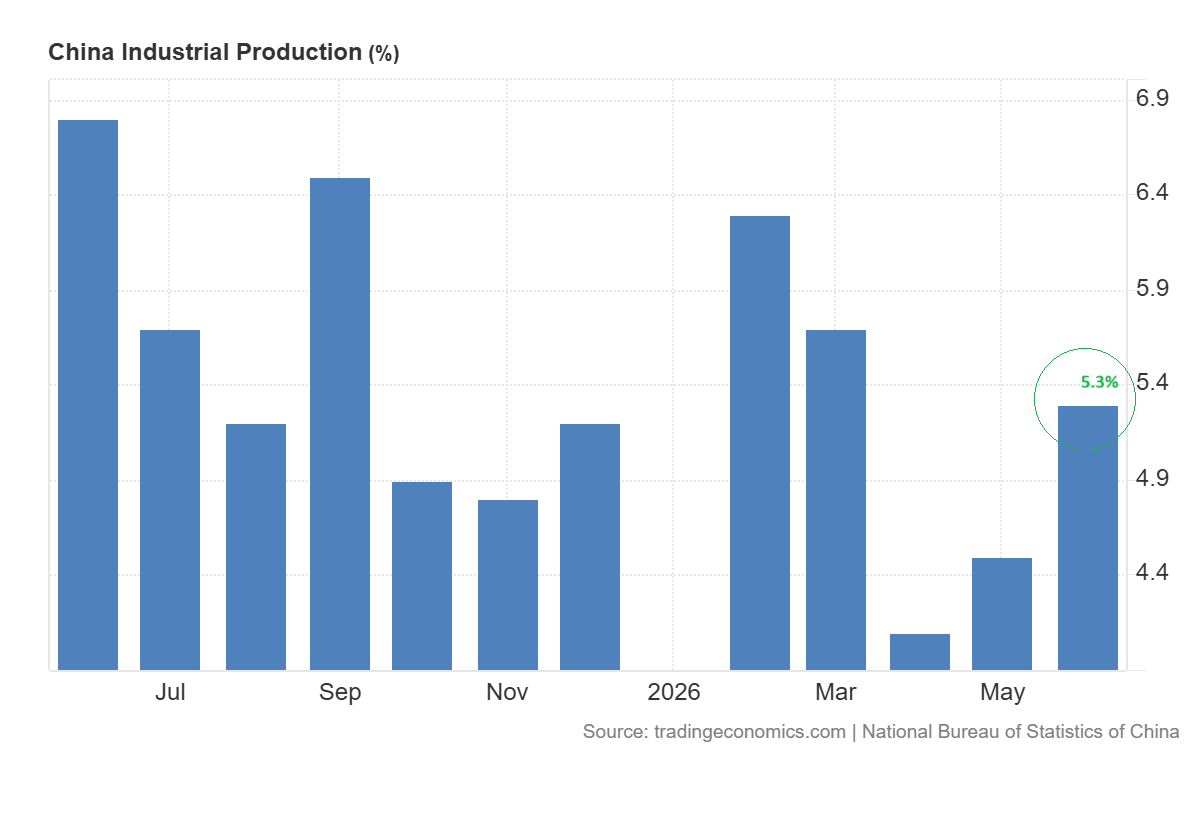
This output was supported by the strong manufacturing production which increased to 6% in June. This growth indicates strong demand from factories, electrical equipment and technology-related industries.
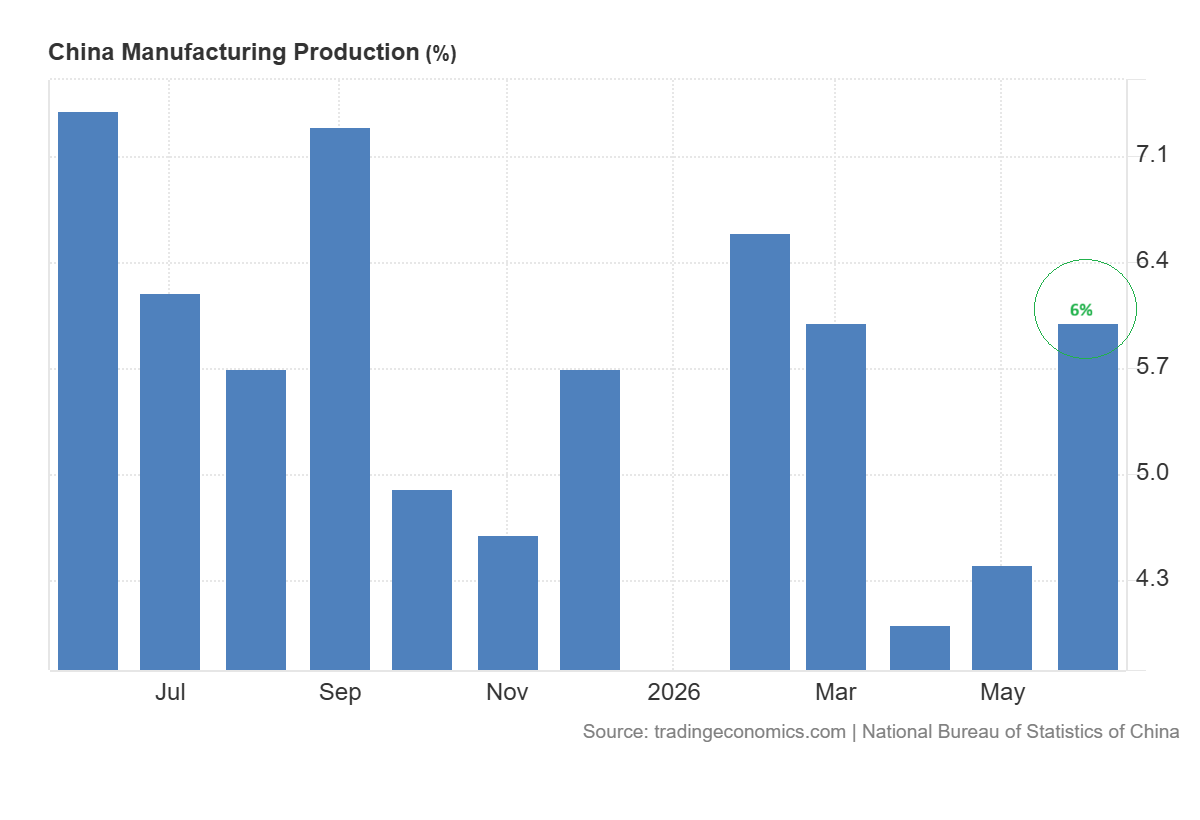
Strong exports and high-tech production also make a contribution to offsetting the weakness in property. This data suggests that the copper demand has not fallen as quickly as the GDP data suggests.
The expectations of further support from Beijing may also keep the downside potential limited. The weak growth data have put policymakers under pressure to boost consumption and investment. But it could be targeted measures rather than a massive stimulus package. This means that copper may get a gradual support from the infrastructure, manufacturing and energy initiatives.
Copper Price Forecast
Every new Copper analysis as it publishes, today's technical signal and key levels, live price — on one page.
See all Copper forecastsCopper Supply Risks and Fed Outlook Support Prices
The supply side remains supportive. The copper production for the quarter was 491,900 tonnes as per the BHP’s report. The company also expected that the production may be impacted by the operating issues at Carrapateena and lower ore grades at Escondido.
LME copper inventories fell from 303,525 tonnes on July 14 to 300,600 tonnes on July 16. This indicates that there is slightly less copper sitting in LME warehouses. The drop in inventories and lower output can support prices even when the demand from China is uneven.
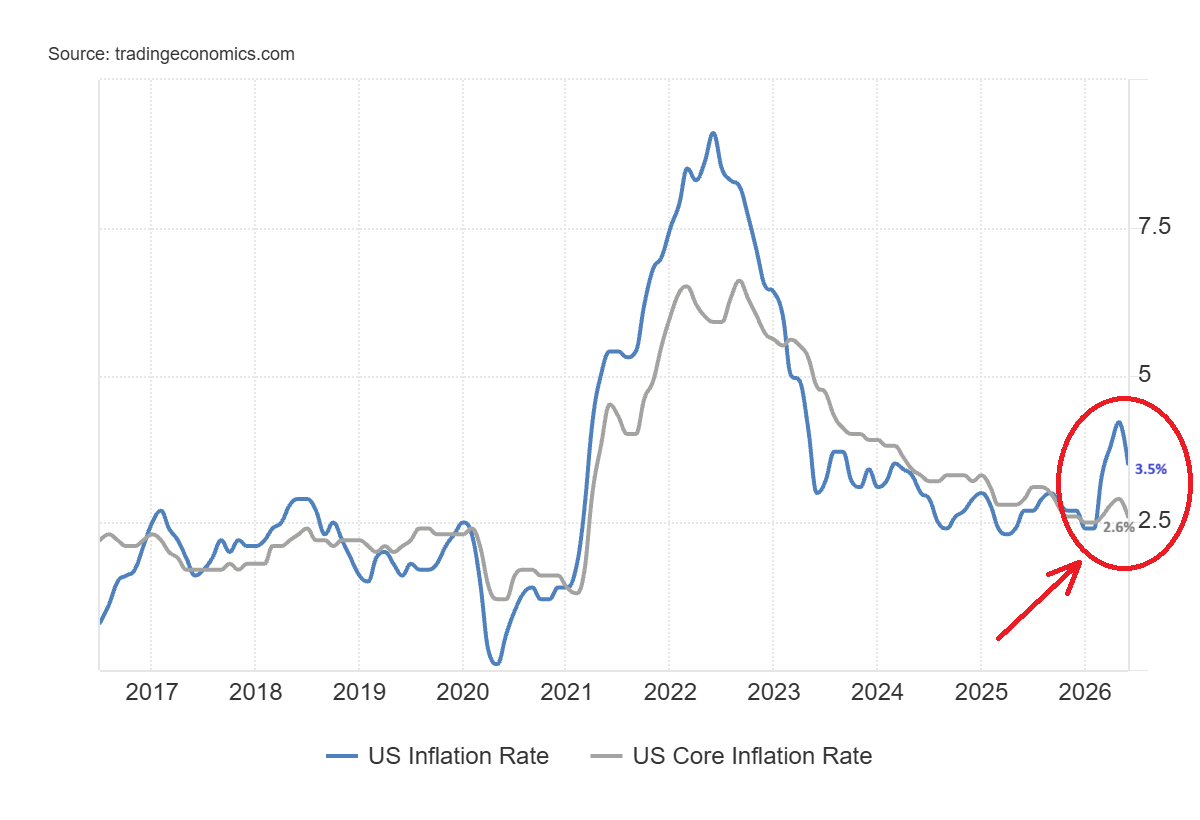
The US macro outlook also provides support to the market. The headline and core CPI dropped lower in June as seen in the chart below.
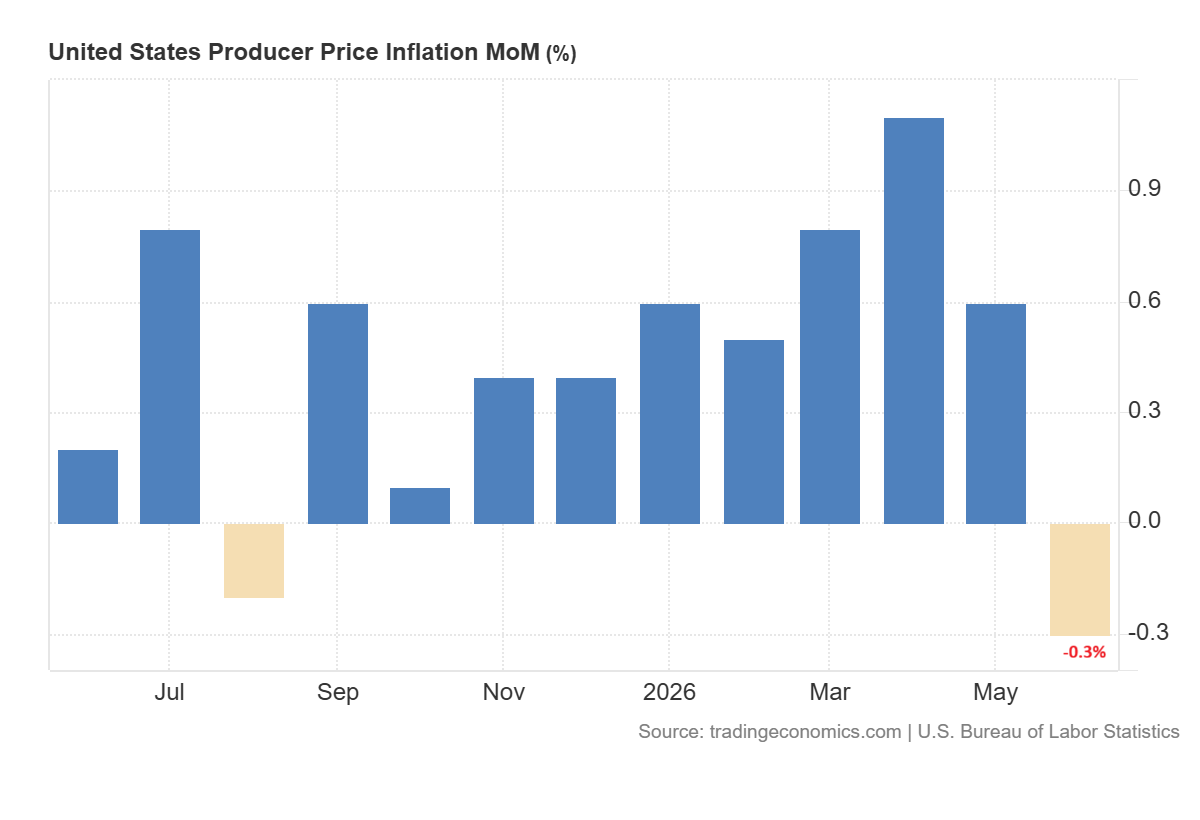
The producer prices also dropped by 0.3% in June. The softer inflation data reduced hopes that the Federal Reserve would hike the interest rates during the upcoming meeting.
This data resulted in a drop in the US dollar index. But the higher oil prices and the escalation in the Middle East increase the prospect of higher inflation in the future. These expectations may force the Fed to raise interest rates in September. This means that the copper prices may remain volatile as the market absorbs the movements in the US dollar with the escalating geopolitical and inflation risk.
Copper Price Tests Key Support Before the Next Rally
The long term outlook for copper prices remains strongly bullish, but prices are currently trading at extreme levels. The chart below shows that copper prices marked a high in Q1 2026 at $6.73. After forming a high, prices are now consolidating at an elevated level.
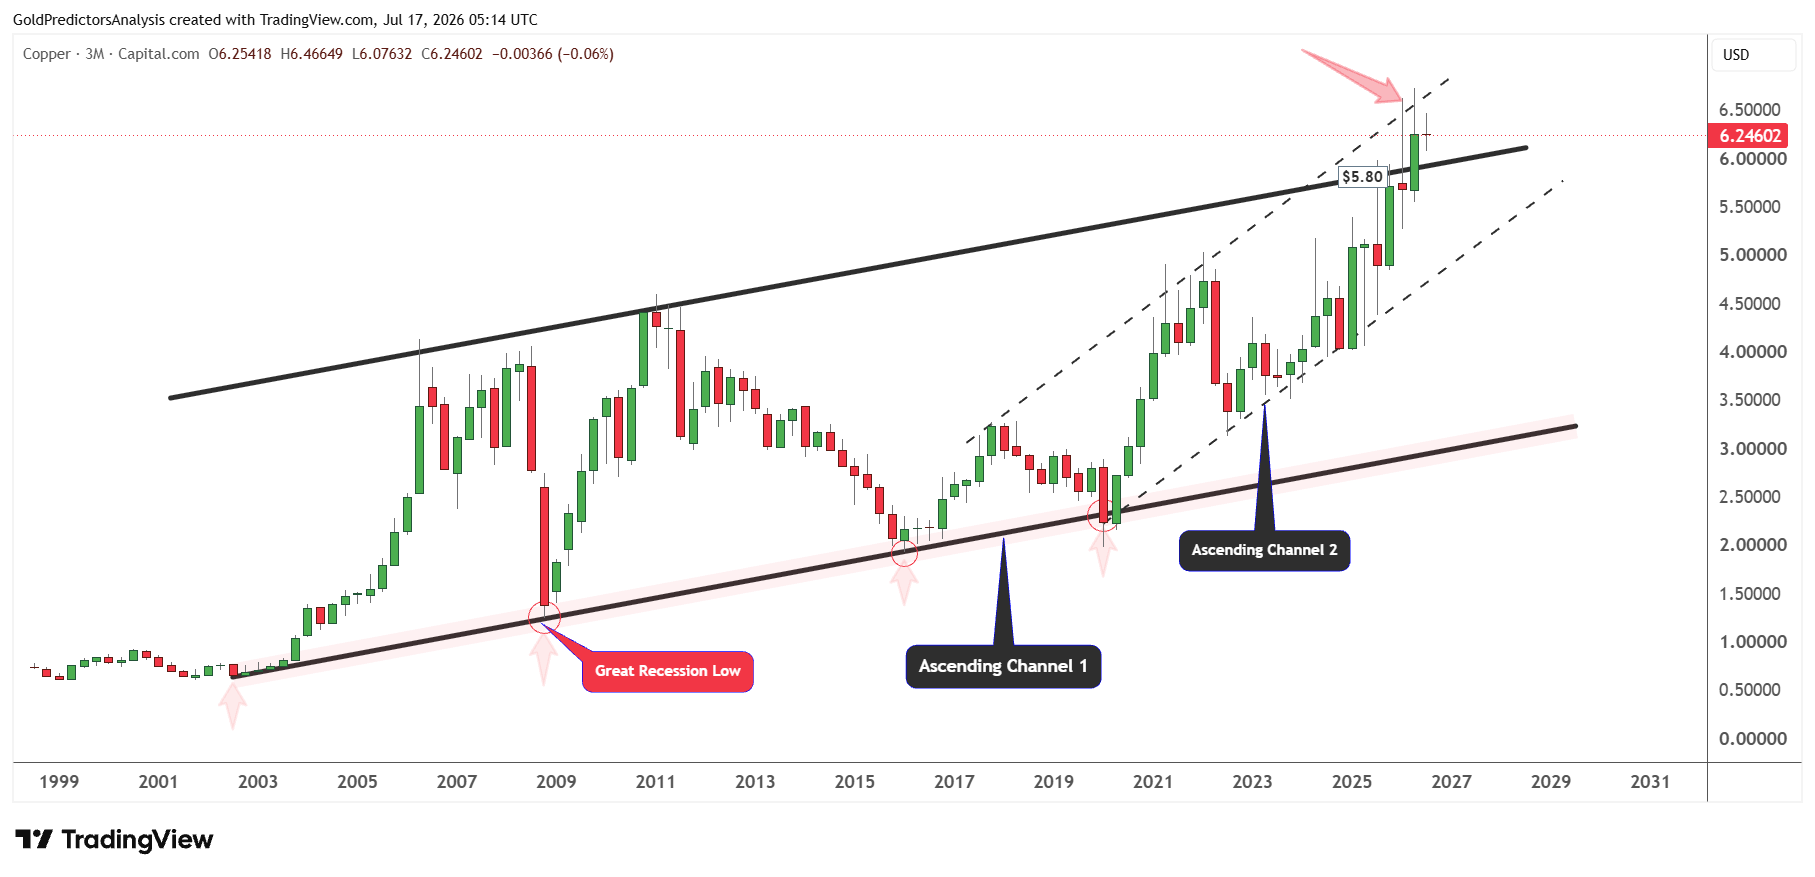
However, the long-term outlook shows that copper prices have consolidated and traded within an ascending channel pattern since the lows formed in 2002. Q1 2026 was the first quarterly close above the channel resistance at $5.80. This positive behavior indicates that copper prices may continue to rally in the next few months.
But the resistance in copper prices at $6.73 is also highlighted by another ascending channel that stretches from the 2020 lows. This indicates that there is a possibility for a drop toward the $5 area in the short term. However, this correction will likely form a bottom, and copper prices will continue to move higher once this correction is over.
The weekly chart for copper prices shows the ascending channel pattern more clearly. This channel stretches from the 2020 lows. It is observed that prices are showing extreme volatility and continue to trade in expensive zone above $6. If prices correct lower and break $5.80, they will likely enter deep correction and push back toward $5. This is considered a strong support area for copper prices.
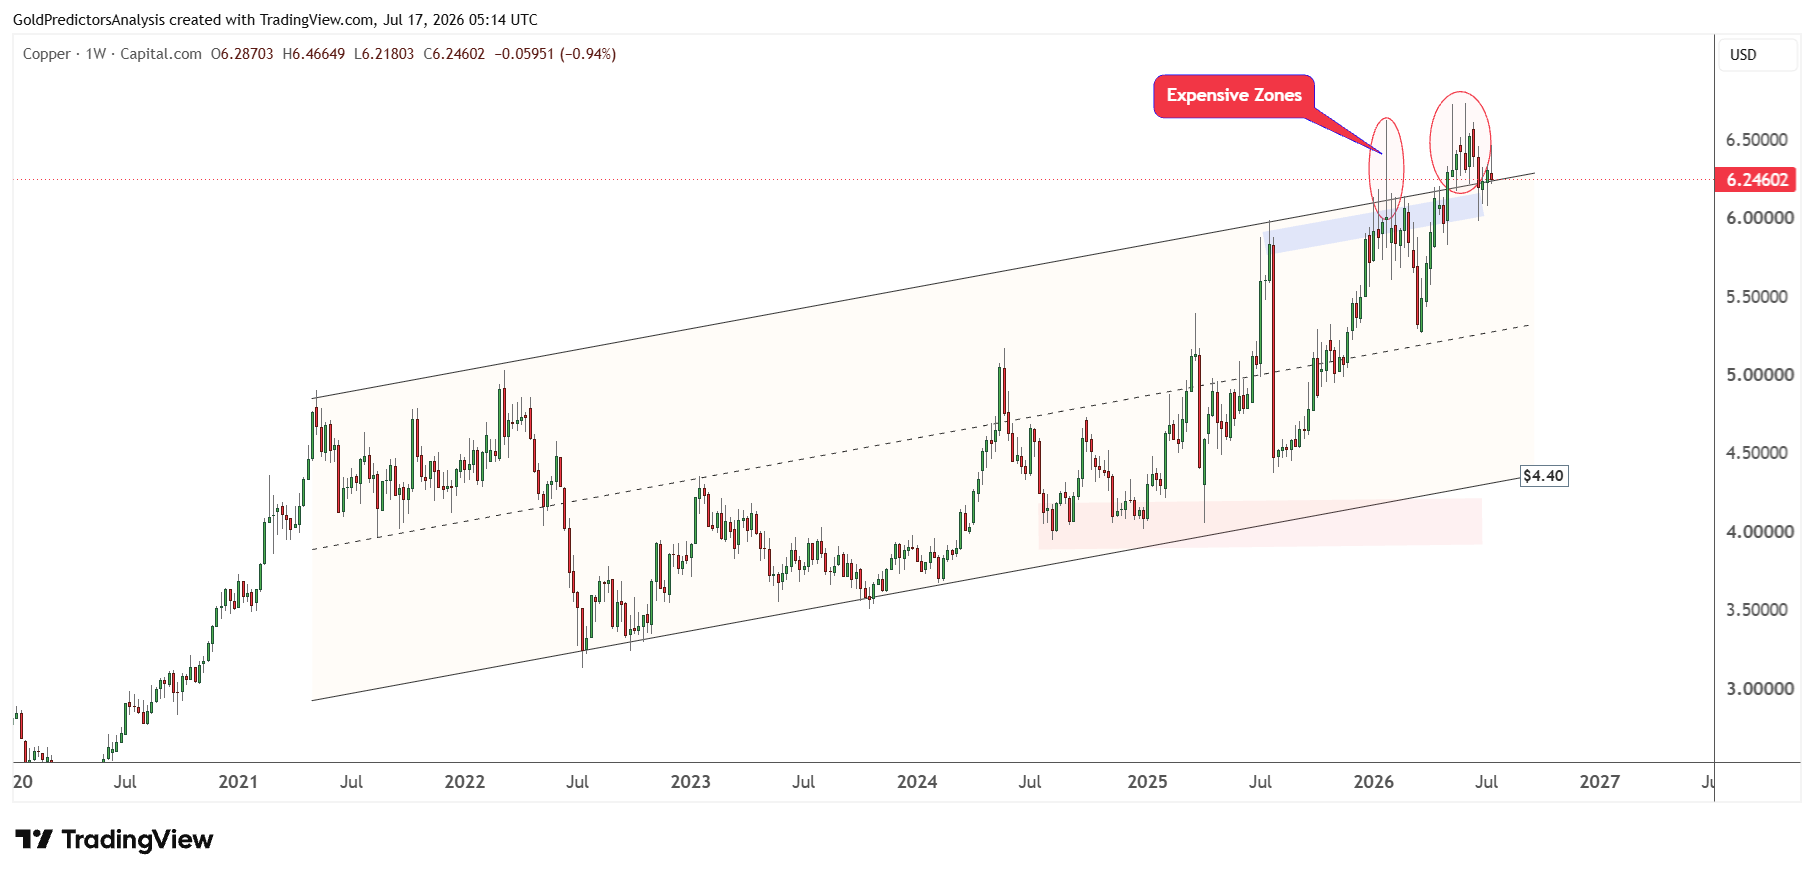
If prices force a deeper correction in copper, then the $4.40 level remains the key support. This support is defined by the ascending channel pattern.
Short-Term Copper Correction Targets Major Support
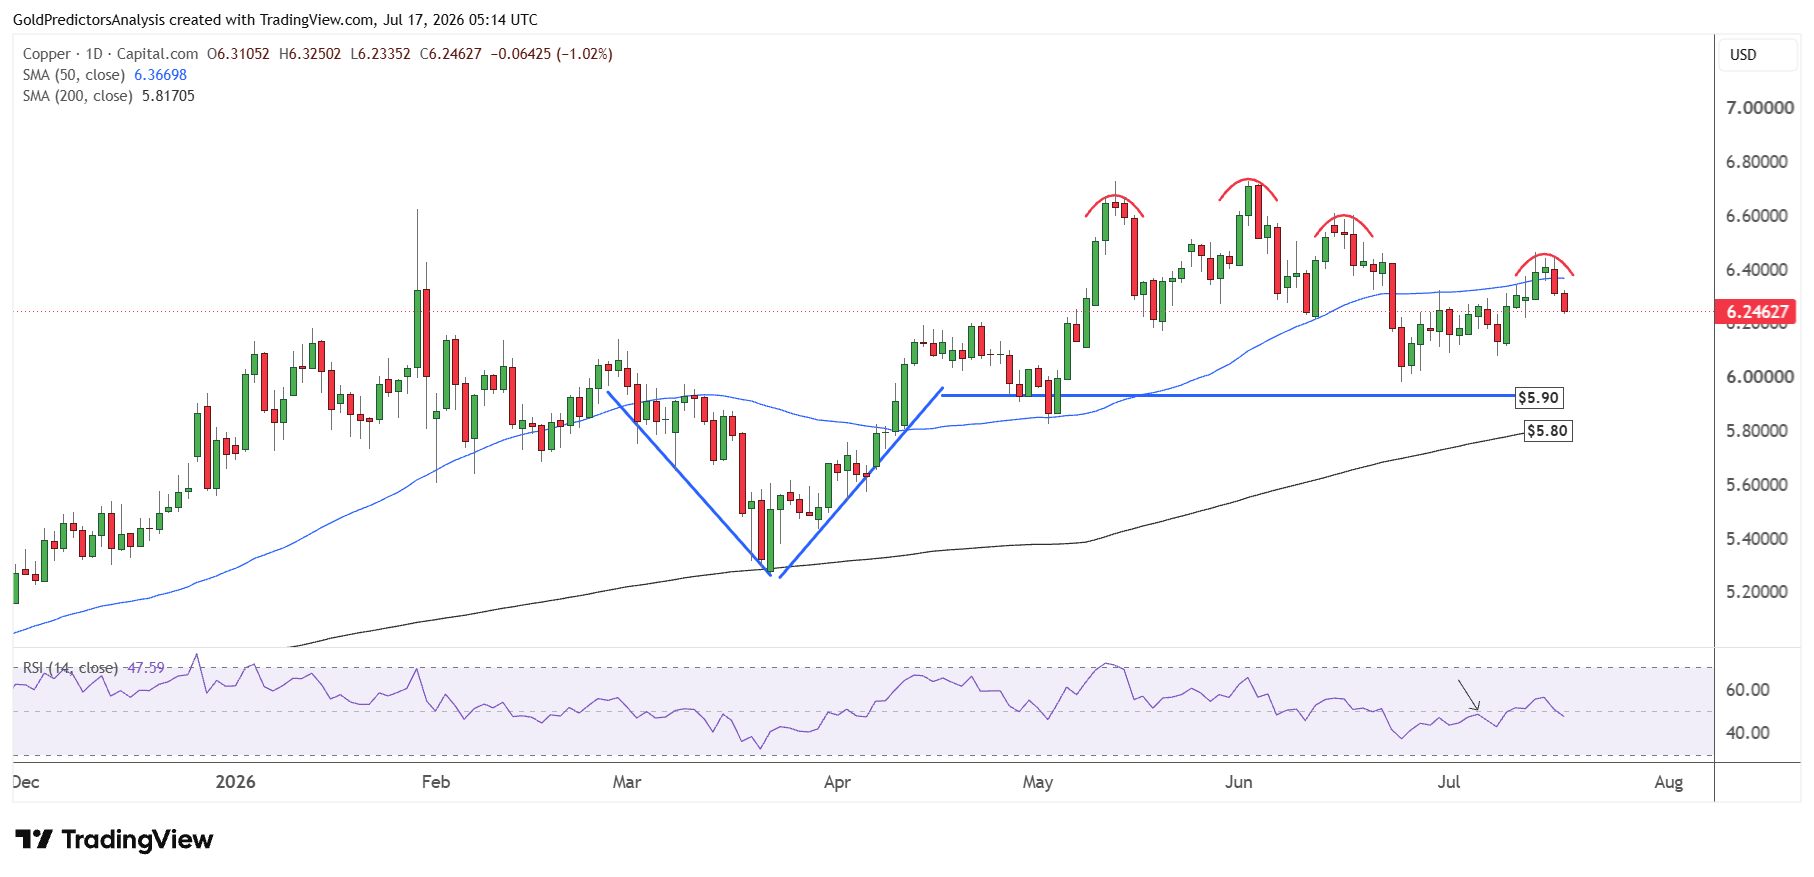
The short term outlook for copper prices points to negative price action after the peak formed in May 2026. The price marked multiple rallies around $6.70. Each rally was rejected which indicates that prices are now attempting to move lower. The immediate support remains at $5.90 and $5.80. The copper price failed to break above the 50-day SMA and is now moving toward the 200-day SMA at $5.80.
The RSI is also moving below the mid-level as oil prices continue to rally and fears of energy supply shortages in Middle East grow. This indicates that inflation fears may return and may push the US dollar higher while US Treasury yields may remain elevated. This will likely keep interest rates higher and push copper prices toward the key support zone before the next rally.
Copper-to-Silver Ratio Signals Further Market Weakness
Despite the strength in the copper market, the copper to silver ratio is now breaking the key level of 0.107 due to extreme weakness in the silver market. The silver price is now approaching the key support zone of $50 after breaking $55. This has pushed the ratio higher and indicates that copper is outperforming silver in the short term since the January 2026 lows.
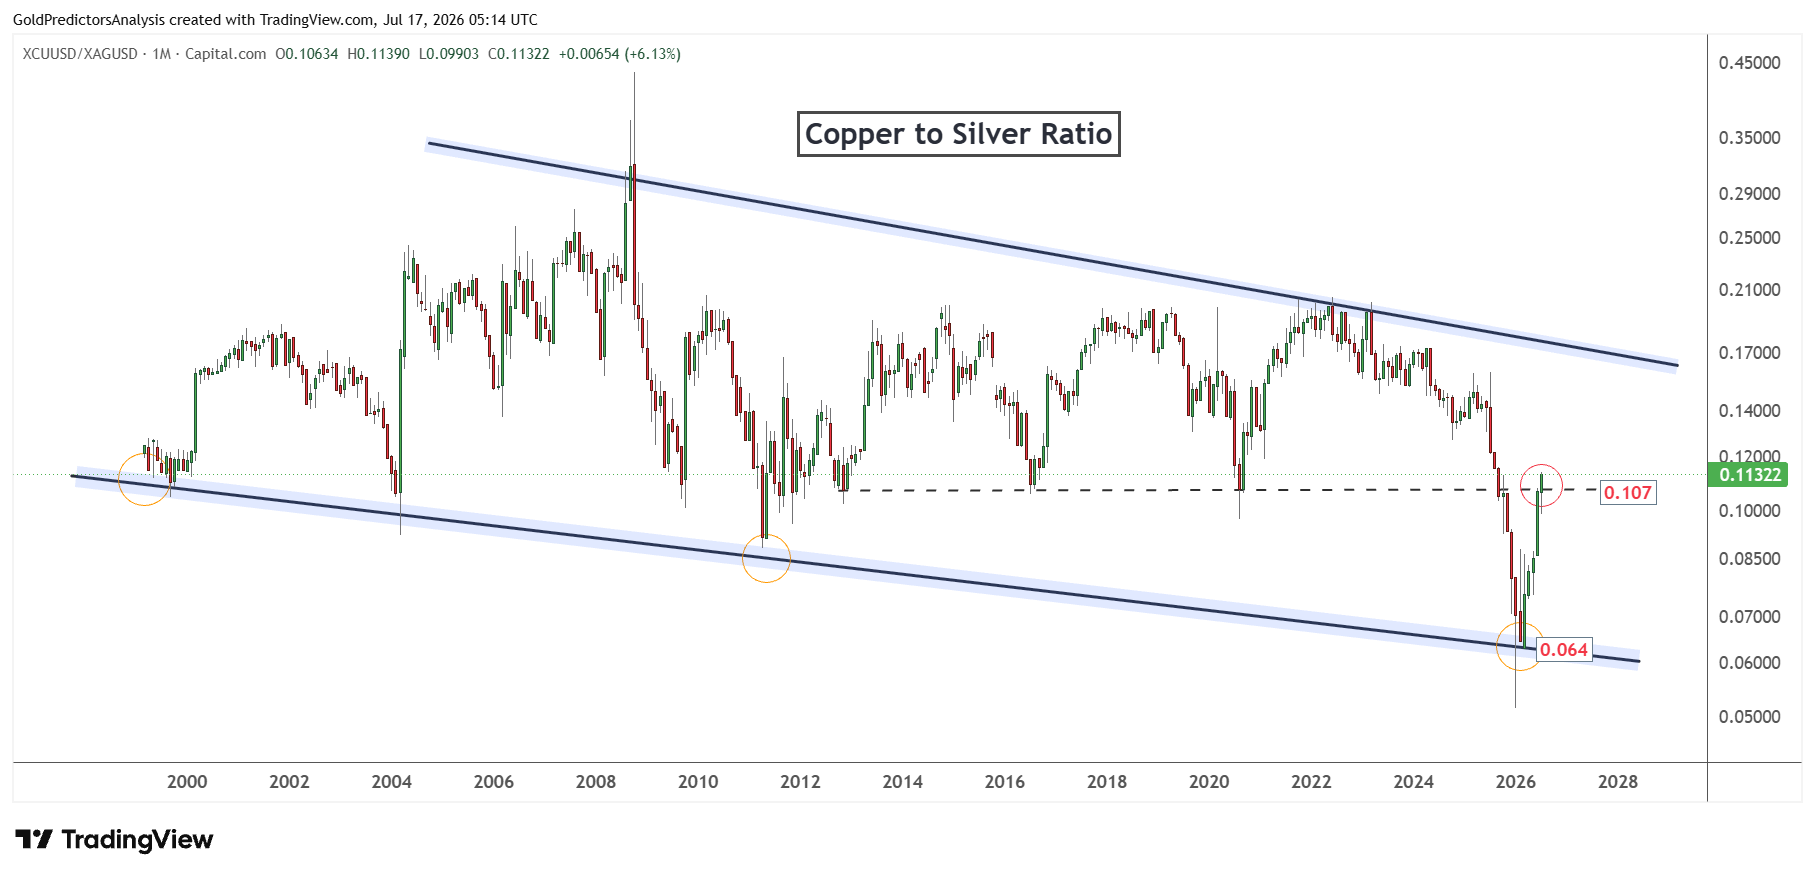
If the copper to silver ratio closes back below 0.107 in July 2026, it will likely indicate that silver (XAG) prices are attempting to form bottom around the current level. But if the ratio breaks and closes above 0.107 in July, it will likely signal more pain for silver and copper in August.
But this correction in copper and silver prices will likely find support and initiate a strong surge in the next cycle.
Bottom Line
Copper prices may face more weakness in the short term as the market reacts to slower growth in China, higher oil prices and renewed inflation risks. The $5.90 to $5.80 area remains first key support zone. A break below this region may push prices toward $5. But the lower inventories, supply concerns and strong industrial activity in China may limit the downside in copper prices.
The long term outlook remains positive as copper continues to trade within its broader rising structure. A deeper correction may create a stronger base for the next rally. The $4.40 level remains the main long-term support while a recovery above $6.70 would improve the bullish outlook. The next major move will depend on the policy response of China, the US dollar and the direction of global inflation.
Read more: Copper, Uranium and Lithium Test Support as Silver Nears Buy Zone