



In the last few months, the Nasdaq 100 has been battered by one woe after another. The AI supercycle criticisms that have made the giants that lead the index stumble over the last few months. The U.S.-Iran War sealed the deal, and until there is good news about the Strait of Hormuz, tech stocks are likely to stay depressed. The question becomes at what levels could we move to with good or bad news, and how to navigate this clear break in the bullish trend. The index is fighting for a key technical level that I am watching closely, as often these levels give the tell before the macro news hits the headlines. By then, the trade will already be played out.
Nasdaq 100 Technical Outlook: Bulls Fight For the 200-EMA
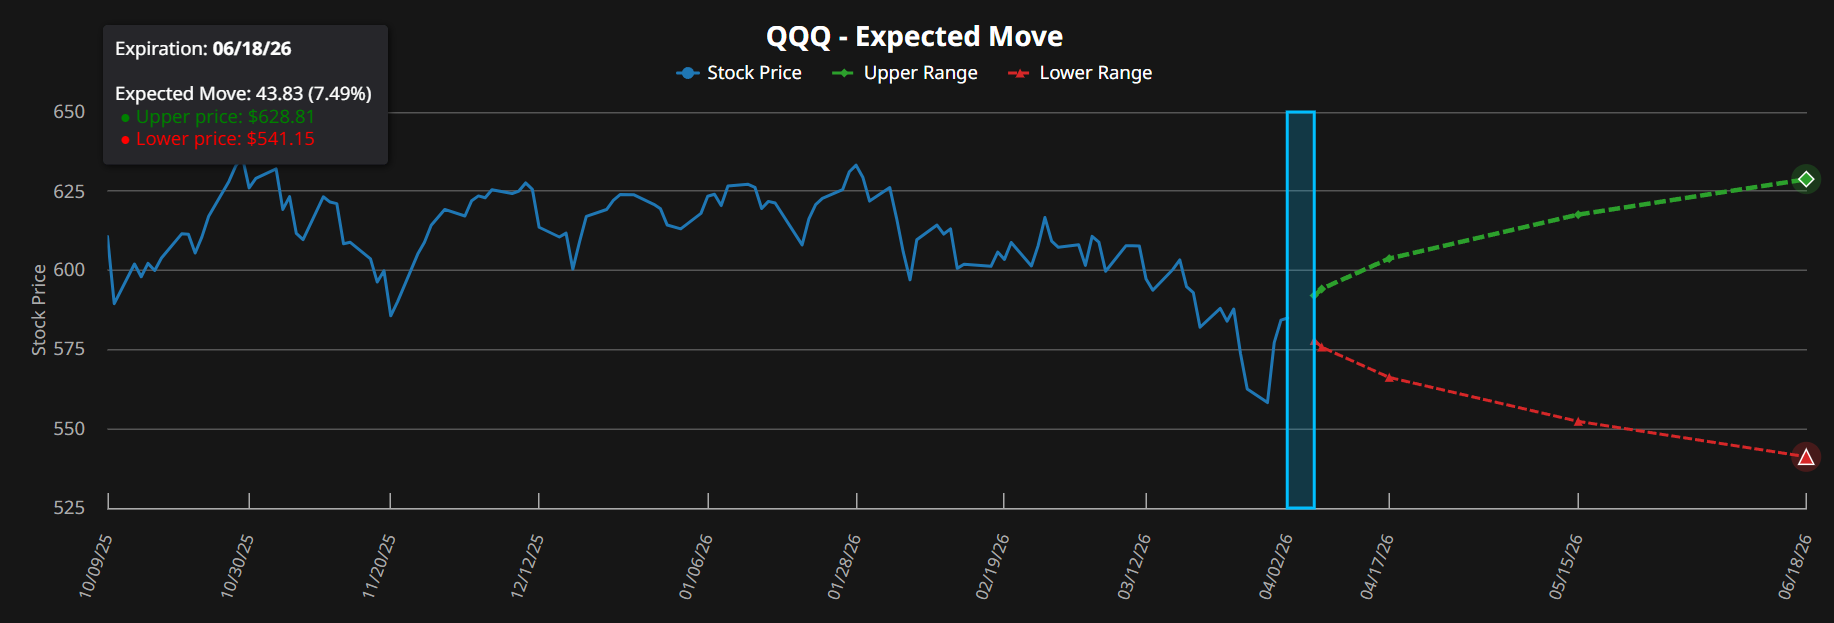
I’m of the mindset that technicals rule the show until macro relents. While the fog of war is still shrouding markets, algorithms are leading many of the moves. News of normalization between the U.S. and Iran will move the markets firmly from their current levels; I wrote about this recently, and the sentiments about volatility being structurally higher for the moment should be headed here as well. The options market is pricing in a significant move for the Nasdaq 100 in the next two months, with a range wider than what is normal.
With that said, here is the 1-year chart for the most popularly traded Nasdaq 100 ETF, the Invesco QQQ Trust Series 1 (QQQ), using daily candles. The VWAP is anchored to the low in September 2022.
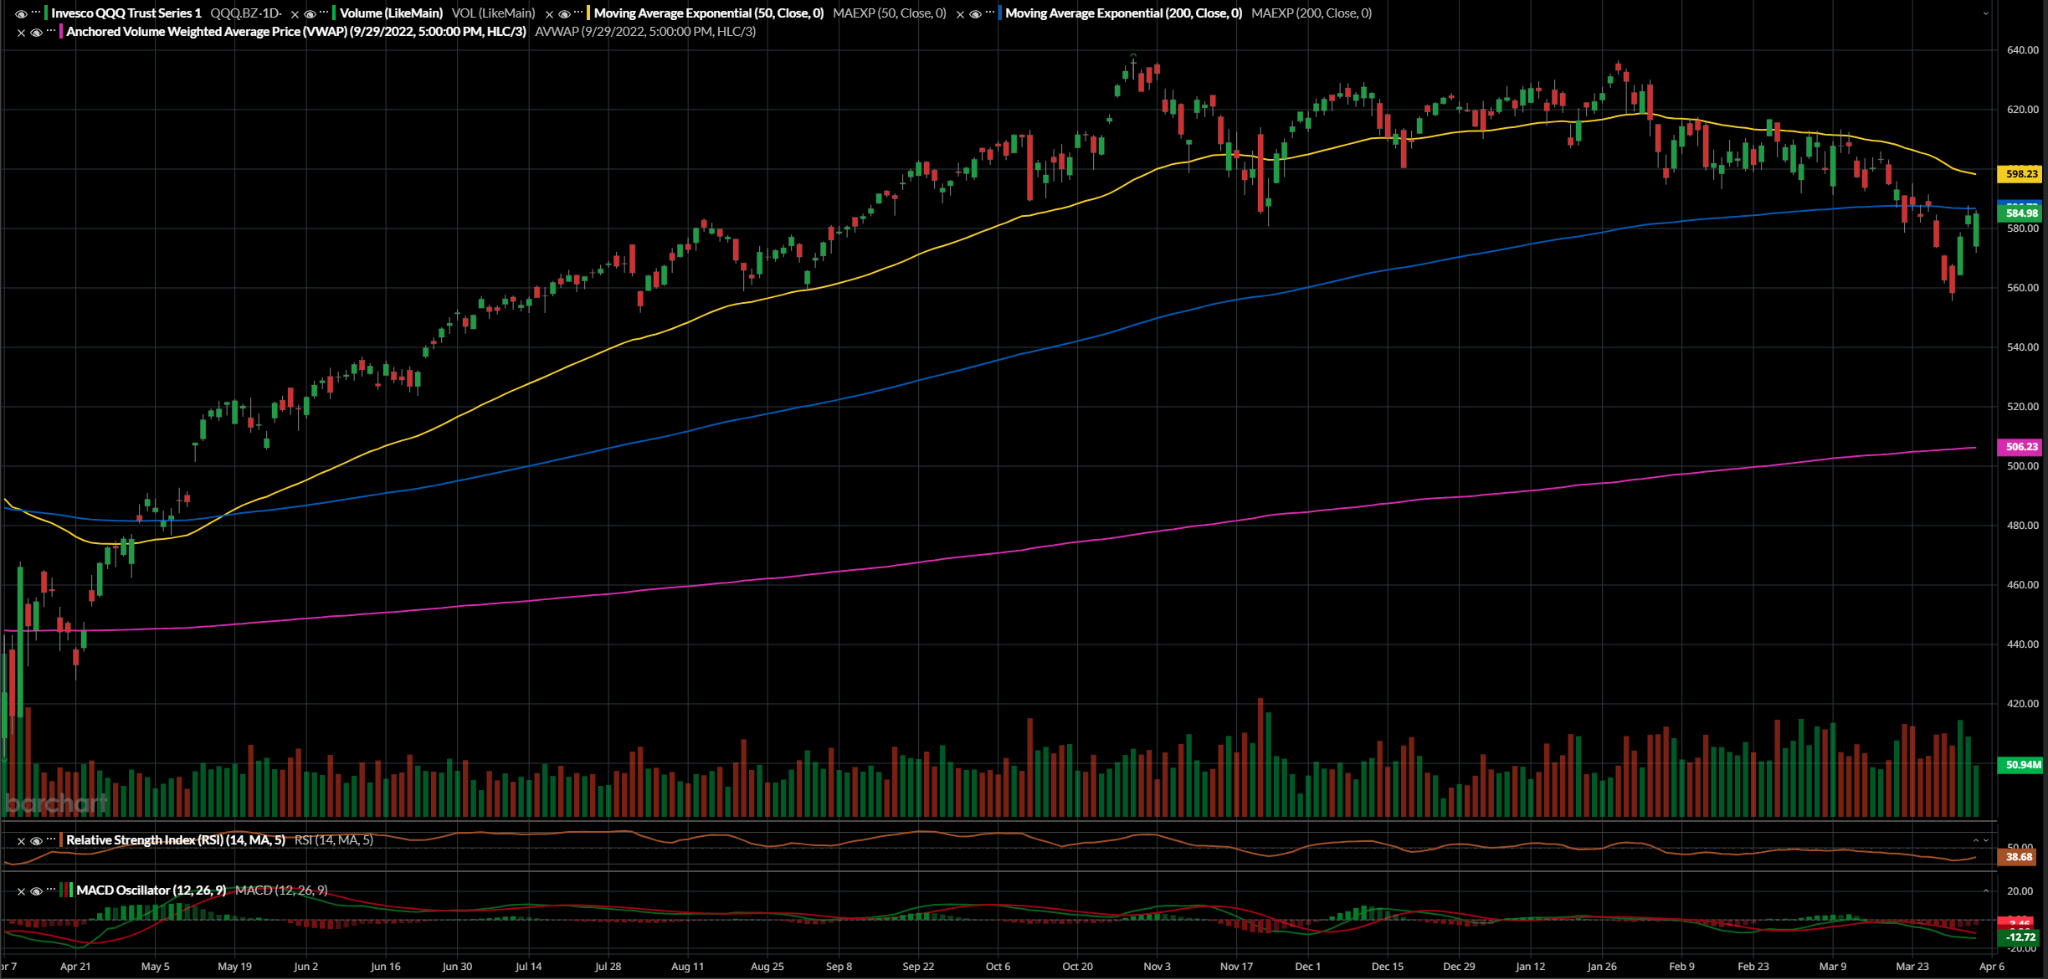
In the most recent cycle, the Nasdaq 100 has been maintaining a bullish structure. Even the downturn in the fall and winter could be explained by sentiment and normal trading ranges. The break below the 200-day EMA was very concerning and remains the key level to watch for this coming week.
Losing the 200-EMA was already bad enough, as it tells us the buyers who had been defending pullbacks earlier in the move are no longer in full control. But price has not yet completely unraveled either. It is sitting at the line and approaching it again.
It’s important to note that it is common for the first retest of the 200-EMA to fail before a breakout, making this level even more meaningful.
The first key level to watch is 592, which is where gamma is set to flip positive. Positive overall gamma introduces friction, and so movements above this level will tend to be less exaggerated than moves below it.
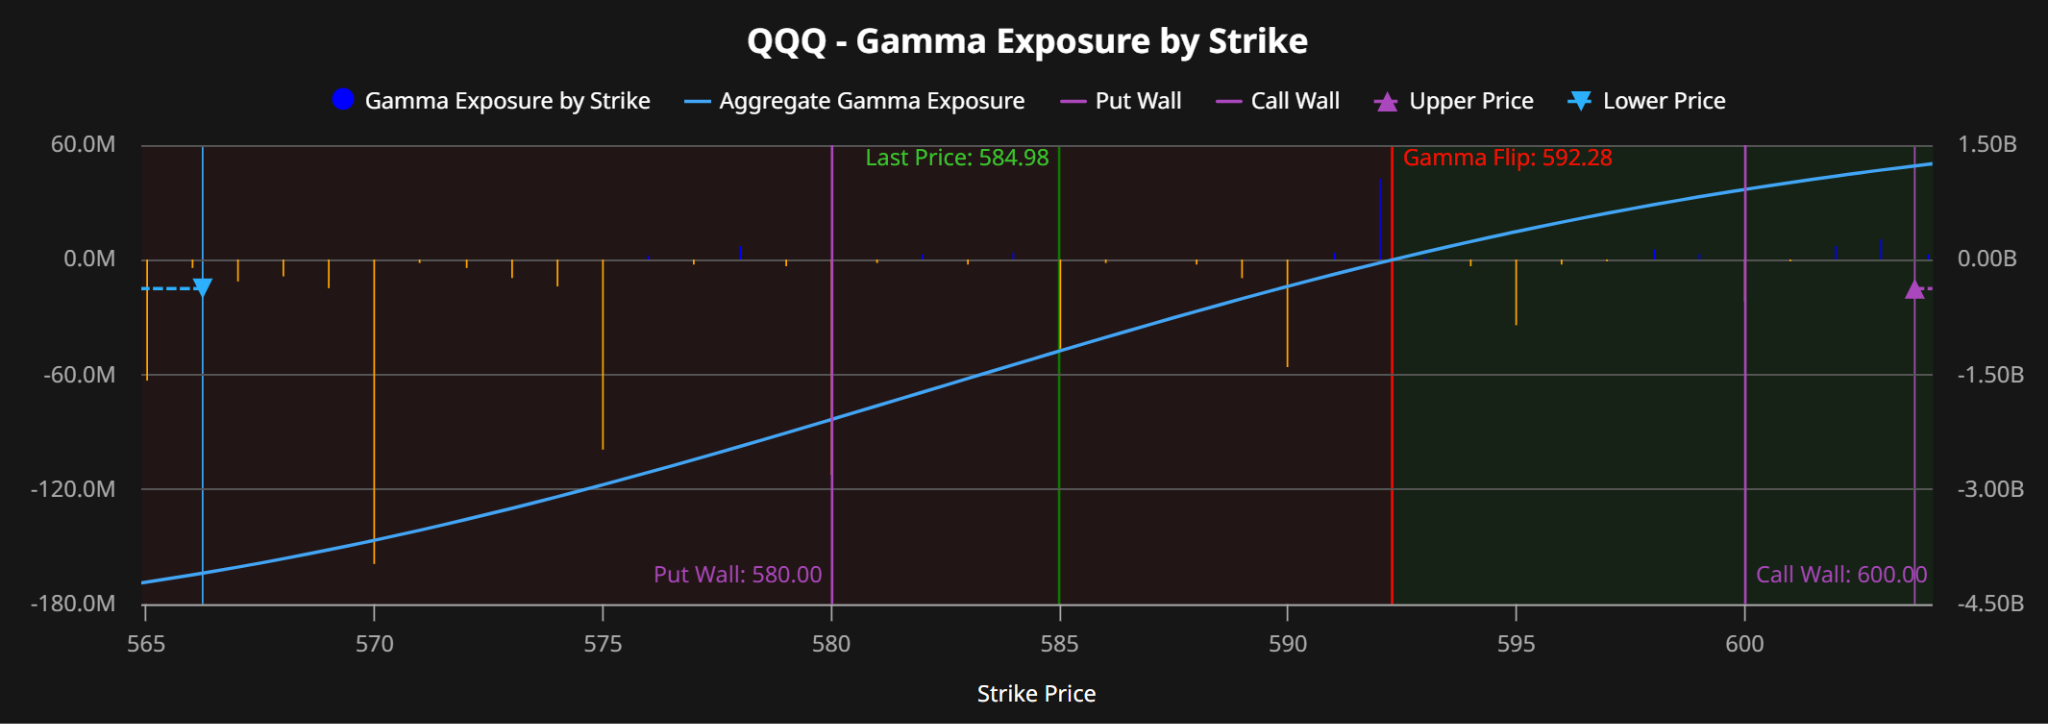
That is more of a mechanical level than a technical level, but that can help understand where volatility may lie, and it’s currently against the bulls once 592 breaks. The flipside is also true in positive gamma environments, where selling is muted as well. Holding above this level will lead to lower overall volatility, while staying below it means more exaggerations in both directions.
Technically, if the 200-EMA is reclaimed, it will become support. Above that, the 50-EMA sets resistance at ~589, with the next resistance levels sitting at 610-615 and 630-635 above that.
Below it, should the bears take control, support sits at the 560-565 zone and the 540-545 zone.
NASDAQ 100 Price Forecast
Every new NASDAQ 100 analysis as it publishes, today's technical signal and key levels, live price — on one page.
See all NASDAQ 100 forecasts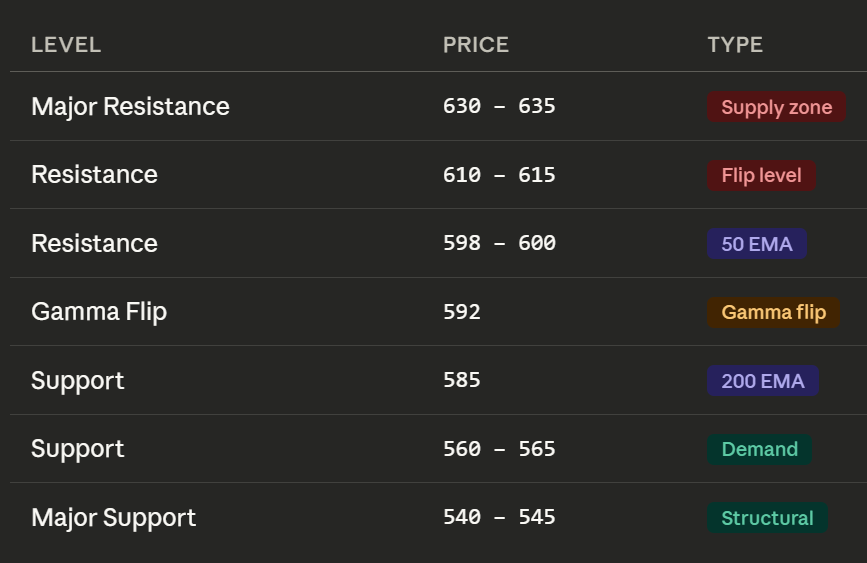
Why the 200 EMA Matters So Much Here
The 200-EMA isn’t just another line on the chart. For institutions, it acts as a dividing line between correction and crash. They respect this level, and the fight is still ongoing. It could be decided this week, and I would expect the breakout or rejection of this level to matter significantly for institutional demand. A loss of institutional confidence would be a big loss for the bulls.
One of the most important details in this setup is that this is the first touch of the 200-day EMA after an extended rally. That matters because first touches of the 200-day EMA often generate a reflex bounce, as mentioned earlier. Selling institutions frequently defend that level on the first test, especially when the broader trend had been strong beforehand, and the macro picture is still too cloudy for the bulls to take back control. Defense here the first time was easier than it is now. It is one of those recurring market behaviors that shows up and we can use as a potential signal.
That doesn’t mean that QQQ will bounce here. There is a big difference between price tagging the 200-day EMA and violently rejecting lower levels versus slicing straight through support and turning the level into overhead resistance. Macro news could certainly force a movement into one of these directions, but we may also expect that the price could stay at these levels as long as macro uncertainty about the U.S.-Iran War stays elevated.
Holding the 200-EMA and not breaking sharply lower would be great for the bulls, as that would solidify the deep support for the ~585 level for the next leg of the rally.
Momentum Indicators Support the Bears
In modern markets, momentum is often the police. It’s important to have these on your side, and this currently poses the biggest risk to the Nasdaq 100, as they are its weakest point.
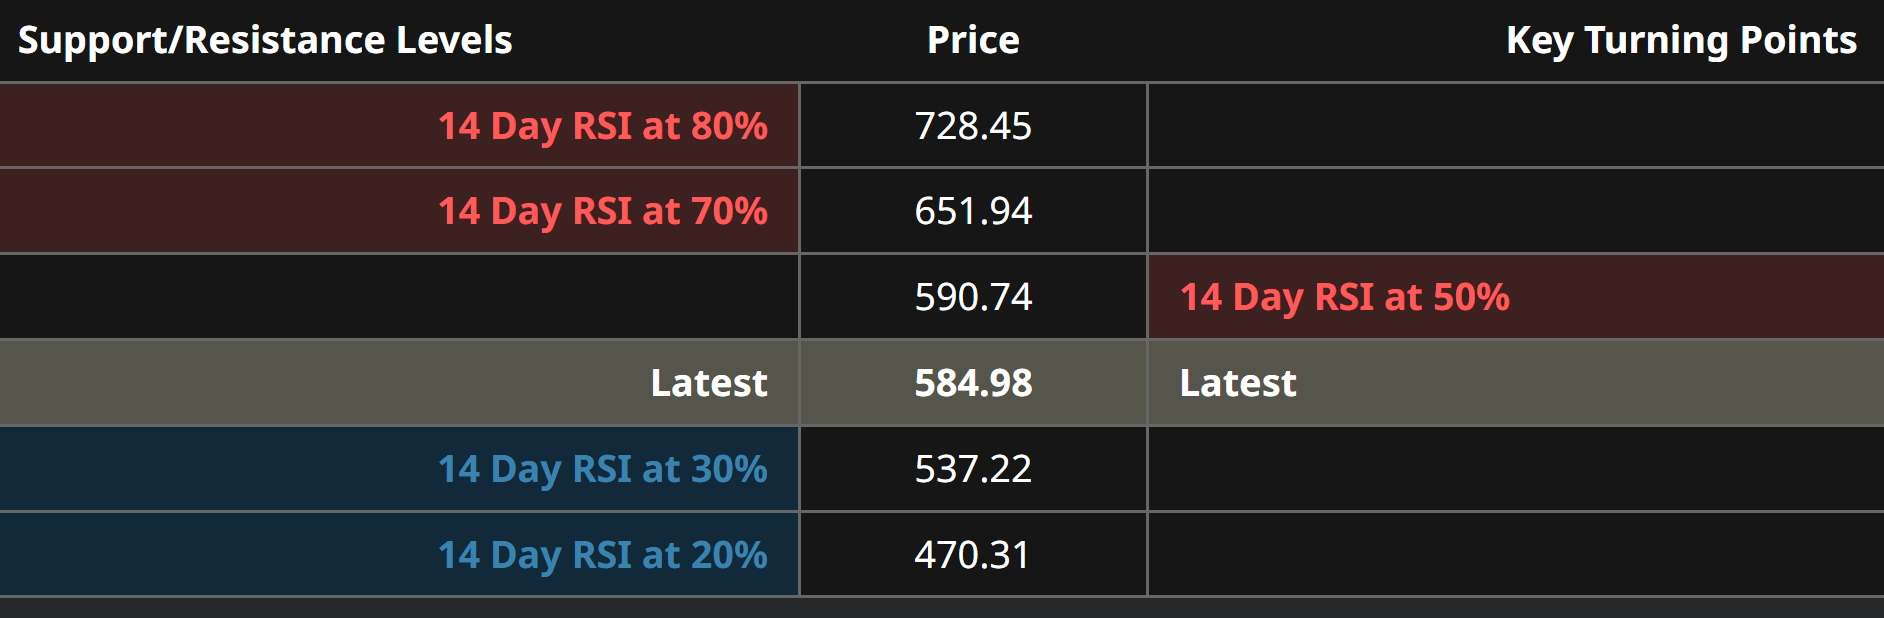
The RSI is currently sitting around 38 to 40. That is weak, but not bullish. This is not a chart that looks deeply oversold and ready for an obvious snapback. It looks more like a market that is still shedding momentum. Price would need to fill to ~537 to hit oversold, which would mean breaking down below both support levels. That’s a bearish read.
The MACD is telling a similar story. The histogram is bearish, though it’s flattening. That suggests momentum is slowing, but it’s still negative. The market has not yet earned the right to call it a reversal, and it needs a convincing reclaim above the 200-EMA to swing back to the bull’s favor.
Conclusion
The clean bullish trend is behind the Nasdaq 100, but it hasn’t broken down either. The failure at the 50-EMA shifted momentum sharply lower, and the failure of the first retest of the 200-EMA may have spooked many bulls. Failing this retest is more typical than many may realize, and so the second go at it, which the market seems to be headed toward in the coming week, will matter significantly more. Breaking above this level means a potential resumption of the trend.
Both bulls and bears should watch for the defense of the 200-EMA at ~585. A break in either direction will likely be decisive unless macro news about the U.S.-Iran War turns sentiment in a sudden direction. No matter what, there is likely to be significant volatility ahead.