



Crude Oil Rally Tests Resistance as Momentum Holds
Spot Brent crude oil nudged to a new war high at $120.54 Thursday and pulled back almost immediately. June WTI crude oil spiked to $110.93 overnight before sellers drove it back to unchanged. Both markets are showing the same thing right now. The rally is intact, the resistance is real, and the next few sessions are going to tell you whether this is a pause or a reversal. Keep reading for what the charts are saying and what is actually driving this market.
WTI Technical Outlook
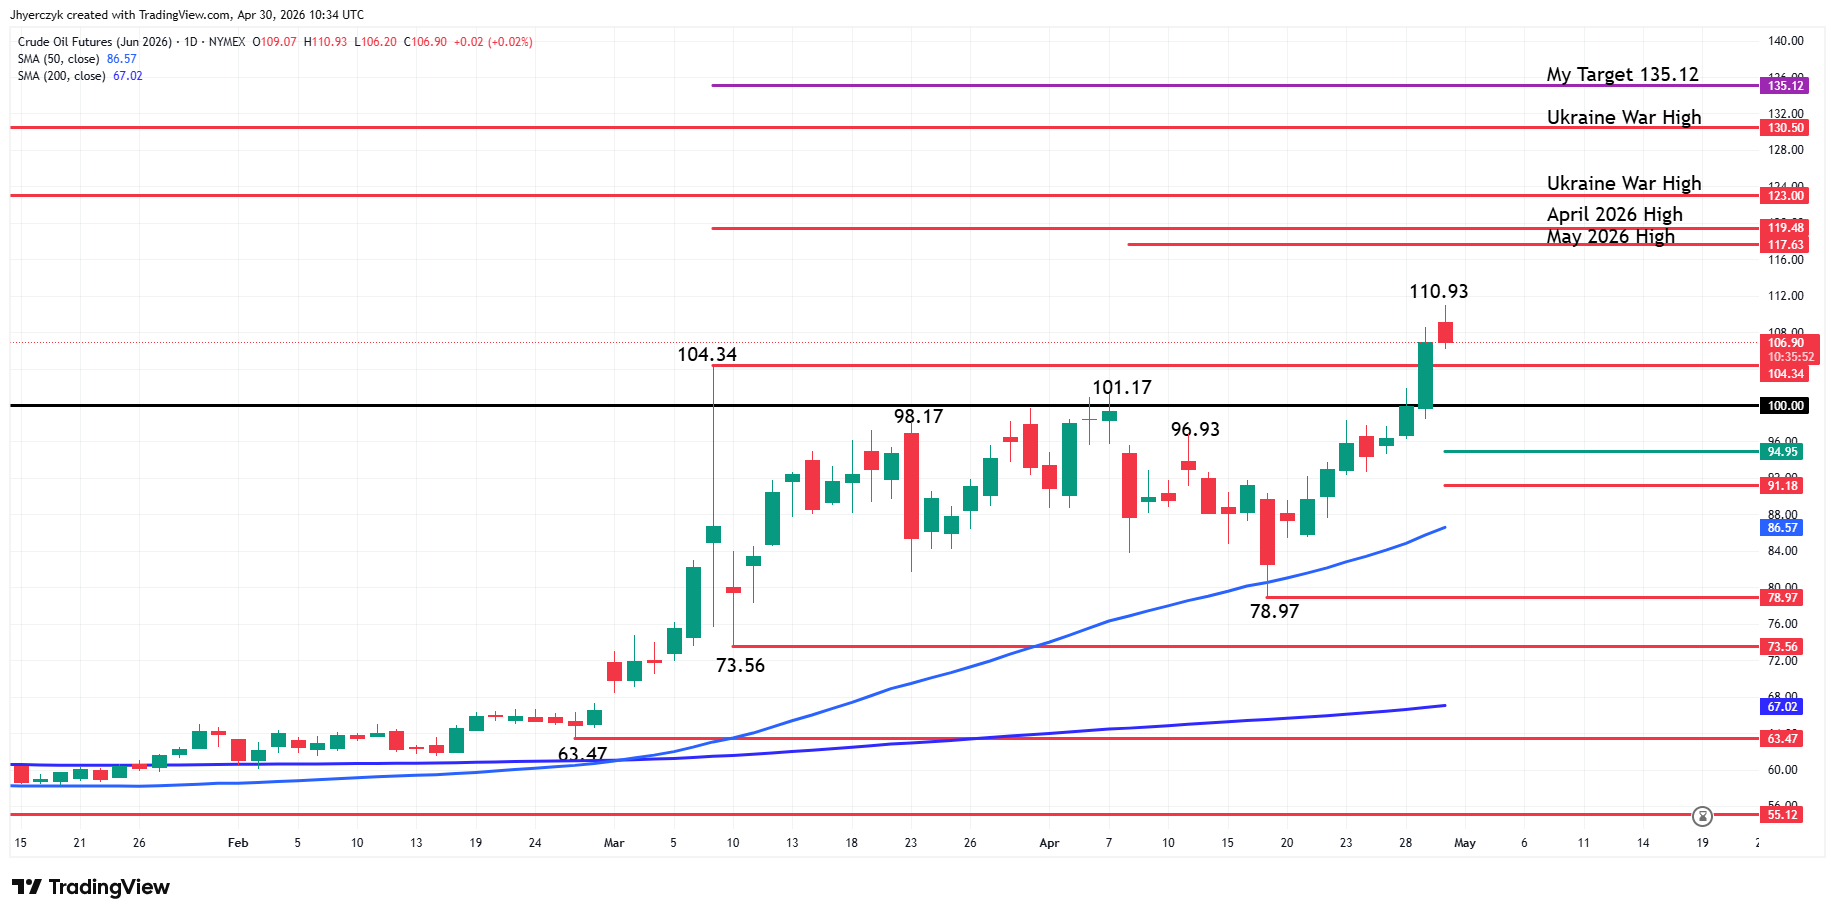
June WTI crude oil futures are trading flat on Thursday in a volatile session. Overnight, prices jumped to $110.93 before sellers came in to drive it back down to unchanged. At 10:26 GMT, the U.S. benchmark futures contract is trading $106.77, down $0.11 or -0.10%.
The main and minor trends are up, but today’s session marks the ninth day up from the April 17 main bottom at $78.97, which puts it inside the “window of time” for a potentially rally-killing closing price reversal top.
If the chart pattern forms and is confirmed, this could lead to a 50% to 61.8% correction of the rally from $78.97 to $110.93. This downside target area is $94.95 to $91.18.
The main trend is being steered by two trend indicators, the 50-day moving average at $86.57 and the main bottom at $78.97. As long as they stay intact, the market is likely to remain in buy the dip mode. If they fail as support, traders will rotate into getting their guidance from the 200-day moving average at $67.02.
Looking at the upside potential prices, you can see on the charts a number of prices that I call the “one and dones” with the exception of my target at $135.12. Looking back on when and how those tops were made, you’ll see that they were all fueled by spikes. I don’t recall seeing several days of distribution followed by the start of a downtrend like normal markets do when forming a top. These were all driven by excessive speculation and I don’t see how this market at this time is any different. So start bracing for heightened volatility should June WTI crude oil spike into my cluster of resistance, ranging from $117.63 to $135.12.
As for the near-term, the tone is likely to remain bullish on a sustained move over the psychological $100.00 level. I’m impressed by the “slow and steady” series of higher-highs and higher-lows. This indicates a cautious, but strong upside bias. That type of trading gave us $31.96 of gains over nine days. I don’t fear the slow grind into resistance, but beware of the price spike.
Brent Oil Price Forecast
Every new Brent Oil analysis as it publishes, today's technical signal and key levels, live price — on one page.
See all Brent Oil forecastsSpot Brent Technical Outlook
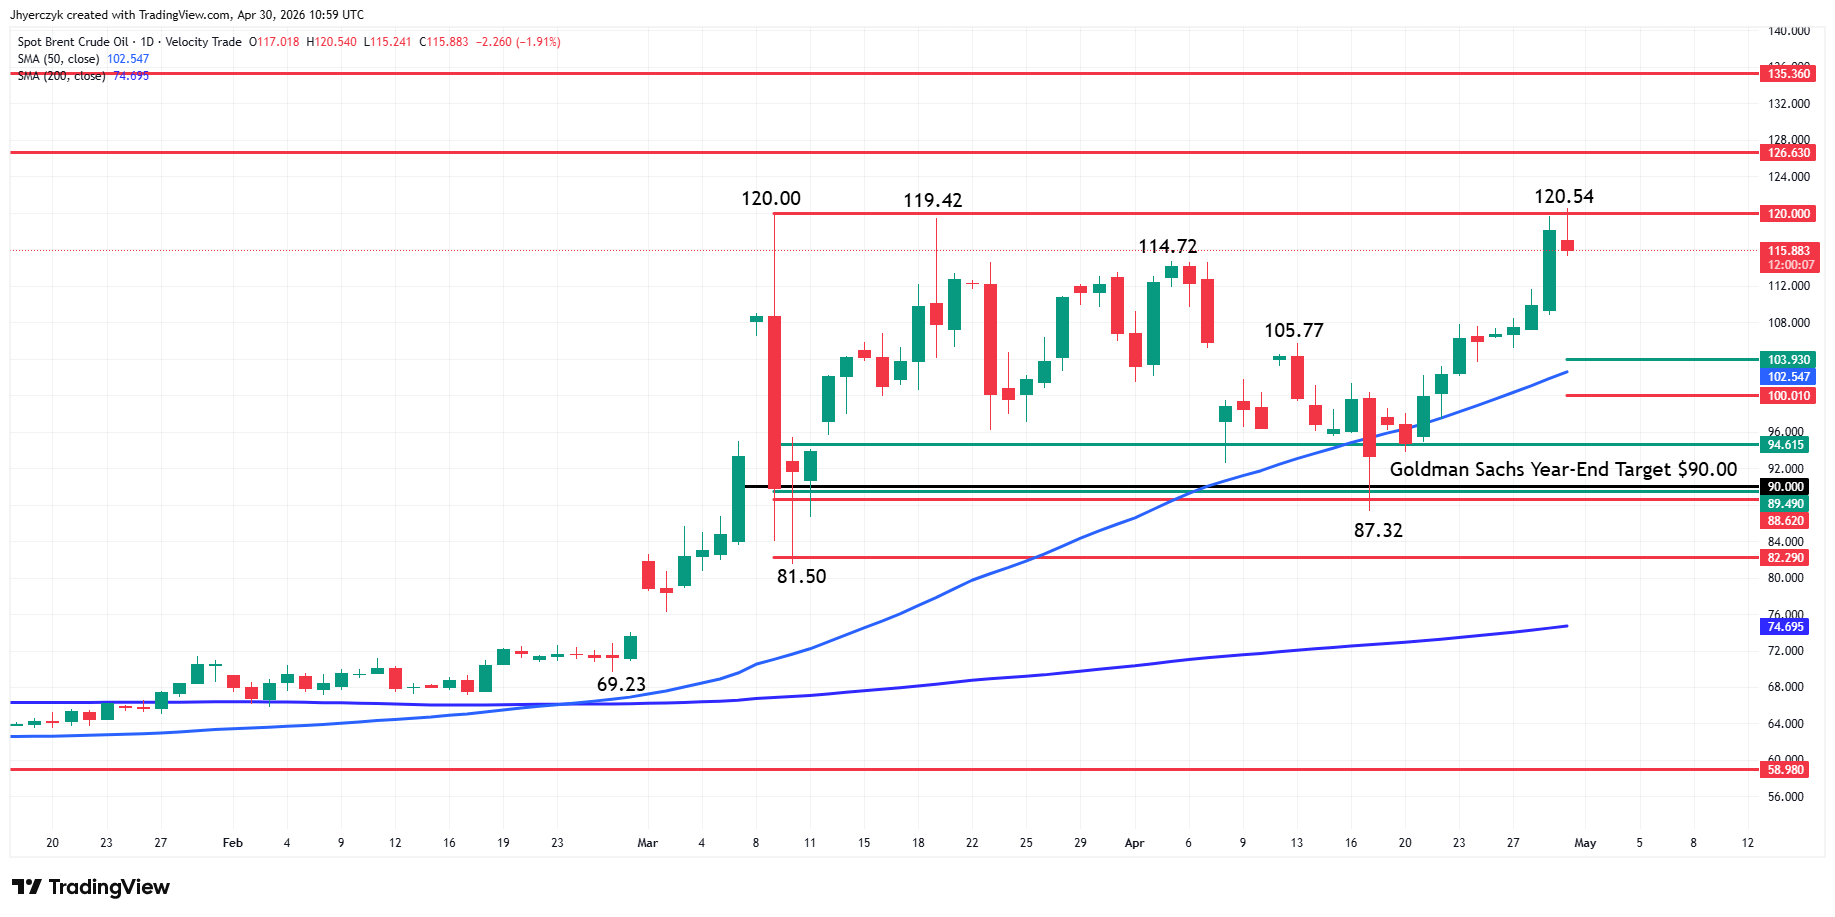
Spot Brent crude oil nudged to a new war high at $120.54 on Thursday, piercing the previous top at $120.00 before turning lower for the session. The early price action suggests profit-taking. Technically, it could be forming a closing price reversal top. However, we’ll need a lower close at the end of the session to find out.
The short-term range is $87.32 to $120.54. If there is a short-term pullback then we project a test of the retracement zone at $103.93 to $100.01. Inside this area is the 50-day moving average at $102.51. Trader reaction to a test of this support cluster will go a long way into telling us whether sentiment is shifting from bullish to bearish.
On the upside, the trend resumes later today if buyers can take out the intraday high at $120.54 with conviction. The nearest targets at $126.63 and $135.36 are tops formed at the start of the Russia-Ukraine War.
The Forecast Numbers Keep Moving Higher
A Reuters survey of 32 economists and analysts has revised crude oil price forecasts upward again and the direction of those revisions tells you more than the numbers themselves. Brent is now projected to average $86.38 per barrel and U.S. crude is projected at $80.07, up from a prior estimate of $76.78. A month ago those same analysts had Brent averaging $82.85. That is a 30% upward revision in a short period and it means the people running price models have stopped assuming this situation normalizes quickly.
The gap between current spot prices and those forecast averages is wide. Spot Brent above $120 while the projected average sits in the mid-$80s implies the market expects some giveback over time. I’ve seen this kind of spread before and it does not mean prices are about to collapse. It means the floor keeps rising. Every upward revision in the forecast is the analyst community admitting they underestimated how long the supply disruption would last.
What the Structure Is Telling Me
June WTI crude oil is no longer trading like a market priced for oversupply. Neither is Spot Brent. The consistent upward revisions in price forecasts confirm what the chart is already showing. The baseline has shifted and elevated prices are becoming the expectation rather than the exception.
What I am watching right now is not the upside. The upside targets are on the chart and I’ve published them. What I am focused on is the downside protection. Nine days up from $78.97 puts June WTI inside the window of time for a reversal. The spike to $110.93 overnight and the pullback to unchanged tells me the sellers are watching that resistance cluster just as closely as the buyers are. Spot Brent hitting $120.54 and backing off the same session is the same signal in a different contract.
What I’m Watching
A closing price reversal top on either contract today changes the near-term picture fast. The correction targets are $94.95 to $91.18 on June WTI and $103.93 to $100.01 on Spot Brent. Those are not disaster levels. They are value zones and I would expect buyers to show up on a test of either one. The 50-day moving averages sitting inside both zones give the bulls something to lean on. The level I am watching on June WTI is $100. That is where the trade breaks. Everything else is noise until the market tells me otherwise.
More Information in our Economic Calendar.