



The Strait of Hormuz deal that crude traders priced in last week does not exist. Both sides spent the past 48 hours raising demands instead of lowering them, and the physical evidence confirmed it Tuesday when vessel traffic hit a one-week low. The market gave back weeks of risk premium on a framework that never became a shipping agreement and now every dollar of it is going back in. The rally has legs because the disruption behind it has no timeline for ending.
At 08:32 GMT, September WTI crude oil futures were trading at $83.87, up $0.67 or 0.81%. October Brent was at $89.43, up $0.52 or 0.58%. Both contracts posted their highest closes since July 31 on Tuesday and extended the rally Wednesday before pulling back inside the prior session’s range.
The bid is not a reaction to a new supply loss. It is the market correcting for a sell-off that was wrong from the start. The physical picture never changed last week. Only the headline did.
Daily September WTI Crude Oil Futures Technical Analysis
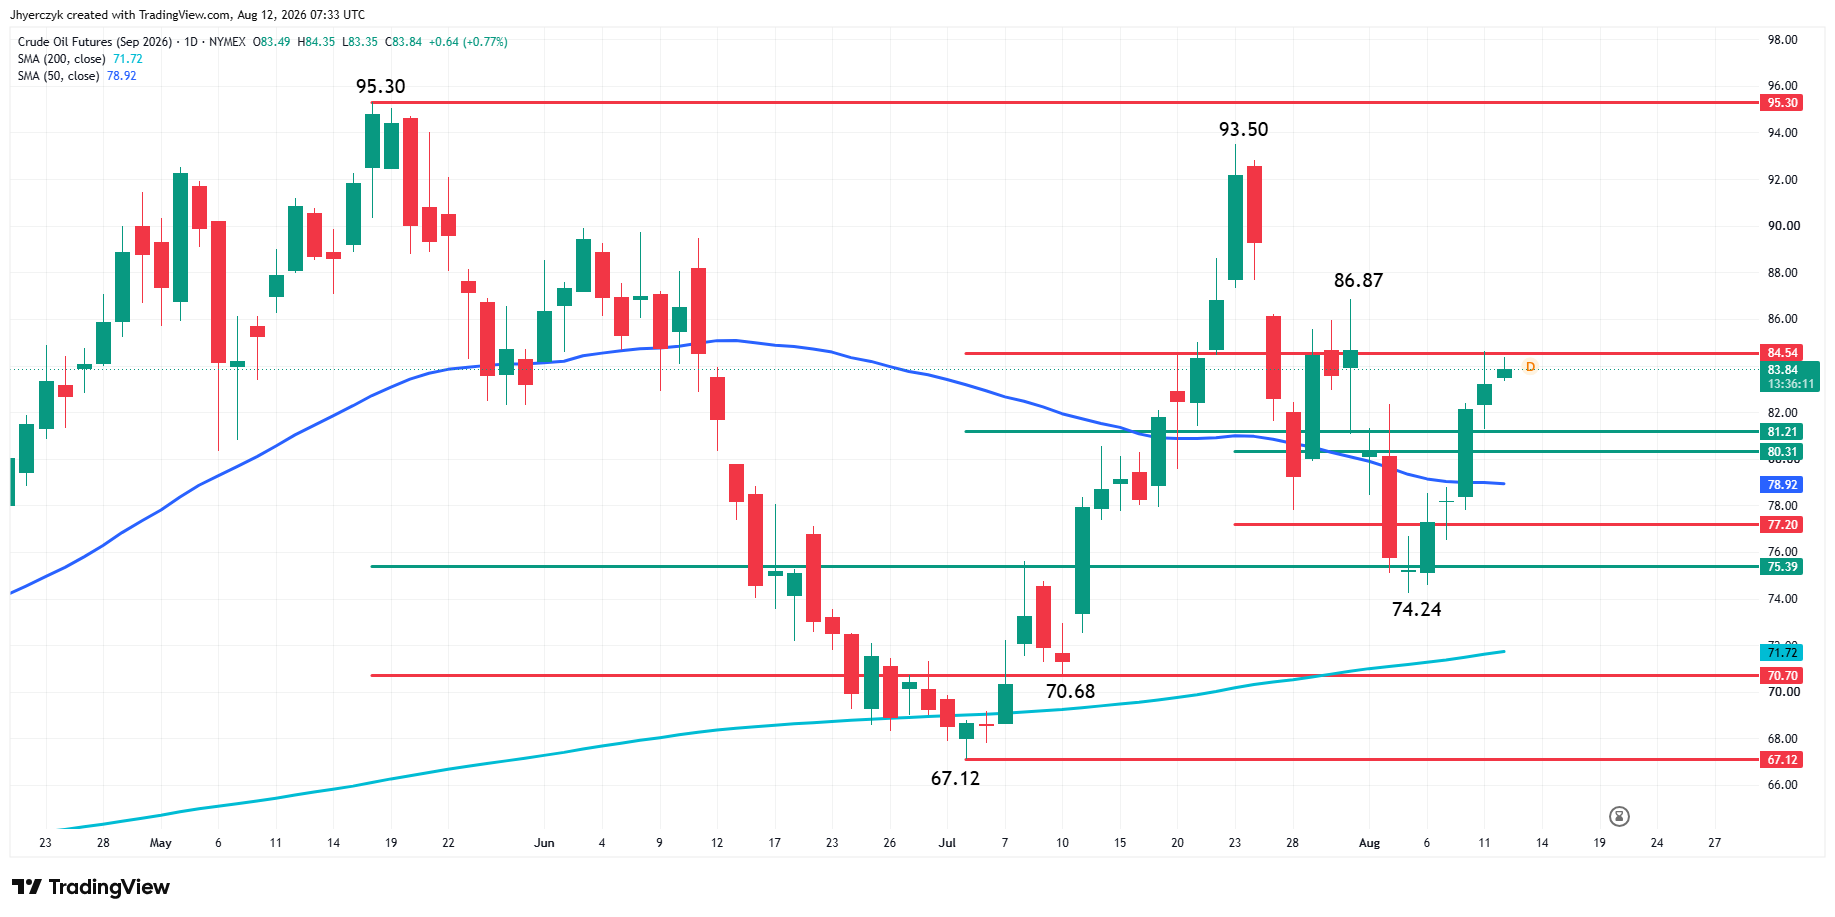
September WTI crude oil futures are edging higher early Wednesday but remain inside yesterday’s range. This suggests investor indecision and impending volatility. The key level to watch today is yesterday’s high at $84.61. Overtaking this level will also mean that the market has crossed to the strong side of a major Fibonacci level at $84.54.
A sustained move over $84.61 could create the upside momentum to challenge the July 31 main top at $86.87, which is the last resistance before the pair of tops at $93.50 and $95.30.
A failure to overtake $84.54 will indicate the buying is weakening or the selling is getting stronger. If this leads to increased selling pressure then momentum could increase enough to challenge a pair of 50% levels at $81.21 and $80.31. The major support, the 50-day moving average at $78.92, is the key indicator propping up prices.
Daily October Brent Crude Oil Futures Technical Analysis
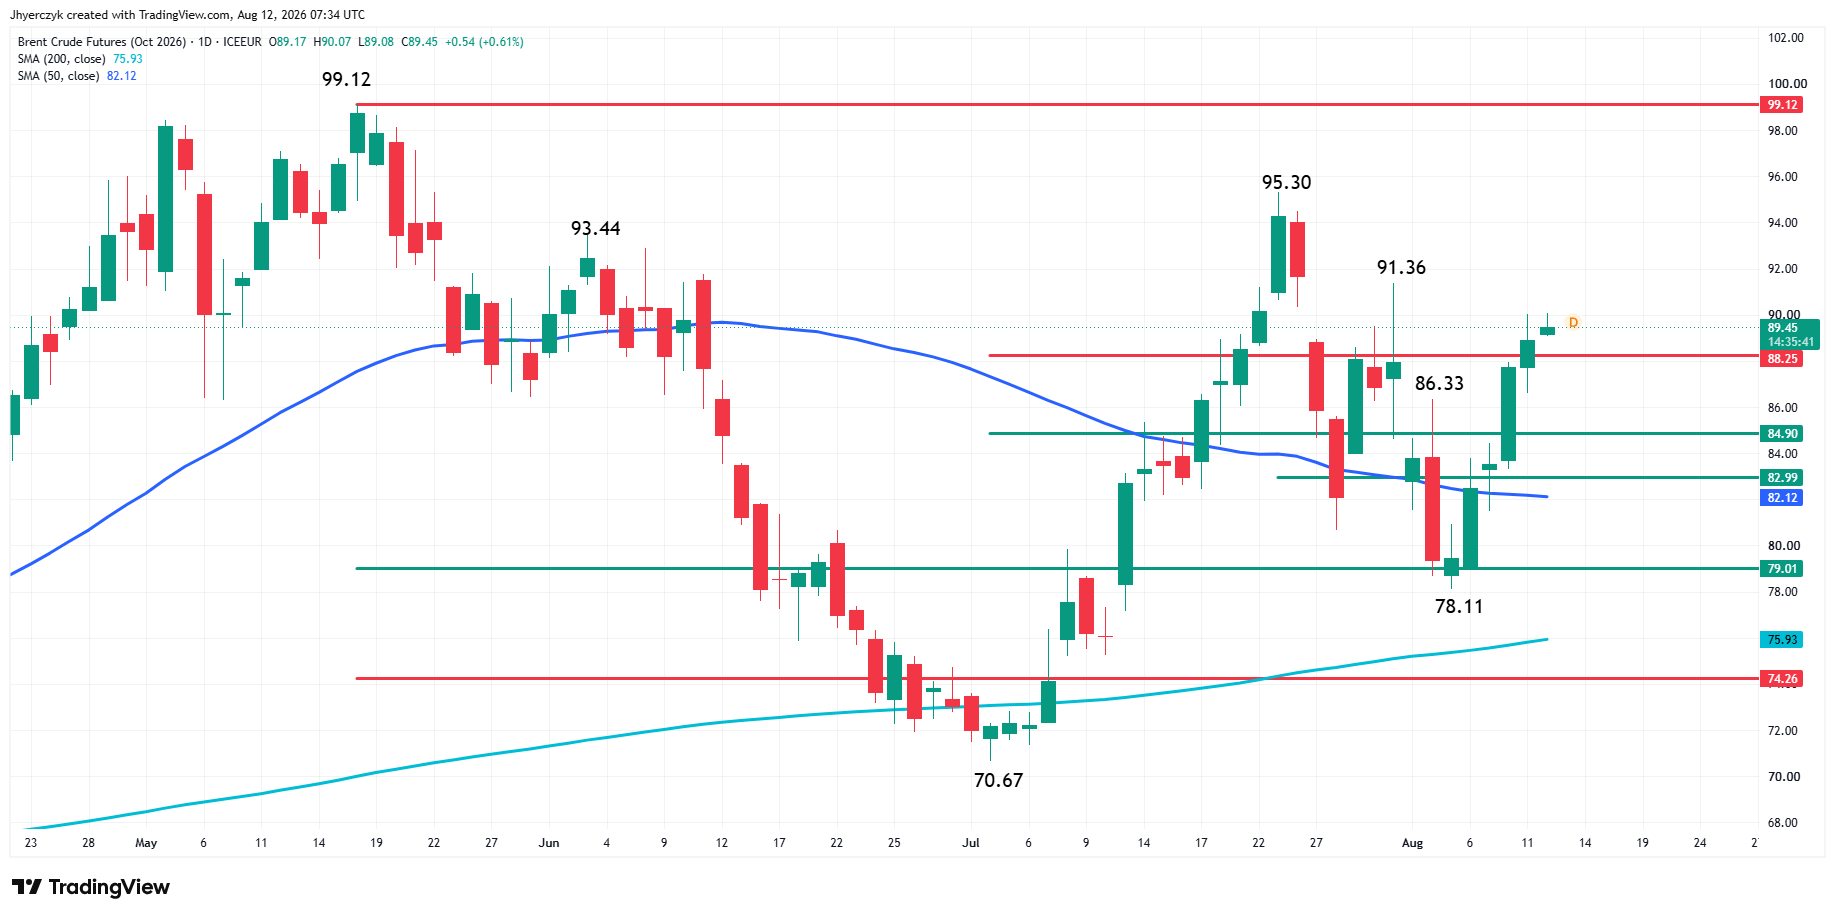
October Brent crude oil futures are steady-to-better early Wednesday. The market is posting an inside move that typically indicates investor indecision and impending volatility. However, as long as it remains on the strong side of the major Fibonacci level at $88.25, the bias will be to the upside.
Brent Oil Price Forecast
Every new Brent Oil analysis as it publishes, today's technical signal and key levels, live price — on one page.
See all Brent Oil forecastsTaking out yesterday’s high at $90.07 could trigger a surge to the upside, with the July 31 top at $91.36 the next target and the last resistance before the swing tops at $95.30 and $99.12.
The key to sustaining the rally is holding above $88.25. If Brent fails to hold $88.25, increased selling pressure could lead to a plunge into the major 50% level at $84.90. Additionally, a minor 50% level at $82.99 stands in front of the major support, the 50-day moving average at $82.12.
No Deal in Sight and the Strait Is Posting Worse Numbers
President Trump demanded that Iran compensate the United States for people killed in wars, attacks and protests. Iran’s top security official responded that the Strait of Hormuz stays closed until Iran’s conditions are met. A week ago the market thought these two sides were converging. Instead they are raising the political cost of any agreement, and the physical data arriving alongside the rhetoric confirms it.
Eight vessels transited Hormuz on Tuesday, a one-week low. Before the war, more than 125 ships per day moved through the waterway. The Bab el-Mandeb is not offering an alternative either, with the United States and Yemen’s Houthis reporting separate attacks on shipping Tuesday. Both routes out of the Gulf are restricted and neither side of the political argument is working to change that.
Middle East production shut-ins averaged 5.5 million barrels per day in July and the Energy Information Administration expects them to climb to 6.6 million in the third quarter. The disruption is not winding down. The EIA’s own forecast says it gets worse from here, with war-related supply losses expected to persist through the end of 2027.
The API Build Does Not Change the Supply Story
The American Petroleum Institute reported a 9.1-million-barrel crude build for the week ending August 7. That is a big number and it landed after a three-day rally that has both contracts pressing against resistance. Sellers will try to use it Wednesday. Gasoline and distillate stocks both drew, so the build is not telling a demand story. It is telling a domestic storage story while the real supply problem is still stuck in the Strait of Hormuz.
Rising Fuel Costs Keep the Pressure on Crude Bears
The Energy Information Administration raised its 2026 gasoline forecast by 3.7% and its diesel forecast by 5.4%. The 2027 gasoline number went up 6.5%. That is the EIA confirming what the market already suspects. Restricted shipping through Hormuz is not a short-term disruption anymore. It is repricing fuel costs on a multi-year timeline, and every upward revision makes it harder for crude bears to argue the premium should come out.
What to Watch
The EIA inventory report is the immediate test. If it confirms the API build, sellers have a reason to press after three consecutive up sessions. But a one-week domestic crude build does not override a shipping disruption the EIA itself does not expect to resolve before 2028. Vessel traffic through Hormuz is still the number that matters. Eight ships Tuesday is not a reopening and the premium stays until that count moves toward normal.
The political side is working against a resolution. President Trump’s compensation demand and Iran’s refusal to move off its conditions are not the language of two sides closing a deal. They are the language of two sides settling in for a longer fight. That matters for crude because every session without progress is another session where producers cannot export normally, storage inside the region fills further, and the shut-in forecast gets harder to walk back.
Both contracts are trading inside Tuesday’s range Wednesday morning, holding near resistance. WTI needs to clear Tuesday’s high to open the path toward the July top. Brent above its key Fibonacci level keeps the bias bullish, but a failure there shifts momentum toward a correction into the mid-$80s.
If you’d like to know more about how to trade crude oil, please visit our educational area.