


Platinum (XPL) and palladium (XPD) rebounded on Wednesday, but both metals remain below the important resistance levels. In my view, platinum may stay stronger than palladium, but a break below $1,550 in platinum or $1,200 in palladium would increase the risk of another sharp decline. This article examines the latest macro drivers, key technical levels and relative performance across the precious metals market.
Fed and EV Demand Shape the Platinum and Palladium Outlook
Platinum and palladium prices rebounded on Wednesday due to broader recovery in the precious metals sector. Platinum gained over 1.5% while the palladium gained over 2.4%. This rebound in the broader precious metals was driven by technical buying.
The Middle East remains an important catalyst for developments. Energy prices have risen due to the threats to oil shipments in the Red Sea. This adds up to higher costs of mining, processing and transport for the platinum-group-metal producers. But the higher oil prices also could keep inflation high and cause the Federal Reserve to keep interest rates high. But the geopolitical uncertainty may also support some defensive buying across the broader metals market.
An upward movement of interest rates tends to make the US dollar more attractive and make it more expensive to hold non-yielding metals. The pressure could create a challenge for platinum and palladium to push further on the upside. This is why the rally in precious metals is limited below their key resistance levels.
Another challenge is the outlook for the automotive sector, especially for palladium. BloombergNEF forecasts that sales of passenger EVs worldwide are set to increase to more than 23 million in 2026, up 11% from 2025.
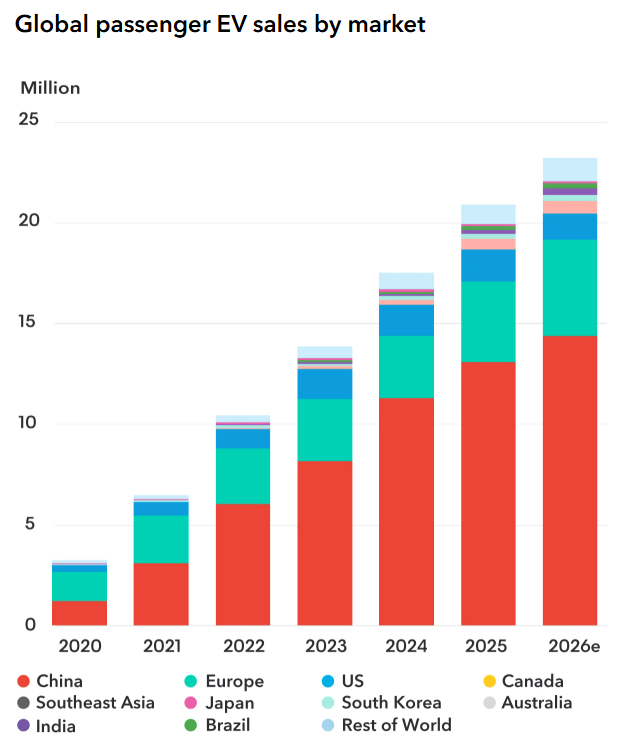
Battery electric vehicles do not use platinum or palladium in exhaust catalysts because they do not have conventional combustion engines. These metals are mainly used in the catalytic converters of petrol, diesel and hybrid vehicles.
Hence, the growth of EVs could reduce the demand for palladium for conventional vehicles in the long run. While palladium demand is under pressure due to the EV transition, platinum has a more diversified demand base and may continue to be stronger.
Platinum Price Forecast: $1,700 Breakout Could Target $1,900
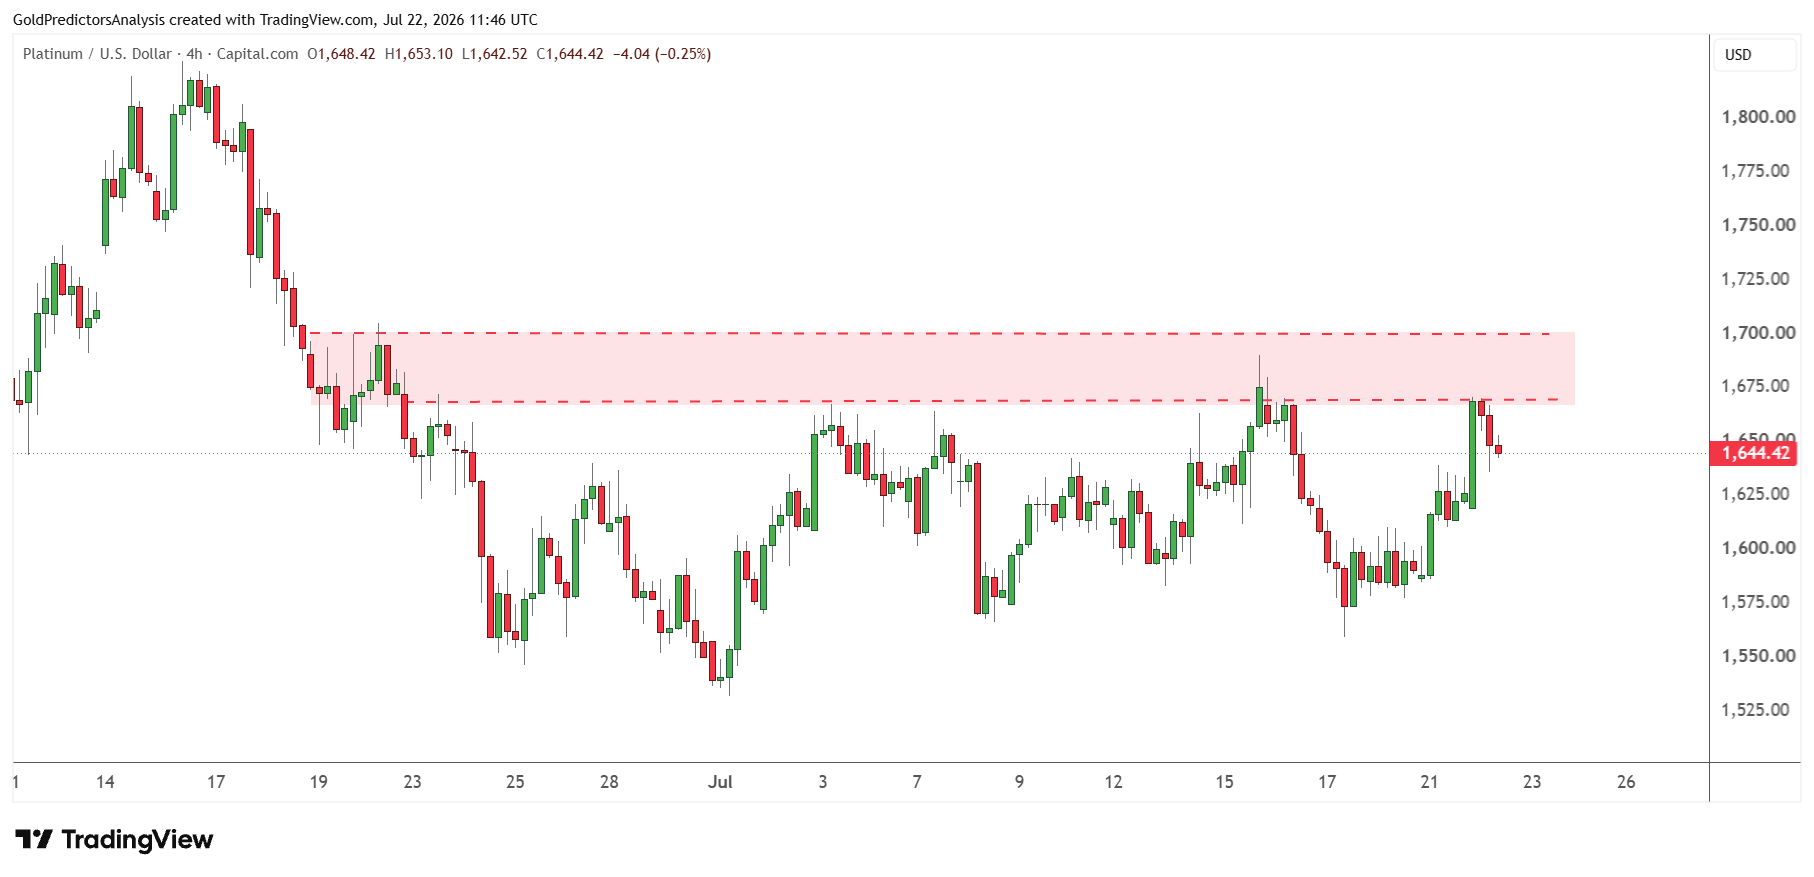
The platinum price has broken the immediate trend line stretching from the May 13, 2026 highs and then continued to consolidate below $1,700. The consolidation below $1,700 points to weakness. But if the price breaks above $1,700, it will likely open the door for strong rally toward $1,850. But a break below $1,550 will indicate a further drop toward the lower support region of $1,450 to $1,400 as discussed in the previous analysis.
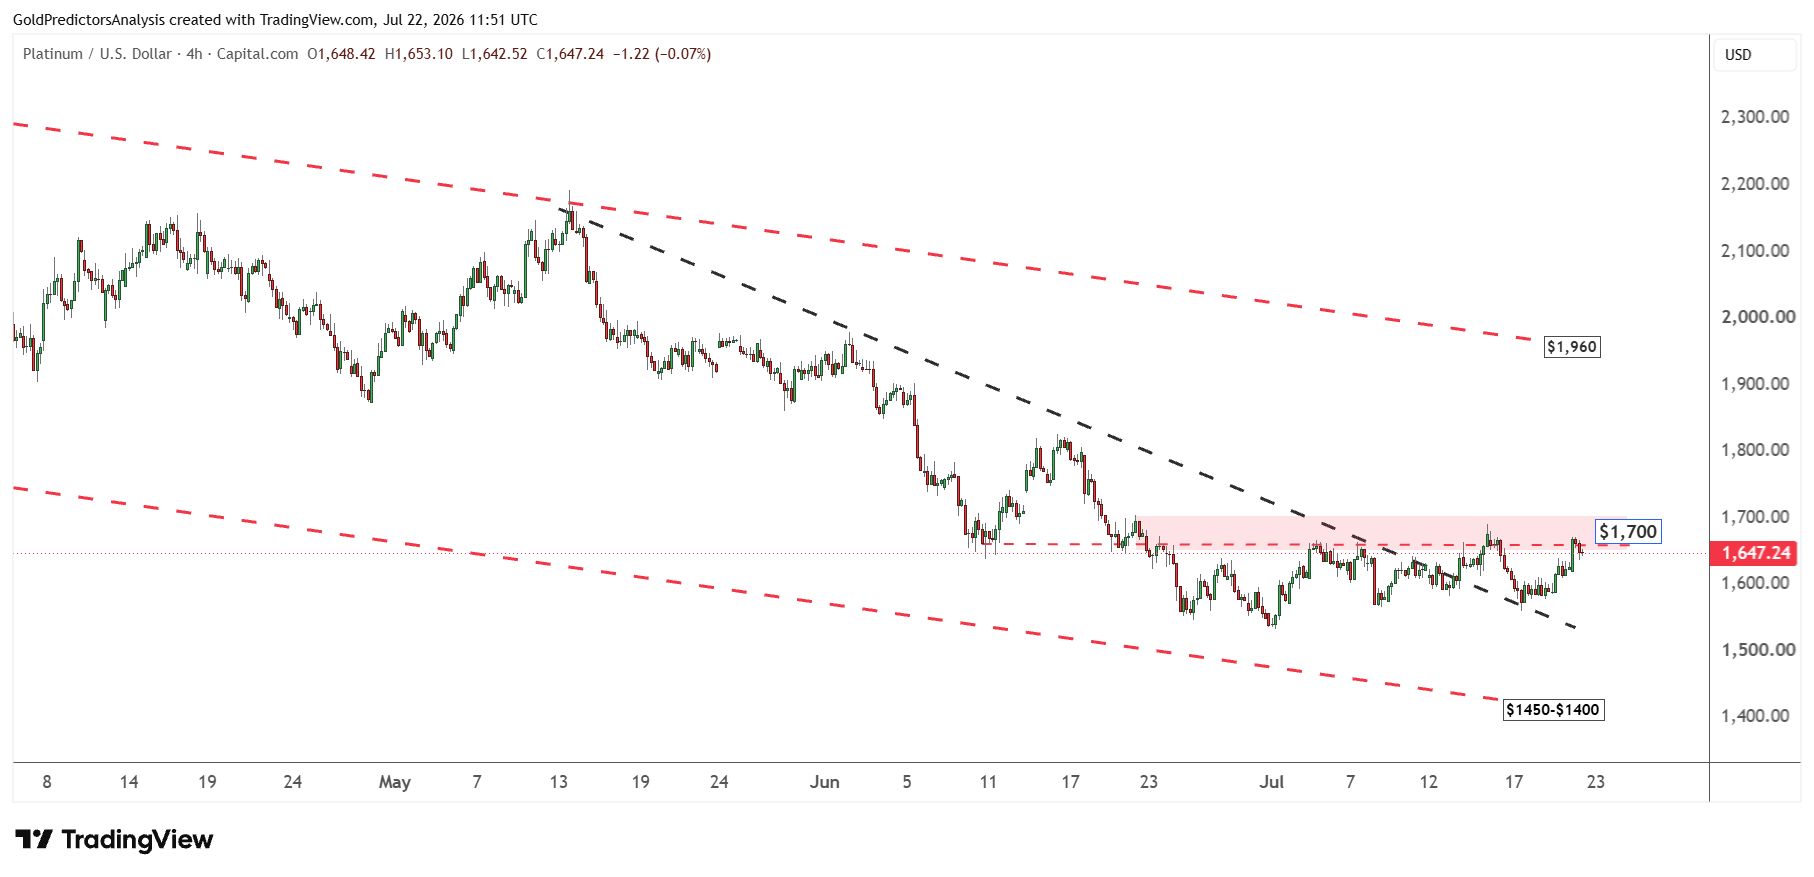
The importance of the current consolidation is highlighted in the 4-hour chart, which shows that prices are consolidating in the blue shaded area. This area is defined by the descending trend line stretching from December 31, 2025 lows.
Each time the price hit this level, it quickly recovered higher toward the $2,000 area. But this time is different. The price has been consolidating within this region for the past 30 days. A break above $1,700 will likely push the price toward the $1,850 to $1,900 region. But a break below $1,550 will will point to strong drop toward $1,400.
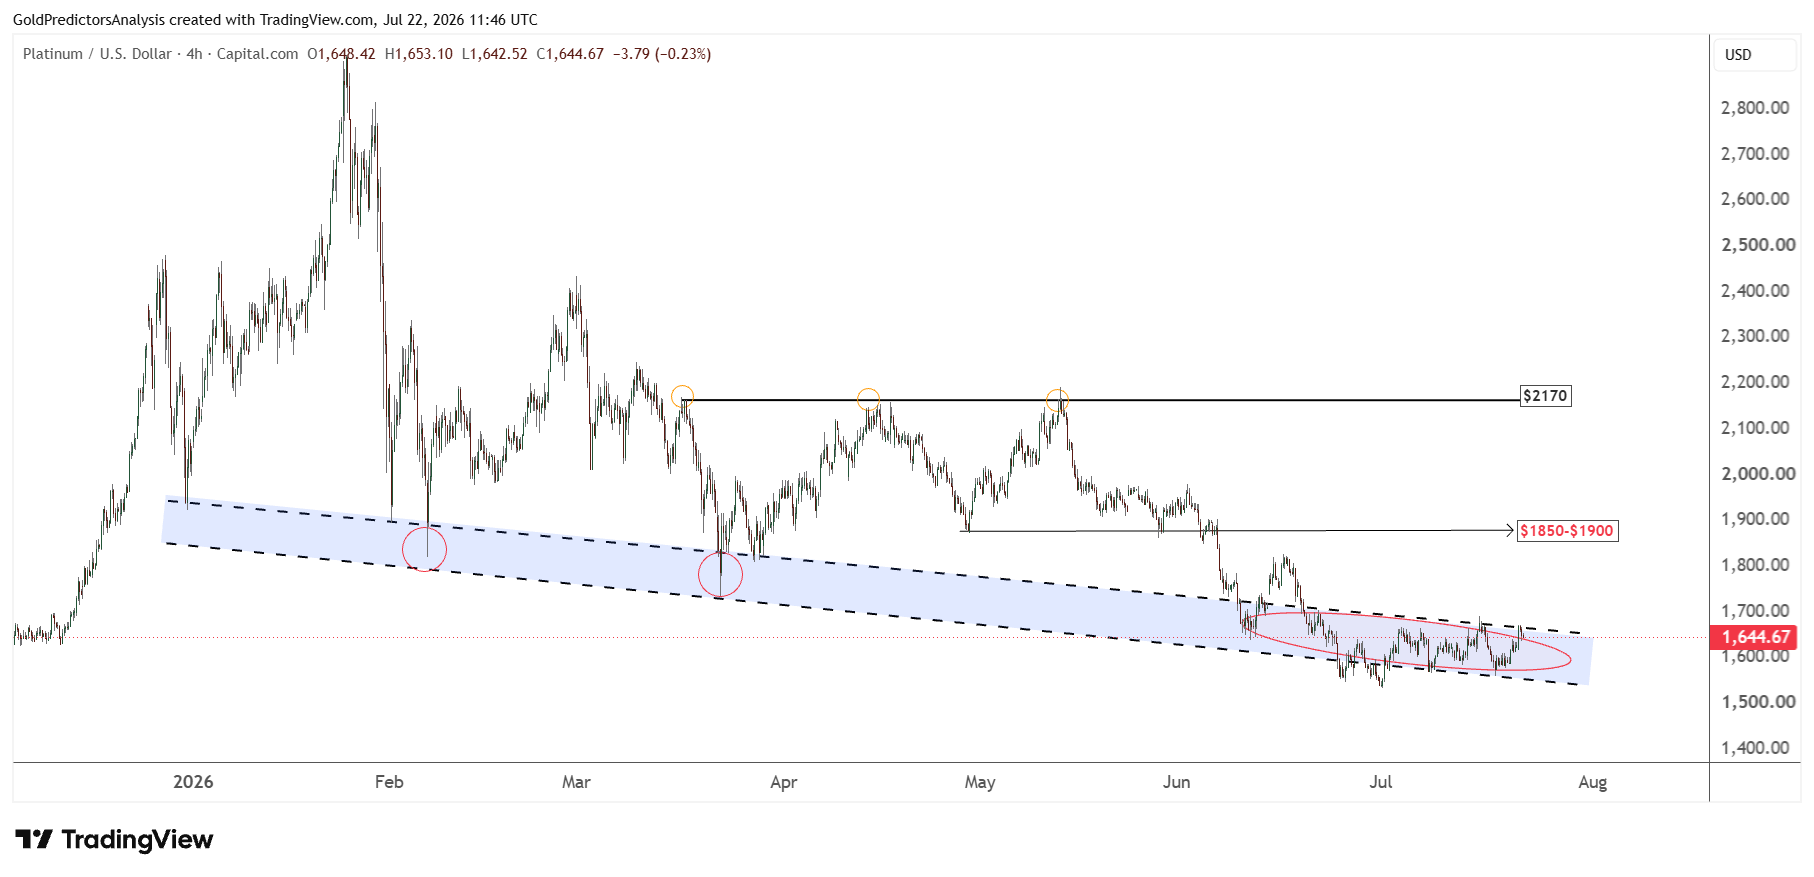
The 4-hour chart below shows the price action during the recent consolidation. The chart shows the constant price action above $1,550. However, the price has been unable to break above $1,700 since June 22, 2026. If prices fail to break above $1,700, it will likely indicate that the price consolidation may resolve to the downside, increasing the possibility of further losses. The escalating tensions in the Middle East increase the risk of a further drop from the red shaded area.
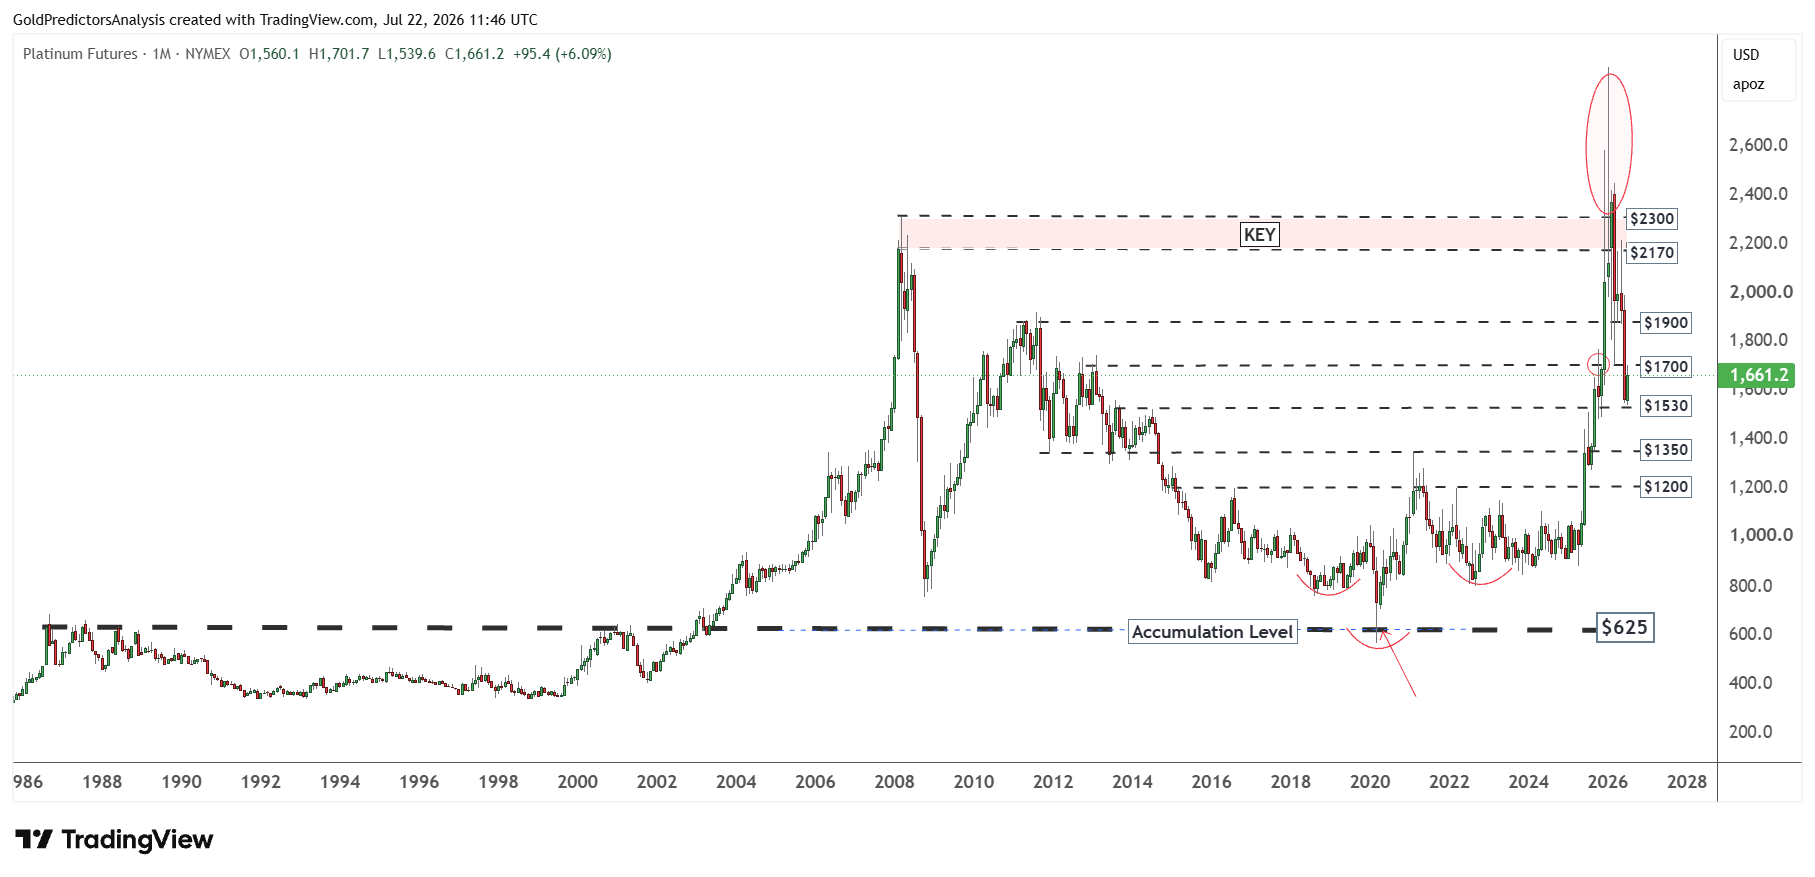
The monthly chart below shows the importance of the $1,500 and $1,700 levels. The chart shows that the $1,700 level is defined by the 2012 highs while the $1,500 level is defined by the 2014 highs. This indicates that a break of either level will define the next move in the market. But the monthly candles for April, May and June indicate that the next move in the platinum market will likely be lower toward the $1,350 area.
Palladium Price Forecast: $1,340 Resistance Limits the Recovery
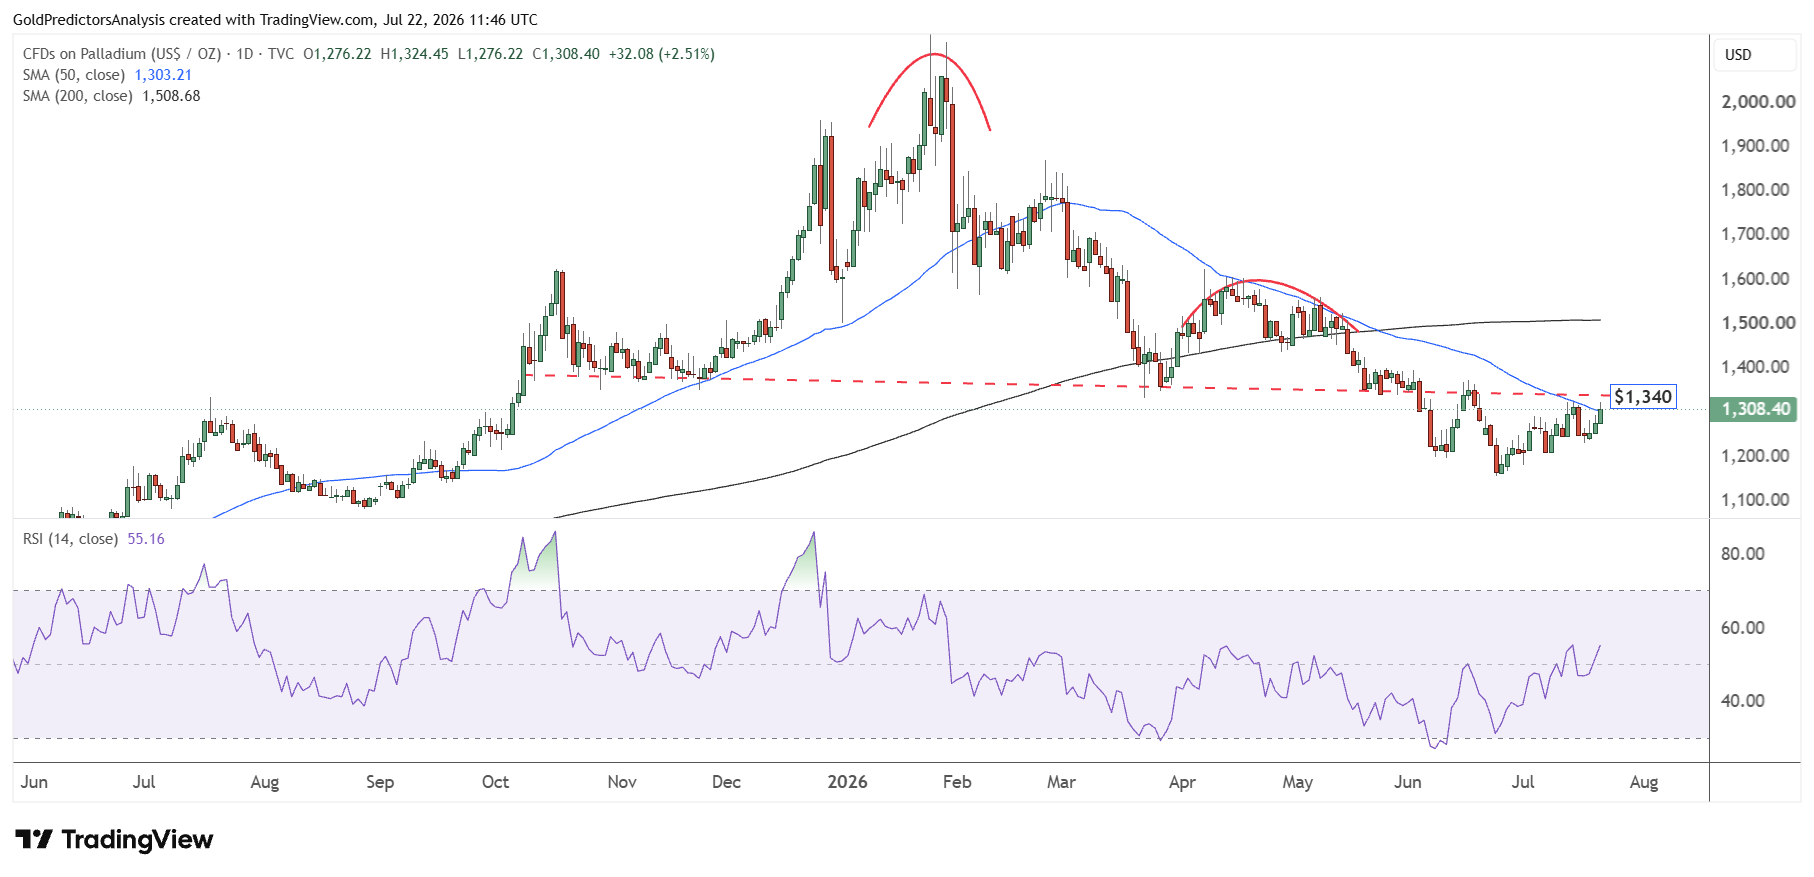
Palladium price is near the $1,340 resistance level as seen in the chart below. The resistance at $1,340 is defined by the descending trend line stretching from the October 2025 highs. This is a very significant resistance level. A break above $1,340 will indicate further upside toward the 200-day SMA at the $1,500 level. But the price action during the first quarter of 2026 was quite bearish. If prices fail to break above the $1,340 level, it will indicate further downside toward $1,100.
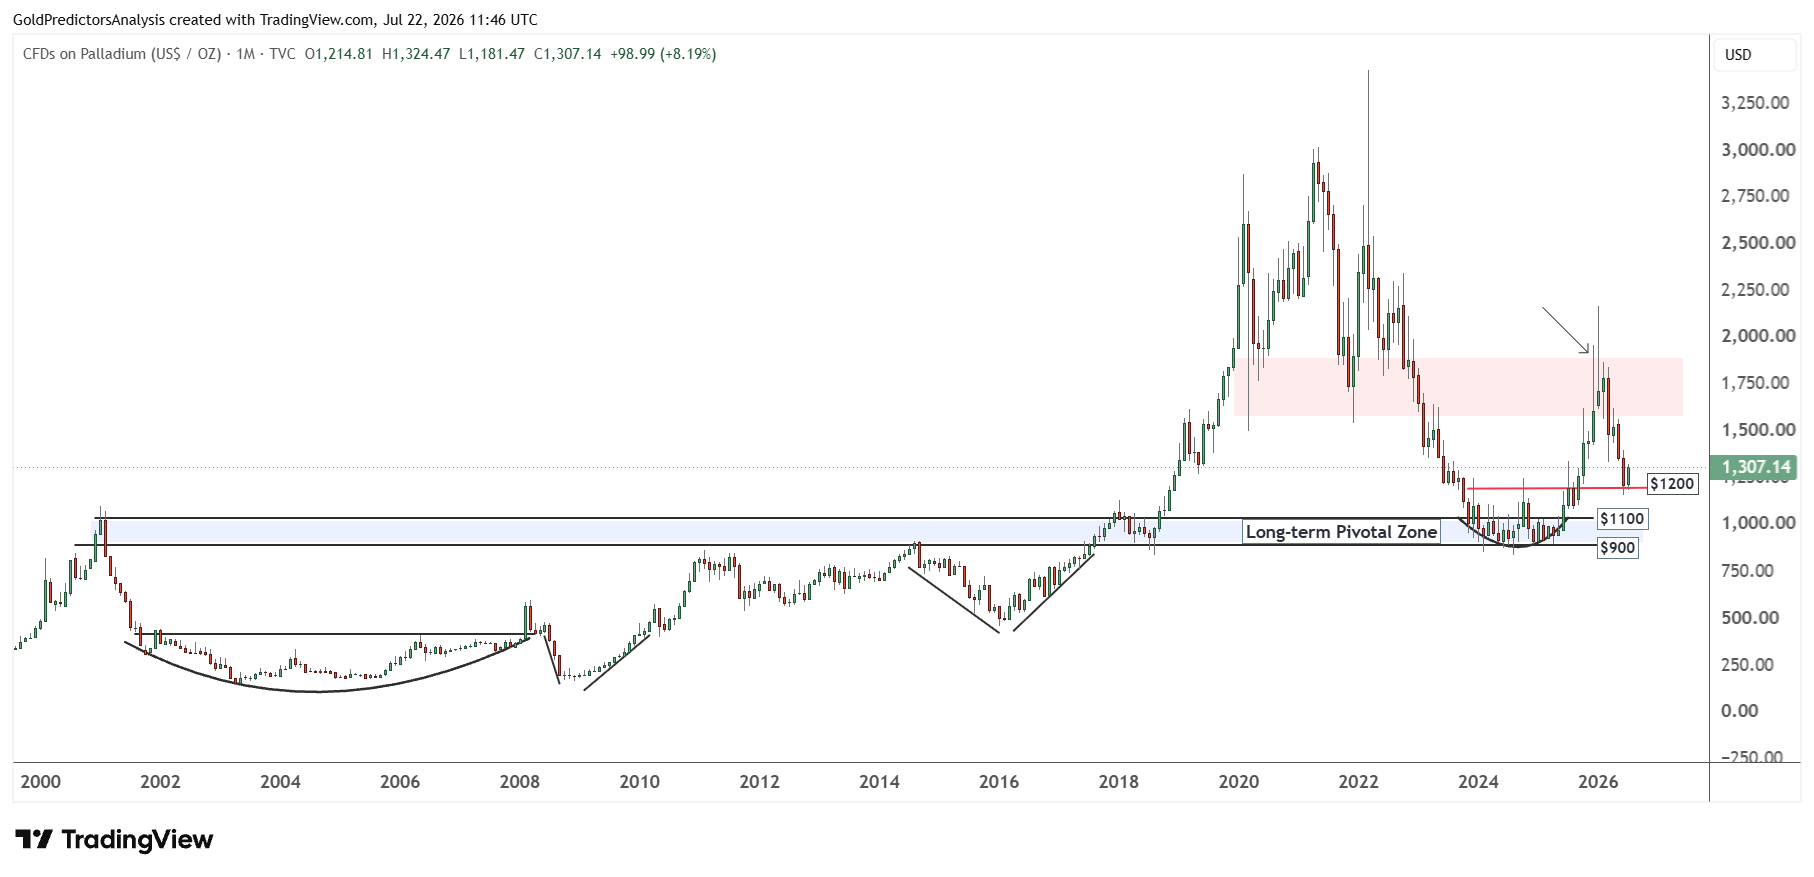
The monthly chart for palladium shows strong bearish pressure. The monthly candles for May and June are pointing to the downside. The current rebound from $1,200 is due to the strong support provided by the neckline of the bottom formation that was formed in 2024 and 2025.
A break below $1,200 will open the door for a strong drop toward the $1,100 region. This region shows the strong long term support. Overall, a correction toward the $900 to $1,100 region will be considered a strong pivotal zone for investors.
Platinum Ratios Show Mixed Performance Across Precious Metals
Platinum Outperforms Palladium but Trails Silver
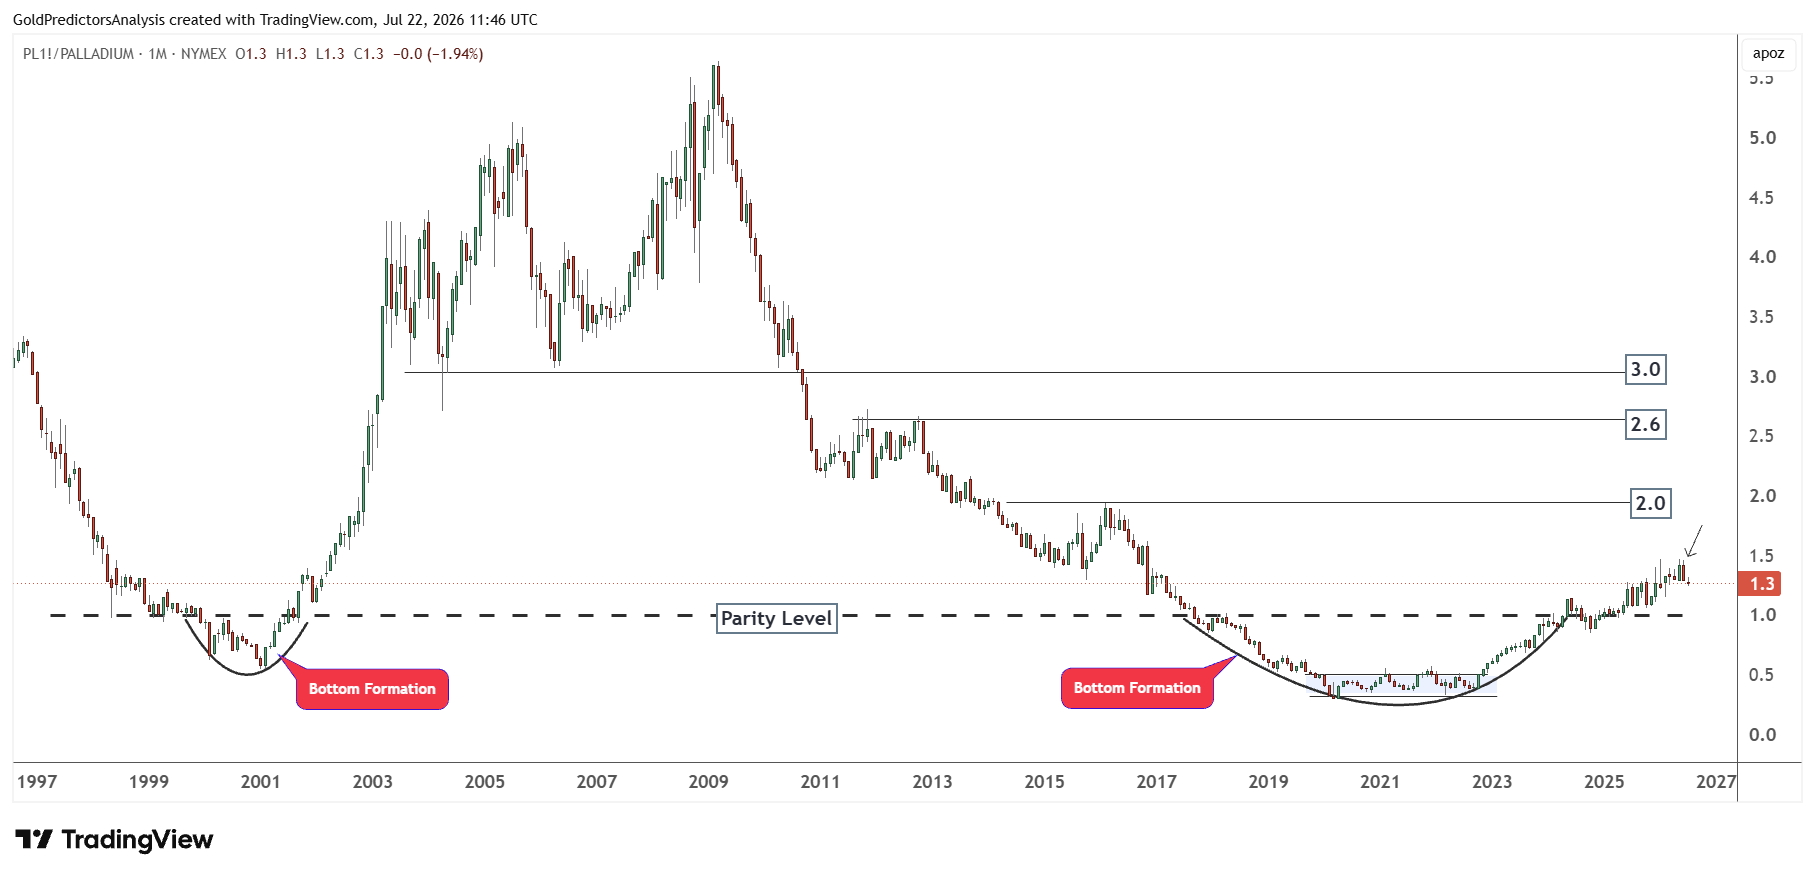
The platinum-to-palladium ratio shows that platinum is still outperforming the palladium market as the ratio remains above parity. The recent acceleration from the 2020 lows indicates that the ratio is likely to trade toward the 2.0 level. This indicates that the platinum market will likely remain stronger and the ratio will likely remain above parity in the short term. This also suggests that platinum will likely outperform the palladium market in the short term.
But the platinum-to-silver ratio shows a different picture. It shows that the silver (XAG) market has been outperforming since the 2006 highs. The formation of a wedge pattern and the subsequent breakdown below this wedge in December 2025 indicate strong negative pressure on the ratio. This indicates that silver prices will likely remain stronger in the short term and will likely push the ratio further downward.
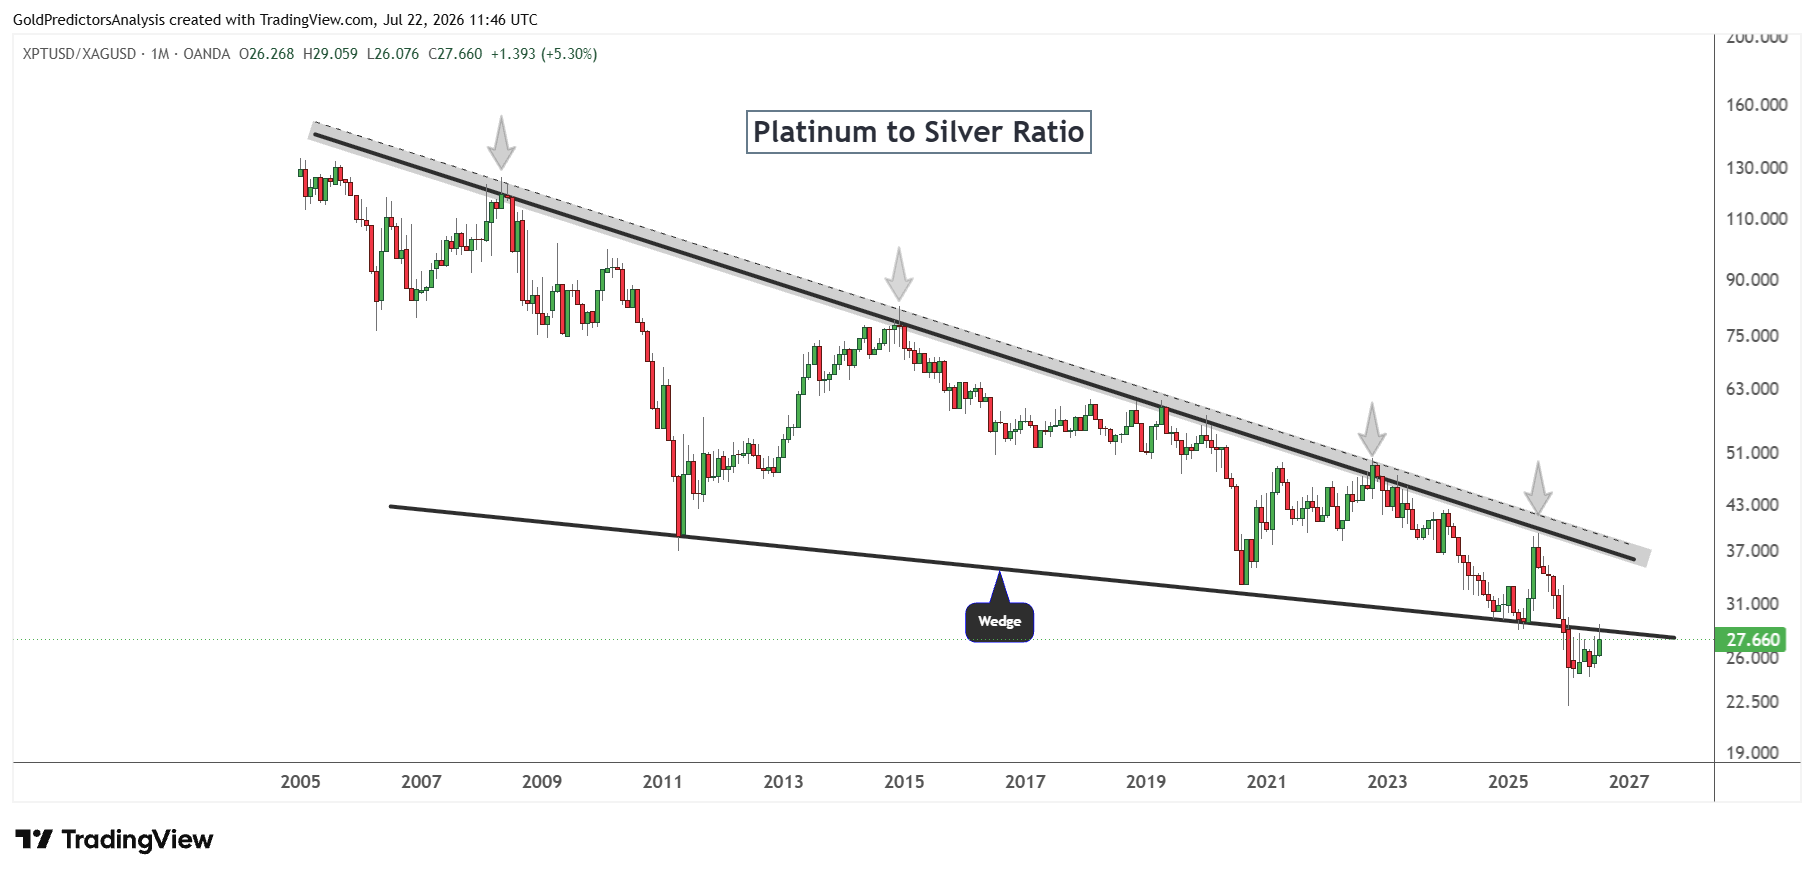
The ratio has been rebounding after producing a low of 22.215 in January 2026 and is approaching the resistance of the wedge pattern. This indicates that if the ratio fails to break above the 29.05 level, it will likely introduce another significant drop in the ratio. This drop would confirm the case for bottom in silver and increase the possibility of silver rally.
Platinum-to-Gold Ratio Remains in a Long-Term Downtrend
The platinum-to-gold ratio also shows price action similar to that of the platinum-to-silver ratio. The gold (XAU) market has been outperforming platinum since the 2006 highs as seen in the descending channel formation. Each time the ratio hits this descending channel, it has historically coincided with renewed strength in gold.
When the platinum-to-gold ratio produces a bottom, it has historically signalled improving momentum in the precious metals market and introduces another significant rally driven by platinum’s outperformance. For example, the lows formed in the ratio in March 2020 and April 2025 produced strong bottoms in the precious metals sector and introduced strong surges.
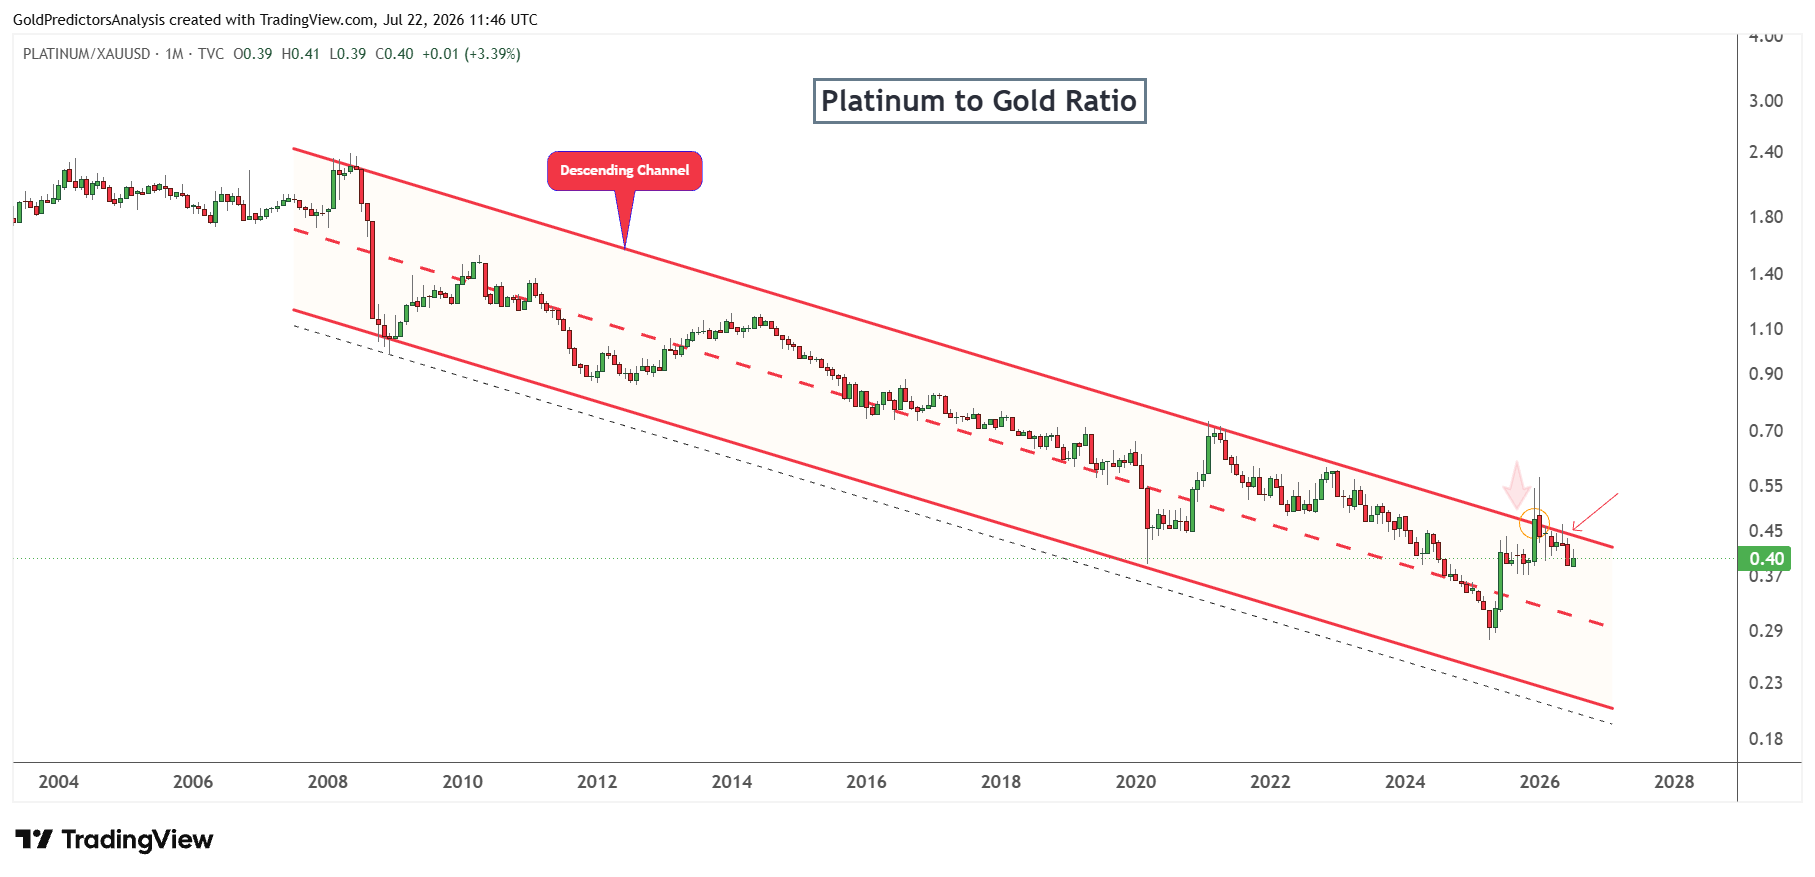
But when the ratio produced a peak at 0.57 in January 2026, the precious metals market produced a top and continued to drop. The recent price action during the past few months has remained under pressure near the resistance of the descending channel pattern.
There is still a big gap where the ratio can drop. This indicates that the ratio will likely drop further within this channel. It also indicates that the precious metals sector may continue to consolidate or trade lower before forming the durable bottom.
Bottom Line
Platinum and palladium remain at important technical levels after the latest rebound. Platinum must break above $1,700 to open the way toward $1,850 to $1,900. But a break below $1,550 would weaken the outlook and increase the risk of a drop toward $1,400. The palladium price fluctuates at the key resistance of $1,340. A failure to break above this level will increase the risk of a drop to the $1,200 and $1,100 levels.
The broader outlook remains mixed. Higher energy prices, interest rate uncertainty and the growth of electric vehicles may limit the recovery. Platinum may remain stronger than palladium because it has more diversified demand base. But the platinum ratios show that silver and gold still hold relative strength. The next clear move will likely depend on whether platinum and palladium can break their key resistance levels or lose the current support zones. The declining trend in the platinum to gold ratio suggests further weakness before the next significant rally.
Read more: Platinum Eyes $1,500 as Palladium Tests Key Support