


The market began to rotate toward unloved assets back in October and through to the end of February, including small caps like the Russell 2000. But war breaking out in the Middle East has eroded market breadth, squashing the small-cap rally. Now, small caps are approaching a technical line in the sand that could act as a hard resistance and thus a good buying opportunity for investors willing to wait out the uncertainty of the moment.
Macro Is Driving the Russell 2000
The iShares Russell 2000 ETF (IWM), which I use as a proxy for the Russell 2000 (although you could find the same technical levels if you trade index futures directly), has a good chance to close above $245 on the weekly candle, which would solidify its breakout above the four-year base. The trade is otherwise a textbook-looking breakout-retest setup, but it must hold the line, or else it will end as a failed breakout and is likely headed lower.
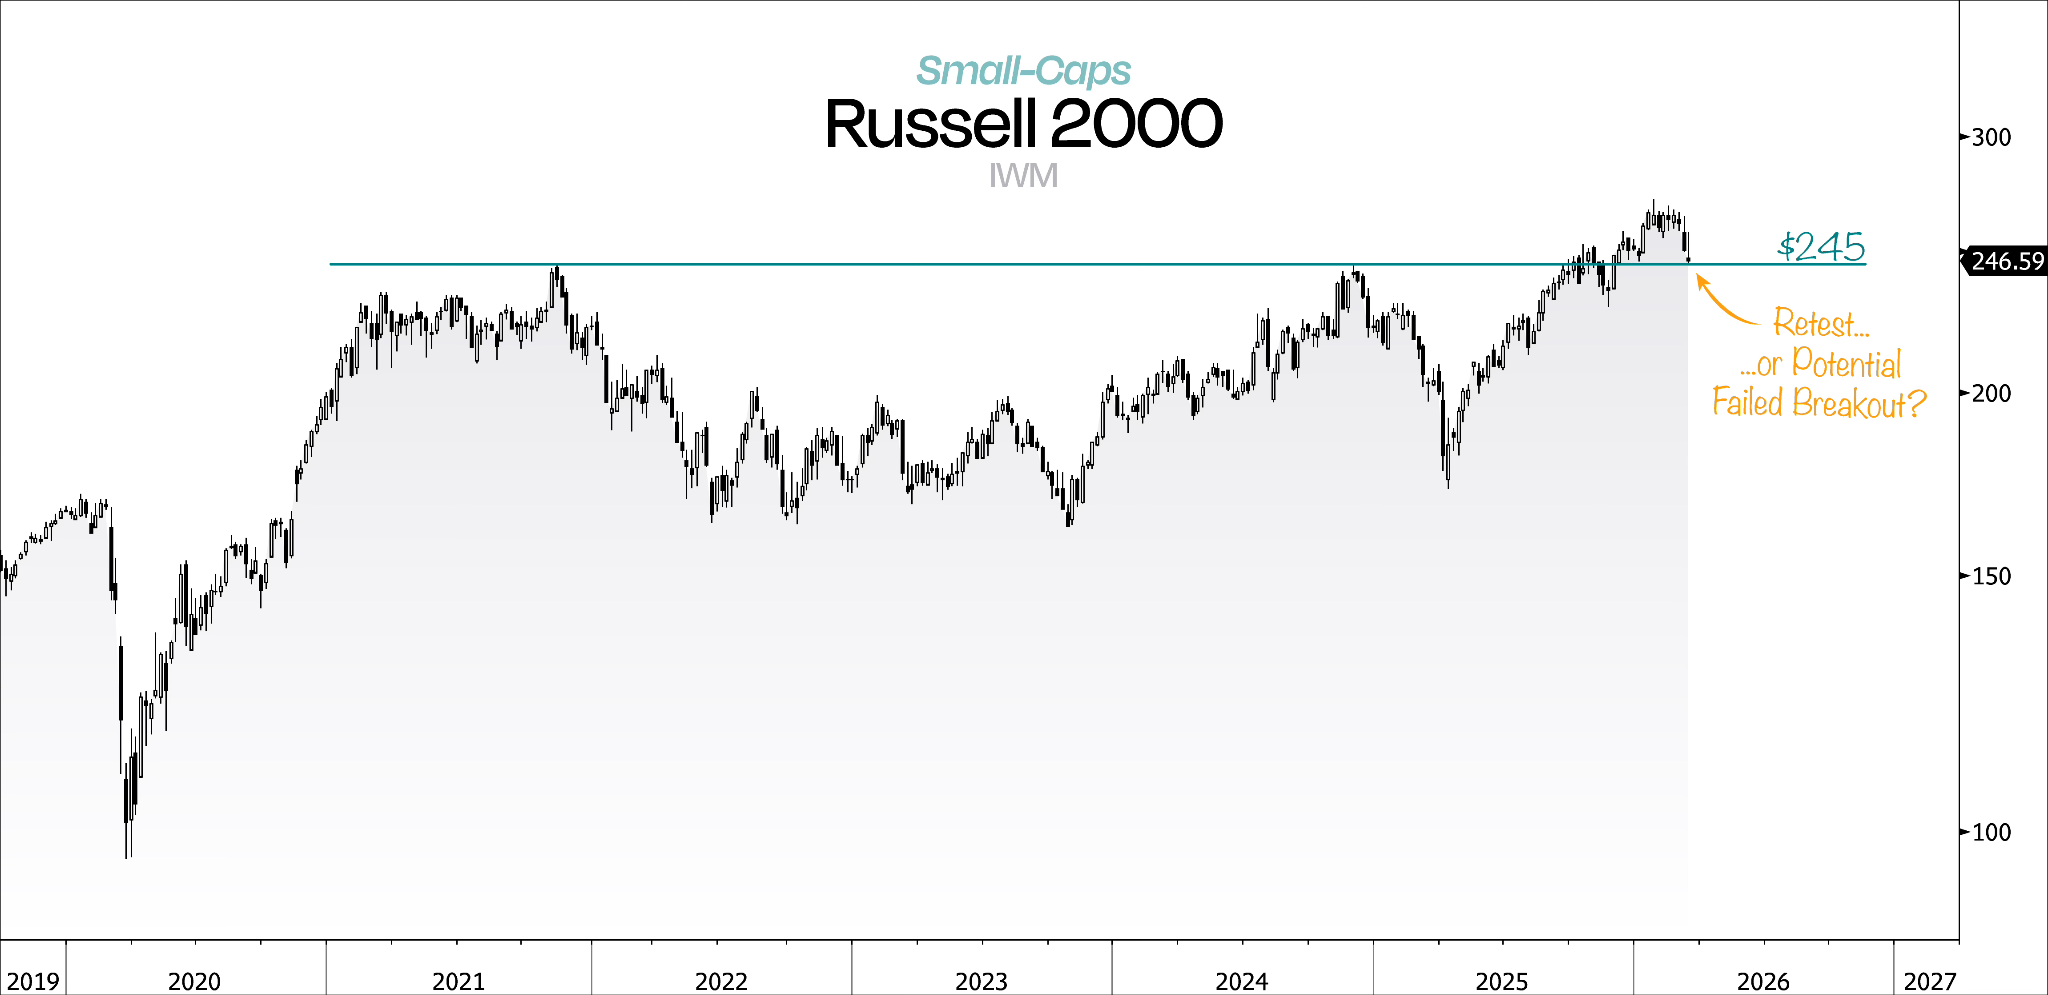
The problem, apart from now being at the technical buzzer beater for their breakout, is that any news about the worsening of the U.S.-Iran War or the further hiking of oil prices is likely to send the R2000 lower. Macro fundamentals trump technicals in markets; the best-looking patterns in the world fall apart when global peace falters. There is little these firms could do to get out of the way of a pending global energy crisis that has seen the IEA release its stockpiles all around the world.
Risk assets like the R2000 are immensely exposed to the pressures of liquidity and the real economy. These firms are more sensitive to economic shocks like a sudden energy crisis, and so it squares that they’ve been bleeding since the conflict began at the beginning of the month. But that is also what is likely to drive them lower and force the failure of the breakout. Increasingly, without speculating on geopolitics or military matters, it appears as though there is no simple end to the U.S.-Iran War. Couple that with the Fed’s shift to tighter conditions for longer following their March 18 meeting, and you have a recipe for small caps to see significant continued weakness.
But it’s times like this when it feels that way that markets surprise us. They are forward-looking and do not dwell on yesterday’s news. All of what I’ve said so far is already priced in. Let’s now look ahead.
Russell 2000 Technical Outlook
While the long-term line in the sand may or may not hold based on Friday’s close, a single weekly candle crossing below the line won’t fully break the pattern. Let’s zoom in on the nearer term to see where we could expect actual invalidation to come from should this trend get worse and macro continues to drive the R2000 lower.
The 1-year chart for IWM tells a clear story: trend shift. Prior to the death cross on March 3rd (the 50 EMA crossed under the 200 EMA), the trend was higher highs and higher lows, with structurally higher moving averages throughout the year.
But prices are now cleanly below both moving averages, and the difference between the short and long averages is accelerating. The two lines are forming widening jaws (to take a bite out of long positions), which is bearish when the long side is on top. The more technical term for that image is “early-stage trend deterioration.”
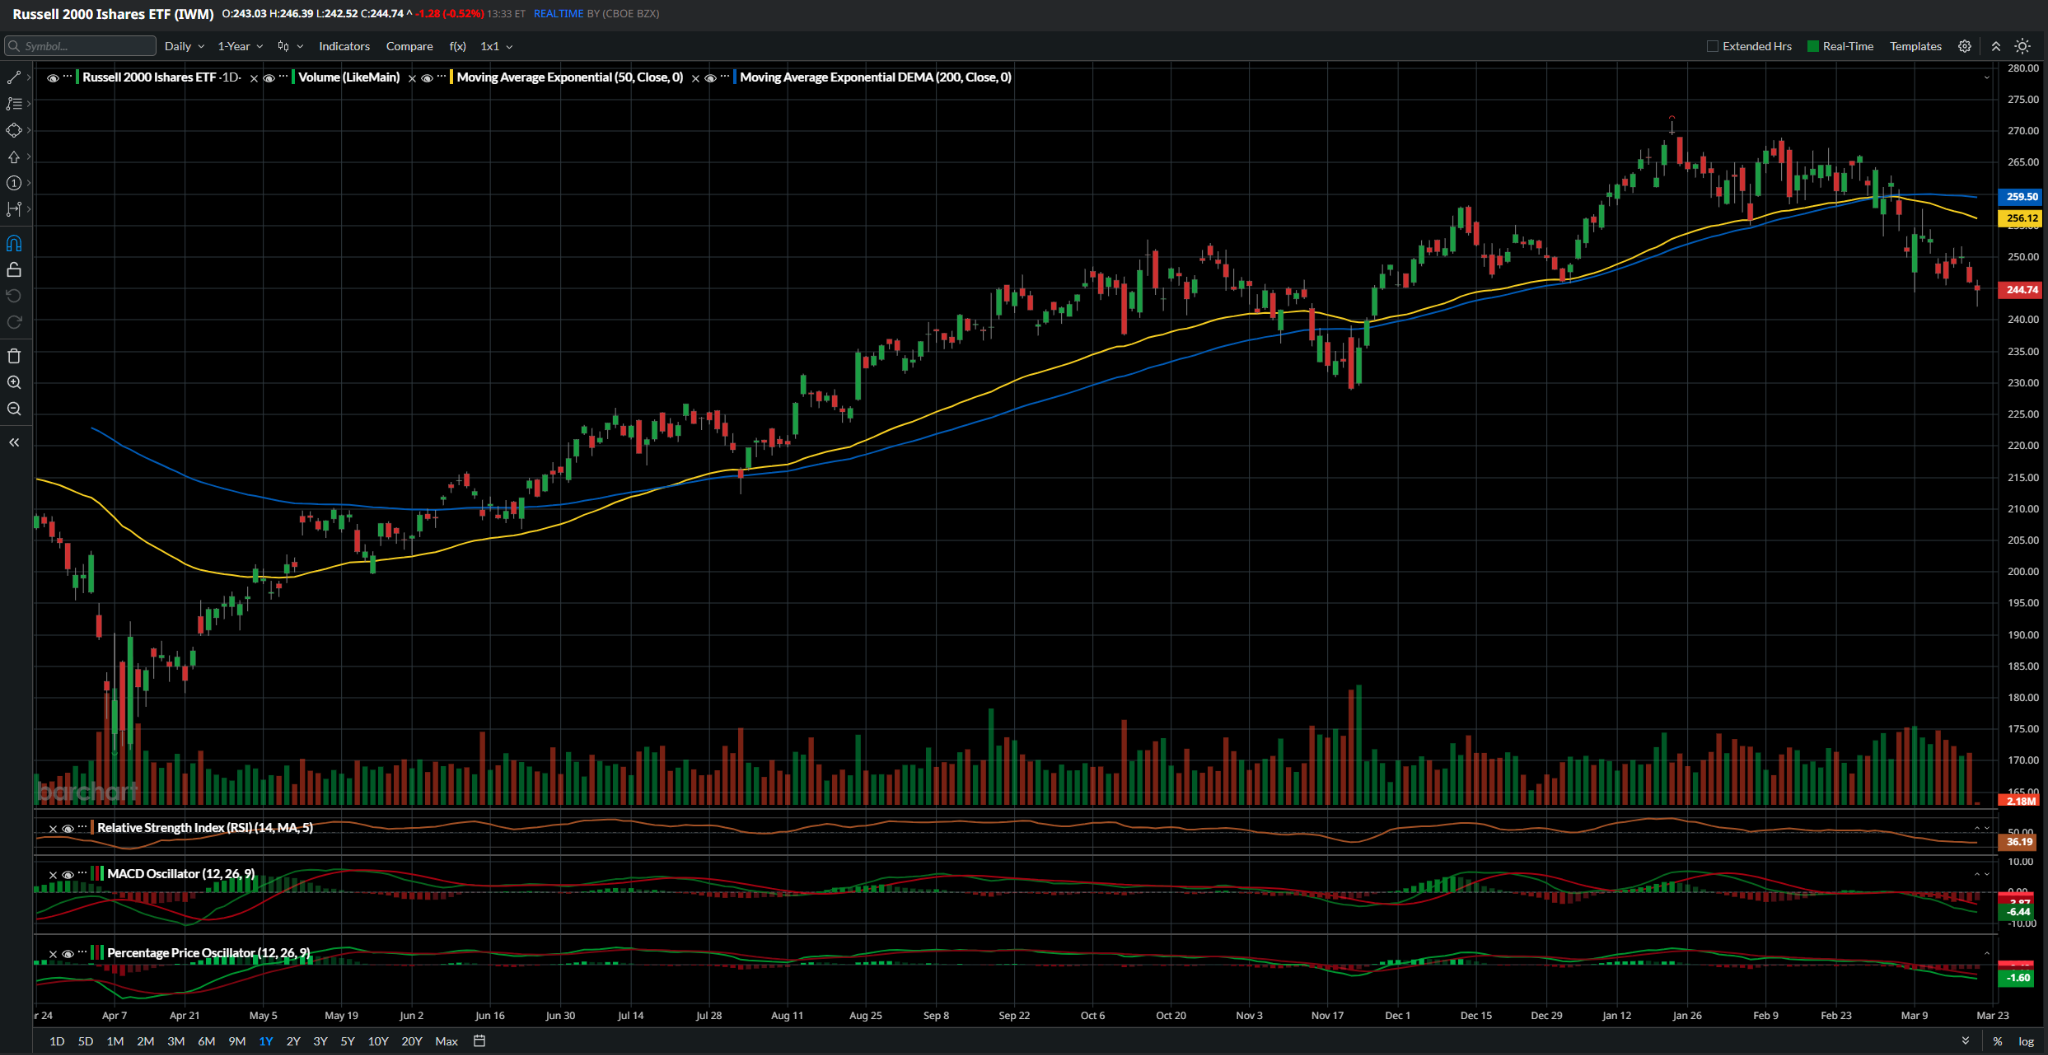
Small caps are not oversold yet but close to it (RSI ~36), and momentum is not only bleak but increasingly bearish (MACD in a bearish crossover). The failure to hold both the 50 and 200 EMAs during this sell-off tells us that institutions are not defending those levels anymore and are willing to accept the discount because the risk environment has structurally changed.
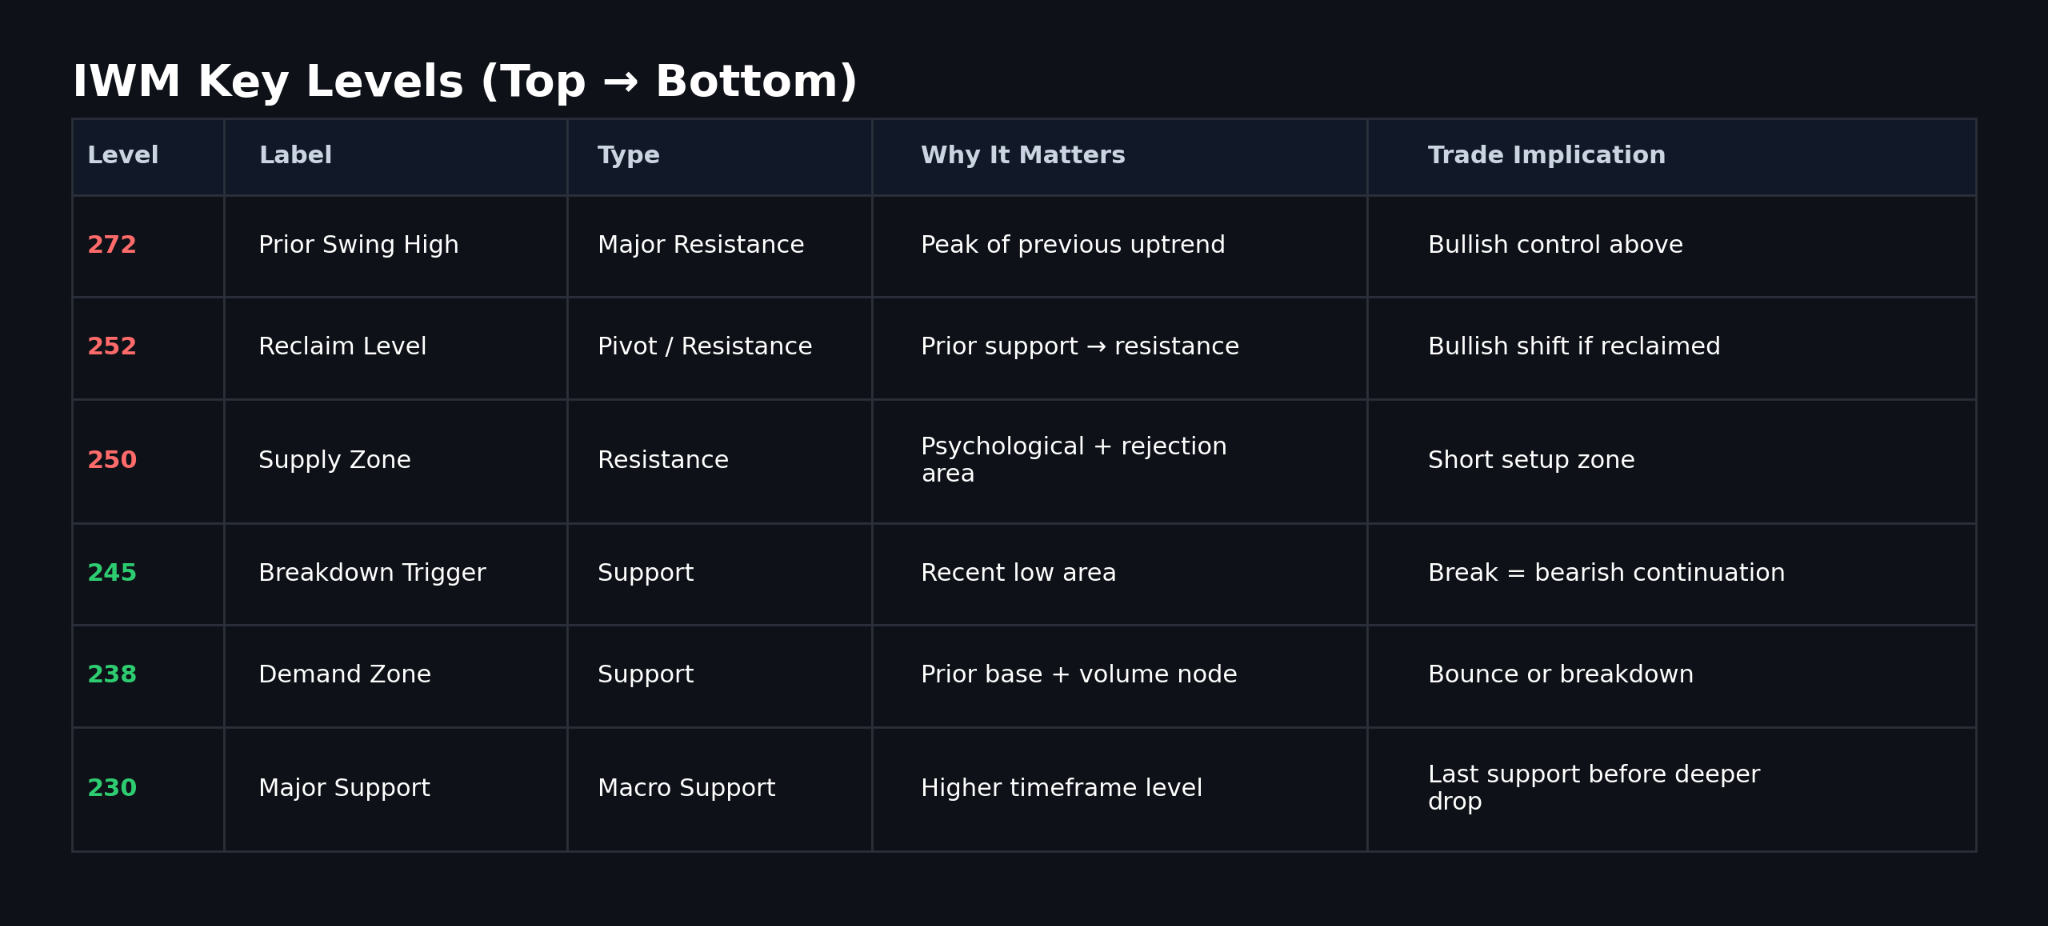
Looking forward, we should expect any reversal of fortunes (which I would expect to be driven by changes in the macro situation with energy, in whatever form that comes) to necessarily break the 250-252 zone. This would reclaim its old level and flip the old resistance to a support.
A bullish continuation will trigger if the daily close comes back above 252 while maintaining similar volume to past rallies, >30M+ daily average volume.
That may be jumping the gun, because most investors are likely more concerned about where the new support is if we break the key 245 level. If we break down this week and end below that, I don’t see a floor until 238, a prior consolidation base, and while that may act as a support as it has before, it may just as easily flip to a new resistance should momentum carry the Russell even lower.
Below that, major support is at 230, which is where I would expect the significant buying pressure—the same we saw in November 2025 that came with back-to-back >90M+ volume days, although that would be nearly 10% below current levels.
Trade Framework
For my purposes, I am using the iShares Russell 2000 ETF (IWM) since it is the most liquid instrument for me, but you could map these levels to any similar instrument based on the Russell 2000, like index futures or differently priced funds.
If 245—the aforementioned line in the sand—holds on the weekly candle, and we see a bullish continuation follow, it will need to reclaim 250 to prove the breakout is real.
On the long side, should we see a bullish continuation above 245, I would consider taking an entry at 250-255 with full confidence after IWM reclaims 252. The profit target is between 260 and 270—272 was the former high and will act as resistance.
On the short side, IWM will have to break below 245 and down toward 240. I would consider taking an entry at 244 with full confidence after it falls below 238. The profit target is between 235 and 230, with 230 being a level I would expect other shorts to close at.
Conclusion
The Russell 2000 was expanding alongside market breadth, but now it’s caught outside that vacuum by macro pressures like a looming energy crisis and higher-for-longer liquidity tightness. What looked like a clean breakout is now being tested, and we’ve hit the line in the sand for upholding a breakout that was four years in the making.
I think patience is the right posture to take, and my technical outlook for the near term is that both bulls and bears stand a chance but must be aware of the key levels to trade. The setup is tenuous, and taking a position before the price confirms it could lead to a quick reversal and steep losses.
If IWM, my preferred vehicle to trade the Russell 2000, can reclaim 250-252 and hold it, then the bullish case is back on the table, and this shakeout will have been just that. But if 245 gives way and price cannot stabilize at 238, then this becomes less a retest and more a failed breakout with real downside risk toward 230.
Until energy markets calm down and sustained, positive price action starts repairing the technical damage, the burden of proof is on the bulls. They will need to not only take those key levels but do so with conviction (volume). Otherwise, all signs point to uncertainty increasing and the R2000 heading lower.