


Silver (XAG) has rebounded strongly in August, but the market remains uncertain after the sharp correction from the January peak. The growing investment in AI data centers, energy storage and power infrastructure creates a new source of industrial demand. A persistent supply deficit and stronger investment demand also support the long term outlook. The technical structure now depends on the $45-$55 support zone and potential breakout above $72.
AI Data Centers and Energy Storage Strengthen Silver Demand
The rise of AI and energy storage is new silver industrial driver. SMA Solar reported that they had a backlog of orders, which rose 50% year-on-year to €1.75 billion by the end of June. The company attributed the increase to the energy storage system and the growing electricity consumption of AI applications and data centers. Its household and business segment sales also grew by approximately 25% with an improving rooftop solar demand.
This trend can help silver as it involves large electrical networks such as data centers and renewable energy systems. Silver is used in electrical contacts, circuit boards, power controls and solar cells as it conducts electricity efficiently. But the increase in SMA Solar’s backlog does not necessarily result in a same increase in silver usage. It just demonstrates that investment in technology that consumes a lot of power remains solid.
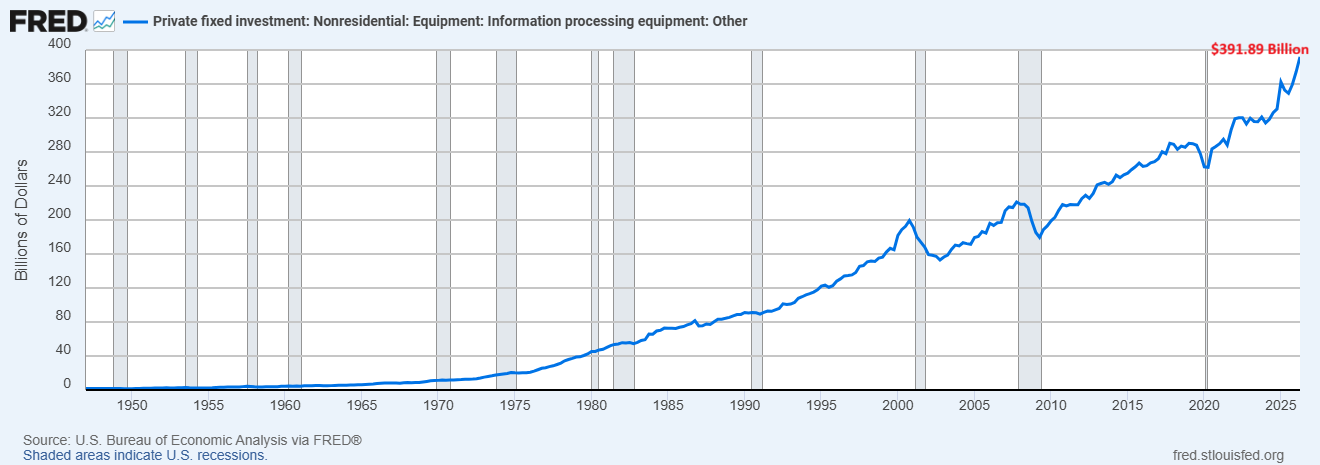
The overall tech trend is supported by U.S. investment data. The private investment in other information processing equipment increased to an annualized $391.9 billion in Q2 2026 from $352.7 billion a year earlier.
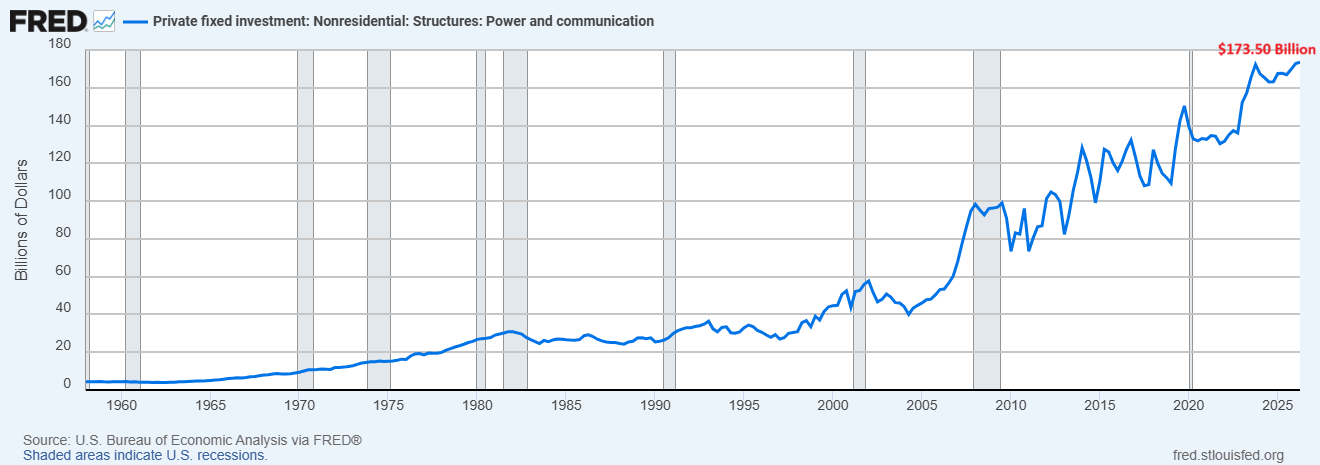
There was also a rise in power and communication structures with investment amounting to $173.5 billion compared with $167.6 billion in 2025. This indicates that the spending on digital equipment and power infrastructure continues to grow.
The Silver Institute also forecast a rise in silver demand from data centers, AI technologies and automobiles that will drive up its use in a number of industrial applications. This demand may be able to counterbalance the weakness in the solar industry. The benefit will likely develop as new projects move from planning to construction. This means that the AI boom will likely support the long term outlook for silver.
Silver Price Forecast
Every new Silver analysis as it publishes, today's technical signal and key levels, live price — on one page.
See all Silver forecastsSilver Supply Deficit Supports Prices Despite Weaker Industrial Demand
The physical silver market is still structurally short. The latest World Silver Survey expects the deficit to widen to 46.3 million ounces in 2026 up from 40.3 million ounces in 2025. There have been an estimated 762 million ounces removed from global inventories since 2021. The total supply this year is projected to be 2% lower than the supply last year. The market continues to consume more silver than it produces. These conditions provide fundamental support to silver price.
But not all the prospects on the demand side look good. Industrial fabrication is forecast to fall 3% to around 640 million ounces. This is the lowest level in four years. The solar manufacturers are also cutting down on the use of silver per solar panel and considering alternatives. The coin and bar demand will increase by 18% to 258 million ounces which is driven by the recovery in U.S. coin demand. Thus, the investment demand is supporting the weaker demand from the industry.
The uncertainty also comes from India. The country restricted the majority of silver imports in May. The country further tightened the regulations in the month of June. The imports fell to 46.8 metric tons in May from 534.3 metric tons in the previous year. The restrictions resulted in local shortages and premiums of about $6.50 per ounce in early July. It is positive for domestically premium but fewer Indian imports could lead to lower demand in the international market.
The near term outlook for silver is mixed. The spot silver price is currently trading at $64.68 and has risen over 12% in August. The ongoing supply deficit may help to keep losses contained but better liquidity and weaker solar demand could help to slow the next rally.
Silver Price Forecast: A Break Above $72 Could Open the Way to $100
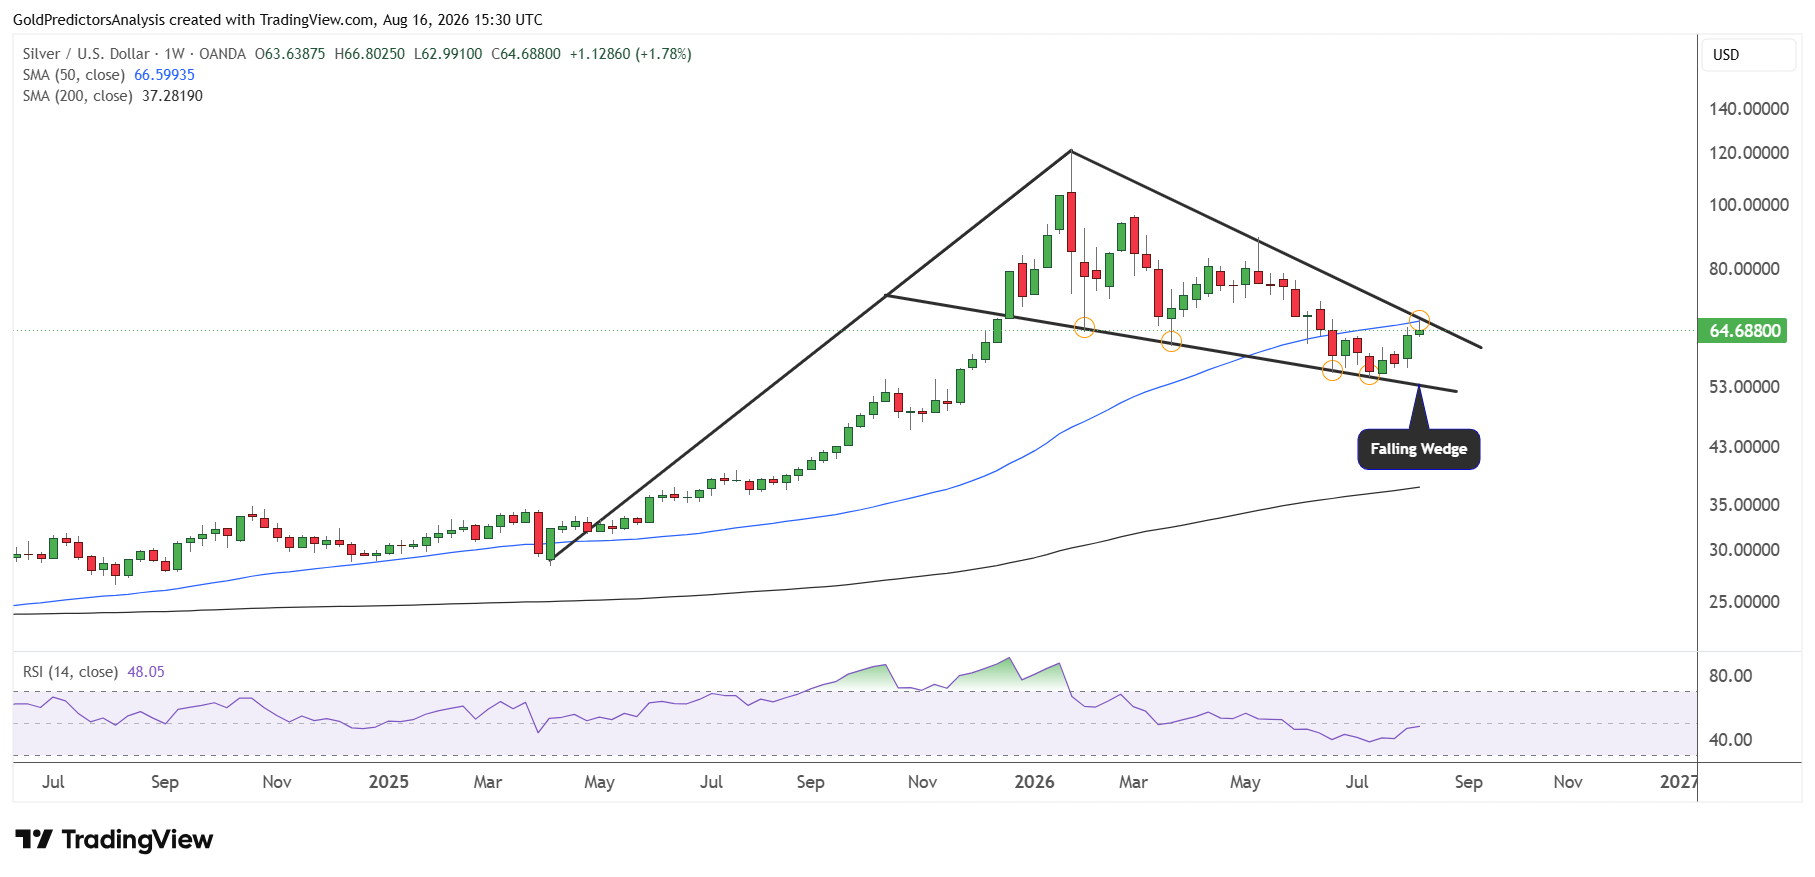
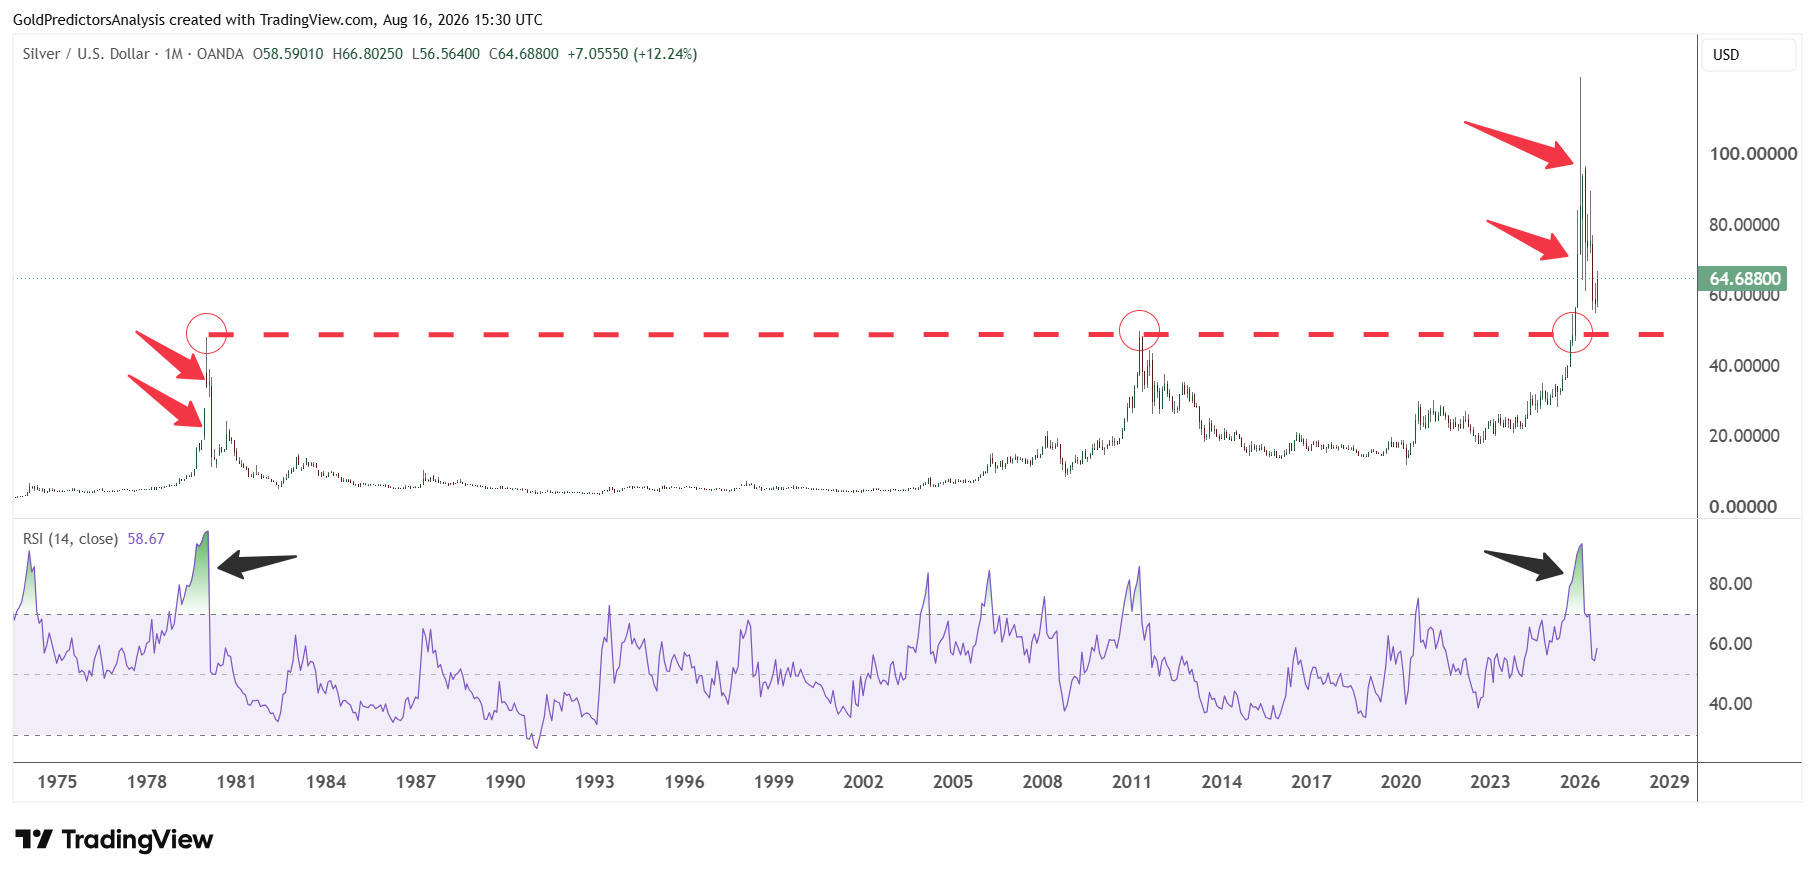
From a technical perspective, the spot silver price hit the $50 support zone in 2026, which is a retest of the breakout area that was triggered in 2025. This $50 pivotal area is marked by the neckline of cup and handle pattern as seen in the chart below. It stretches from the 1980 high and runs through the 2011 peak.
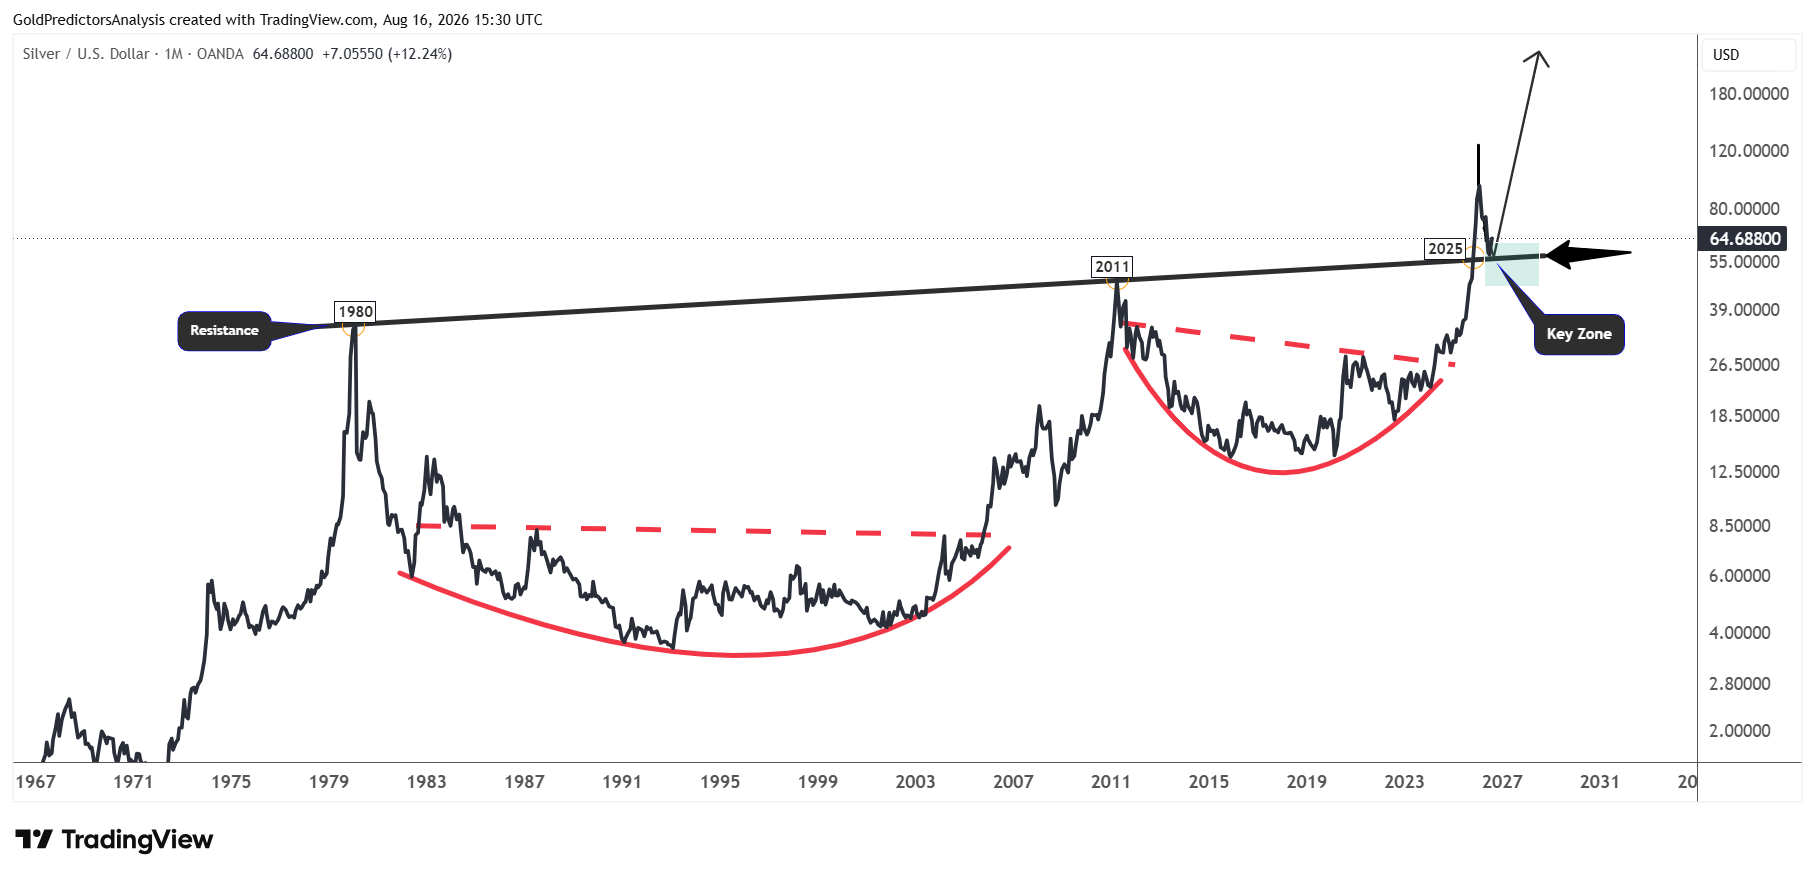
This cup and handle pattern formed over the past 40 years and broke significantly in 2025. Therefore, silver prices may remain in bullish mode as long as this neckline support holds. This neckline has a support band between the $45 and $55 areas. As long as this support zone holds, the next move in the silver market will likely be toward the $200 region.
The constructive bullish price action is also observed through the falling wedge pattern. This wedge pattern can also form a potential bull flag pattern. The flag pole can be stretched from the April 2025 lows toward the January 2026 highs. The consolidation from January 2026 to August 2026 has formed a falling wedge structure. Therefore, a break above $72 this time will likely indicate strong move in silver prices toward the $100 area. A break above $100 will likely open the door for a strong surge toward the $200 region.
On the other hand, a break below the $55 support will likely open the door for a drop toward the $45 support region. One thing to note is that the RSI still remains below the midline. It is interesting to note that when the RSI approaches the midline on the weekly chart, the silver price approaches the breakout area of the $72 region. Therefore, a break above $72 will likely push the RSI above the midline and keep the rally in silver prices.
Silver-to-Gold Ratio Signals a Potential Silver Recovery
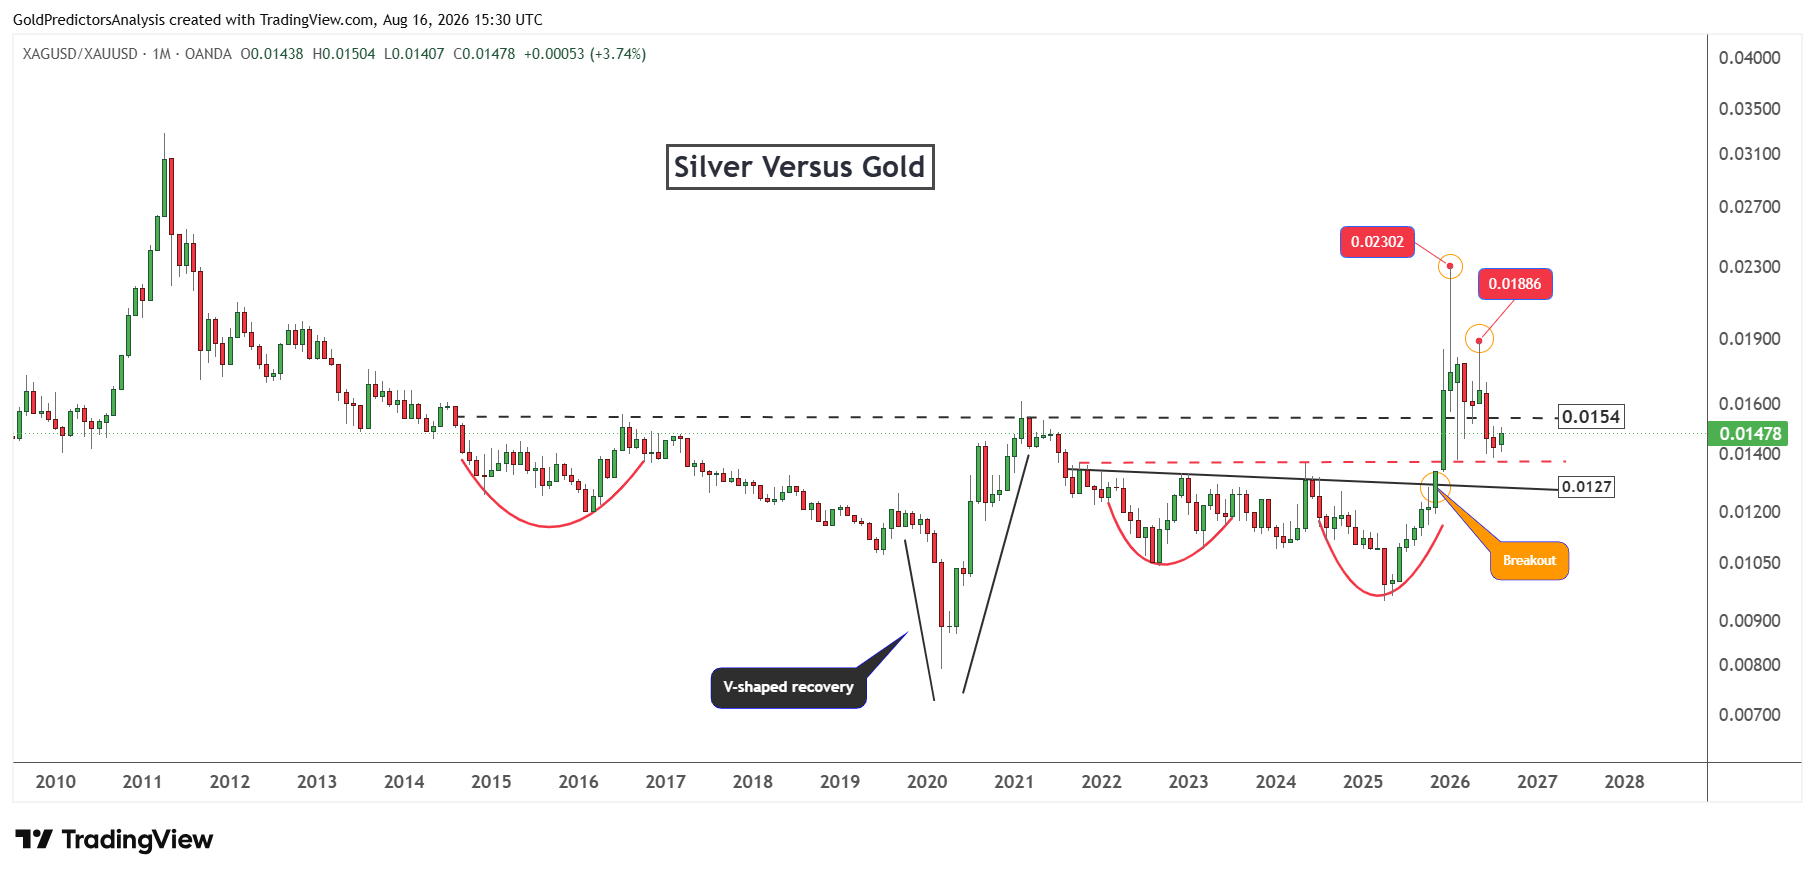
The silver to gold ratio shows that it produced a peak at 0.02302 in January 2026, when silver and gold prices marked a record high. After producing this peak, the ratio consolidated and dropped toward 0.0137, which is the key support zone.
The ratio is now rebounding from this support zone in August but it still remains weak. As long as the 0.0127 level holds in the ratio, the long term outlook for silver prices will remain bullish. If the ratio corrects further toward the support zone, it will likely offer a strong opportunity for long term investors during the next drop.
For silver to start leading the gold market again, the ratio must confirm a bottom. It requires a monthly close above 0.0154 to confirm a bottom in the ratio and start the next rally in precious metals.
Silver Price Risks: 1980 Pattern Warns of a Slower Recovery
Despite the strong peak in silver at $120, one risk in the silver market comes from the similarity to the pattern in 1980. In 1980, the RSI reached a similar level to the one it reached in 2026. After hitting the peaks, prices dropped in a similar fashion to the decline in the 1980s.
But after the 1980s, prices consolidated within broad range for the next few years. The conditions are now different as demand from AI data centers has increased, which will likely support prices over the next few years.
A break above $100 is required to open the door for the next strong rally in the silver market. But silver may need some time to build enough strength to break higher after dropping over 50% in 2026.
Bottom Line
Silver retains a positive long term outlook, but near term conditions remain mixed. AI data centers, energy storage systems and expanding power infrastructure should support industrial use. Strong bar and coin buying also supports demand. But the solar manufacturers are using less silver per panel and industrial fabrication may decline in 2026. The persistent supply deficit should limit deeper losses, but silver may need more time to recover from the sharp correction.
The $45-$55 area remains the key long term support zone. As long as the silver price holds this support, the cup and handle breakout will remain intact. A weekly break above $72 would confirm the falling wedge breakout and open the way toward $100. A break above $100 could push silver toward $200. But a drop below $55 would indicate deeper correction to $45. A monthly close above the 0.0154 level in the silver to gold ratio would provide further confirmation of renewed strength.