
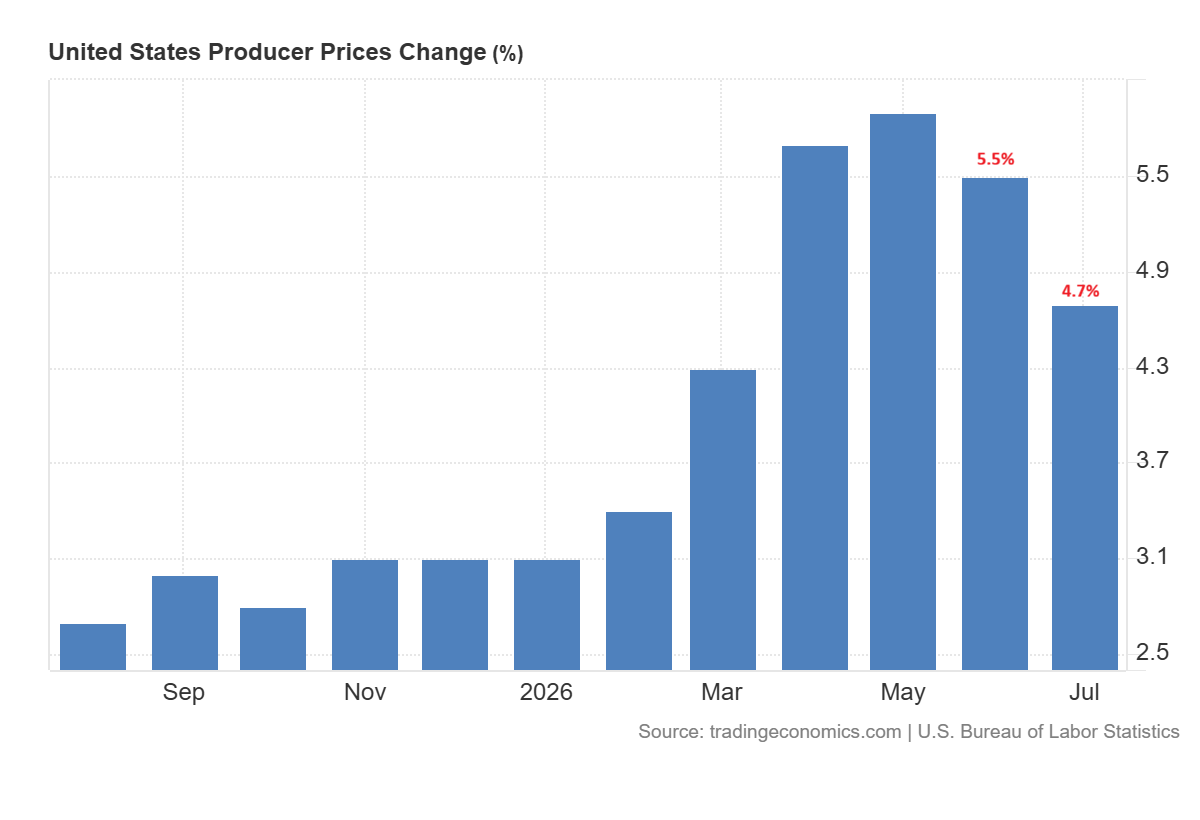
Producer inflation in the U.S. eased in July and reduced the pressure on the Fed to hike rates. The headline PPI eased to 4.7% from 5.5% while core PPI slowed to 4.2% from 4.7%.
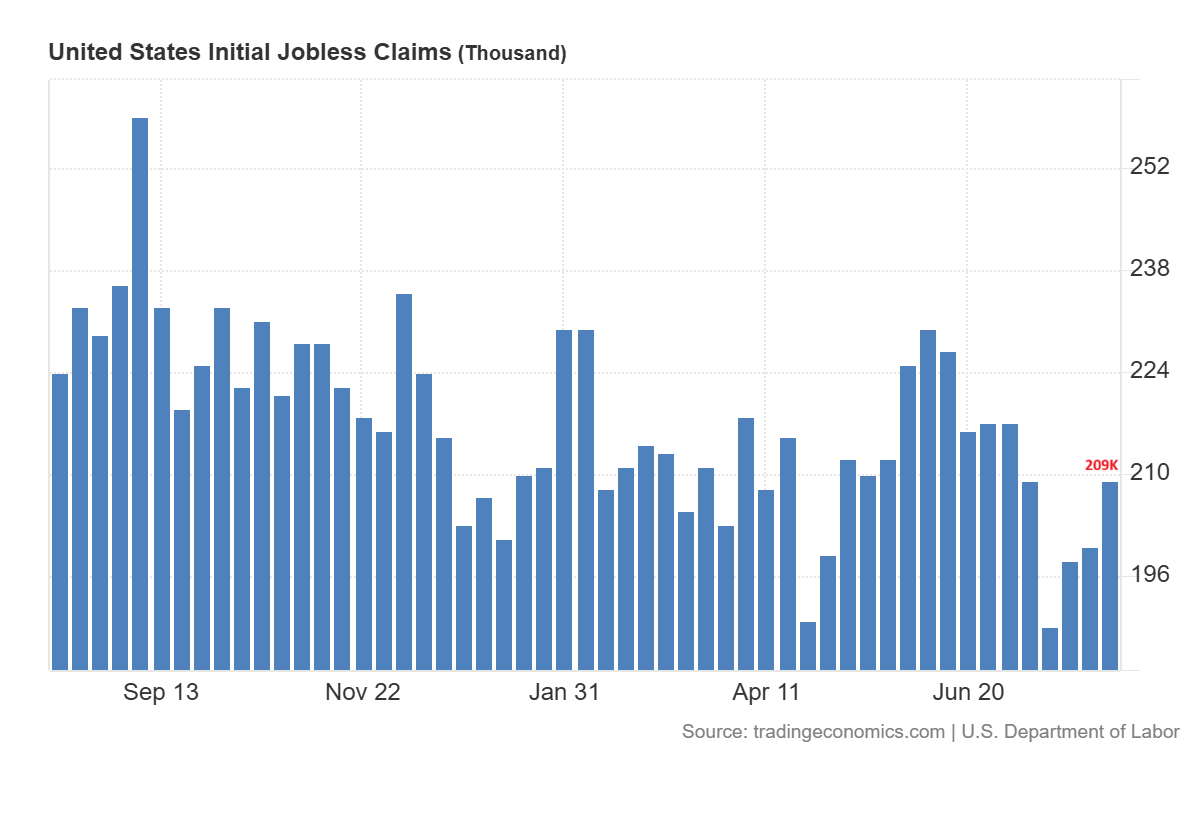
Moreover, the initial jobless claims also rose to 209,000 from 200,000. These numbers indicate that inflation is cooling and the labor market is losing strength. This mix reduced the rate hike concerns and pushed Treasury yields down. The decline in US Treasury yields further increased positive momentum in gold.
But gold dropped to $4,320 onFriday from a new high of $4,449 on Thursday. Despite the weaker economic data, the rebound in U.S. dollar limits the demand for the metal. This is a sign that traders are still cautious as inflation remains elevated and the Federal Reserve officials remain divided. The next move in gold could be dictated by retail sales and consumer sentiment data on Friday.
Gold Price Targets $5,000 Above $4,500
The gold price failed to break above $4,500 at the 200-day SMA and closed lower on Thursday at $4,351. The negative daily candle for Thursday indicates that short term momentum in the gold price is weakening. The price may look for the short term support to break the $4,500.
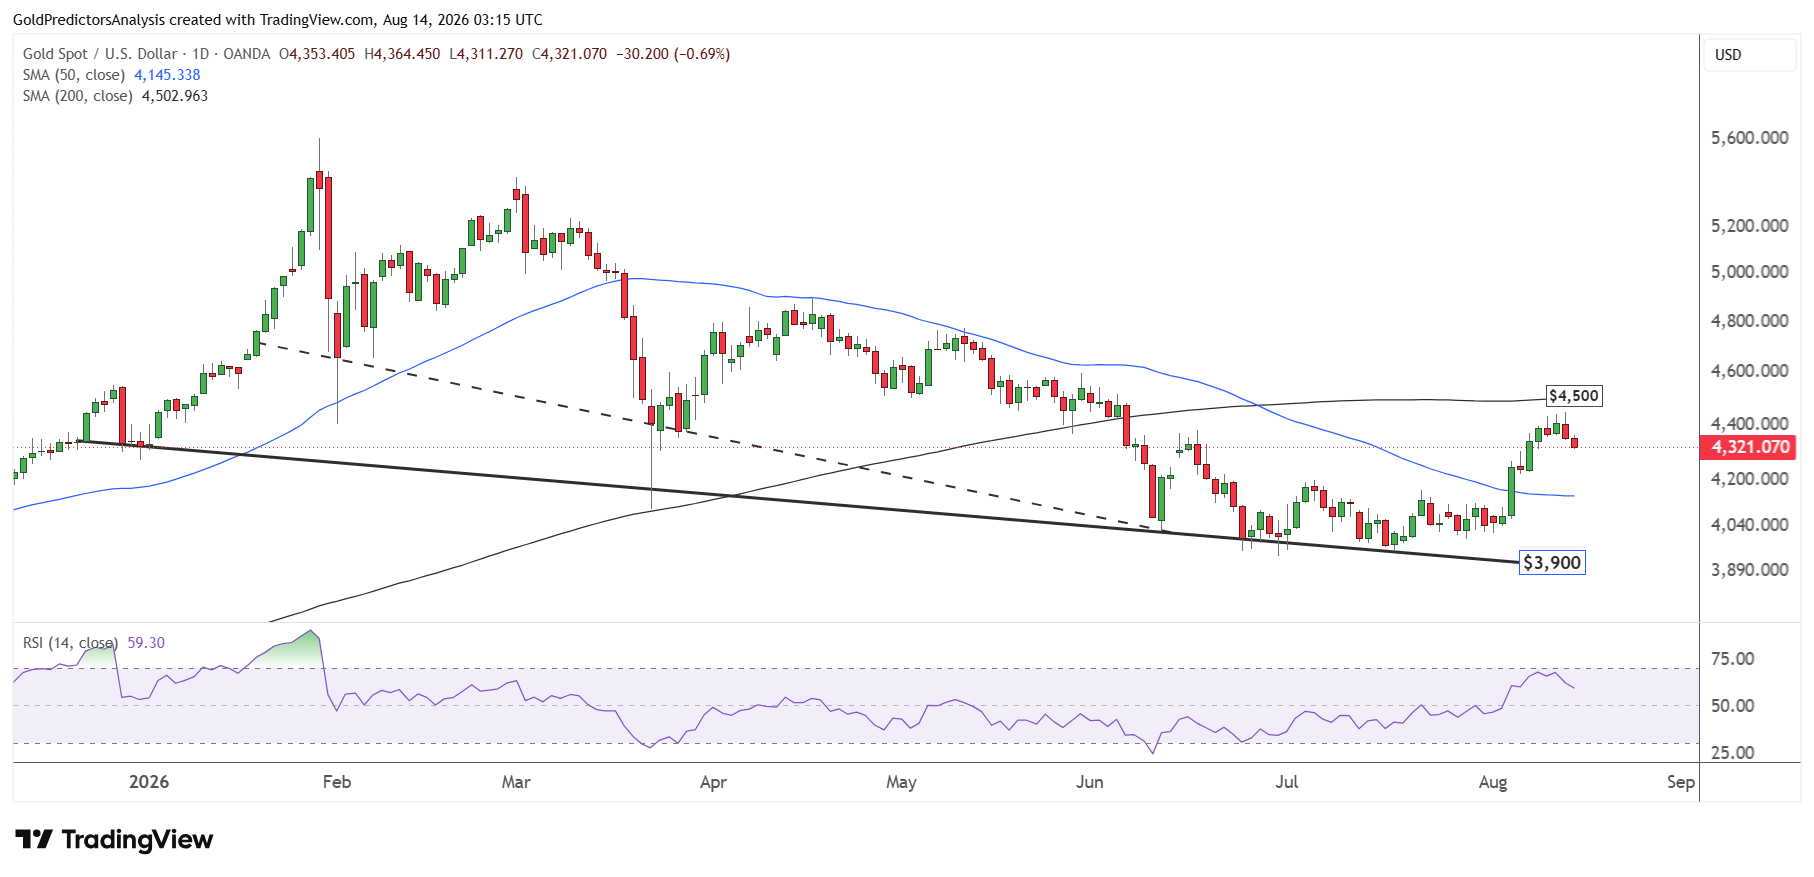
The important support for gold remains at the $4,150-$4,200 zone, which is defined by the 50-day SMA. A break below $4,150 will push the price towards the $3,900 level. However, a break above $4,500 will open the door for a strong rally towards the $5,000 area.
The RSI indicator has started to ease from the 67 level, which indicates that the price may consolidate to find the short term support. The overall structure created by the rebound from $3,900 remains constructive. If the $4,150-$4,200 area holds, then the possibility of upside breakout in gold will increase. The importance of the current support is visible on the weekly chart, which shows that the rebound started from the strong support of the ascending trendline at the $3,900 level.
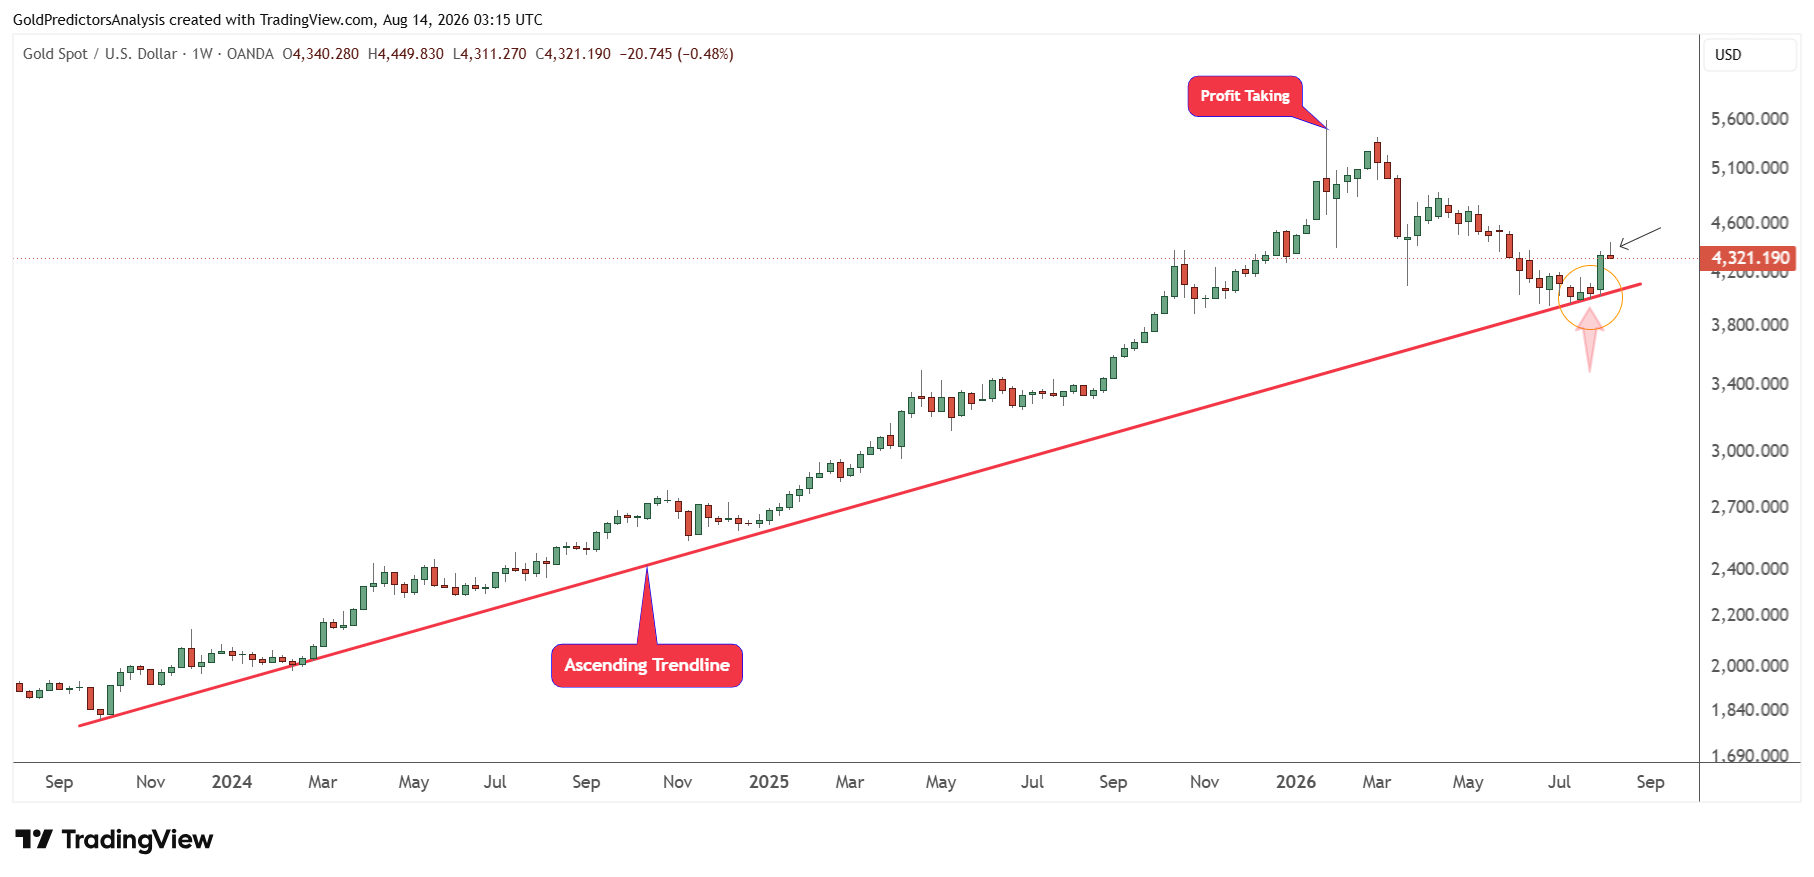
However, the weekly candle today is important. A close below $4,200 this week will likely create further consolidation in the short term. On the other hand, a break above $4,500 this week will likely trigger a strong rally towards $5,000 next week.
Gold Price Forecast
Every new Gold analysis as it publishes, today's technical signal and key levels, live price — on one page.
See all Gold forecastsSilver Price Targets $90 Above $72
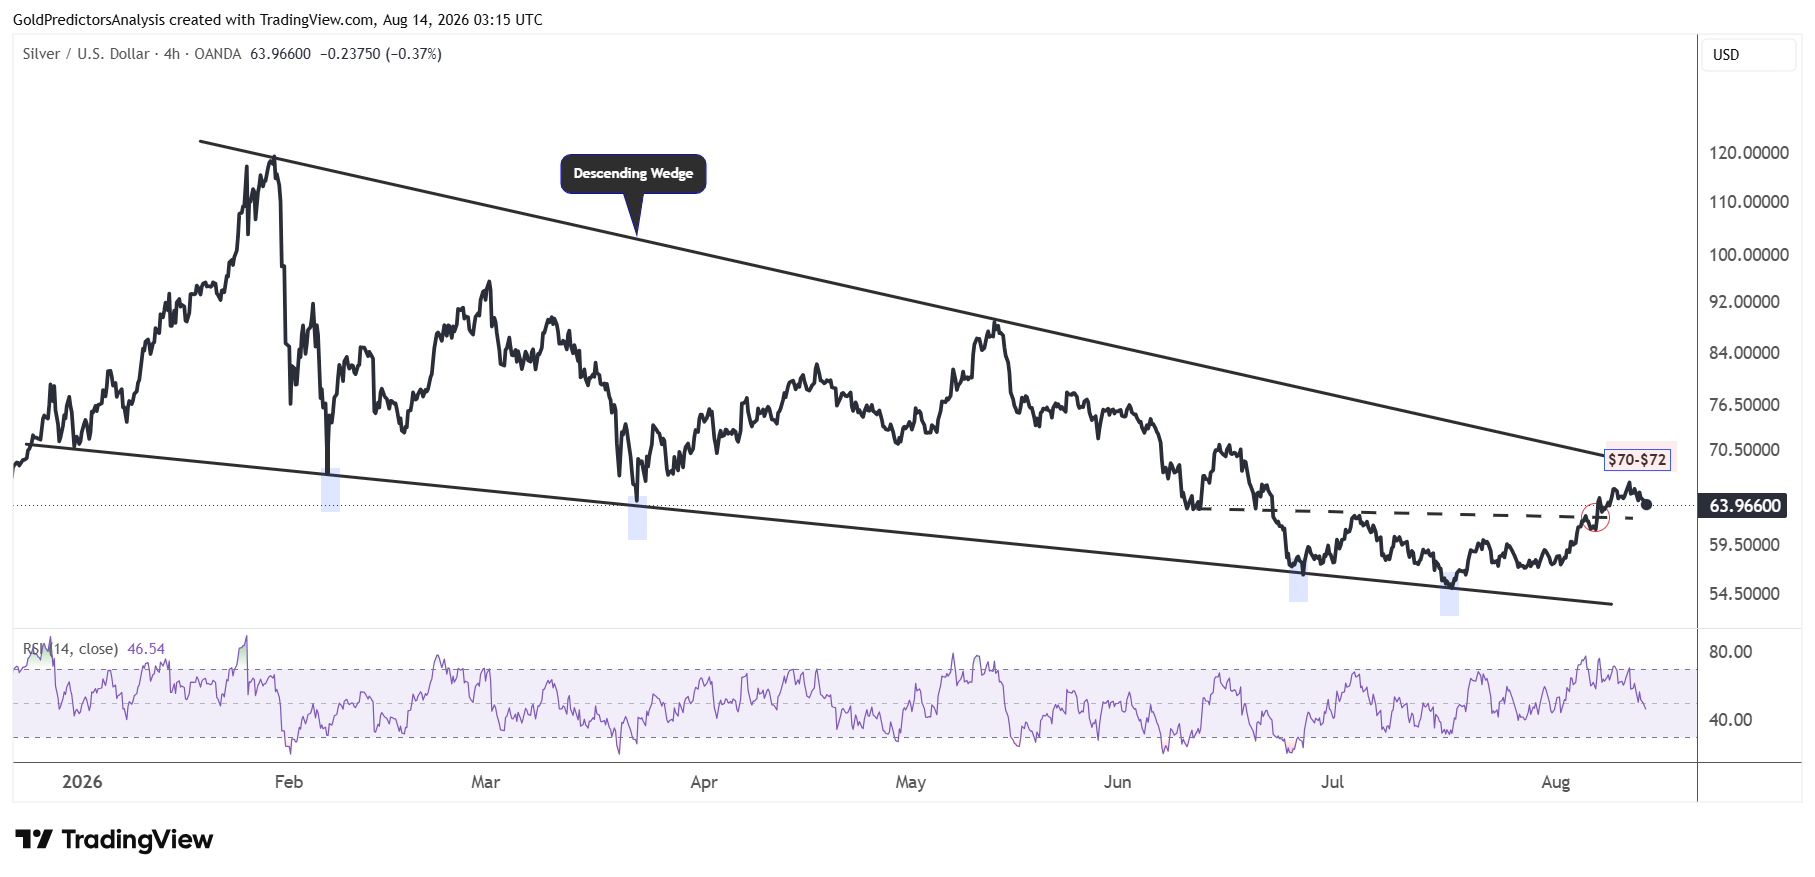
The 4-hour chart for spot silver also shows that the spot silver price remains below the $72 level, which increases the possibility of further consolidation before the next strong rally. A break above $72 is required to push the spot silver price towards the $90 level.
However, if the price breaks below the $60 support, then the possibility of another drop towards the $55 area will increase.
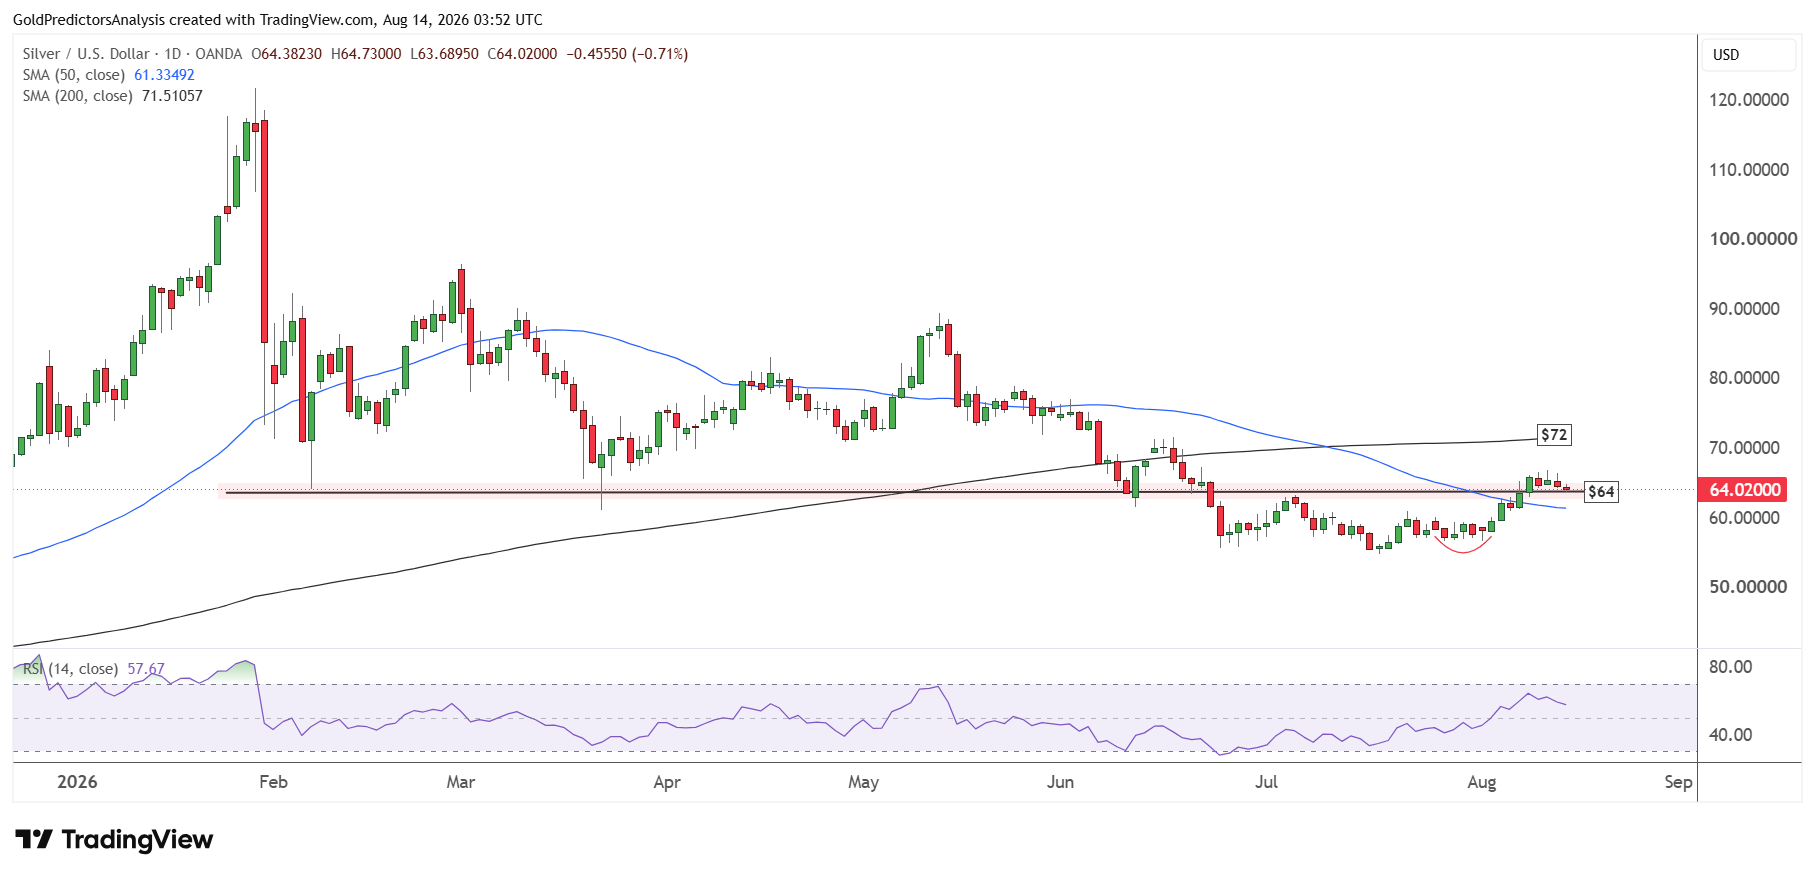
The daily chart for silver also shows that the price has recovered above the $64 level, but the price must break the 200-day SMA at $72 to continue the rally.
Bottom Line
The gold outlook remains constructive. The softer producer inflation and higher jobless claims reduced rate hike concerns. They also pushed Treasury yields lower. This supports the gold outlook. But the rebound in US dollar and the failure to break $4,500 triggered a correction. The price is looking to find a short term support and build pressure to break the $4,500. As long as the $4,150 holds, the possibility for an upside breakout is high. But a break below $4,150 may push the gold price to $4,000. On the other hand, the silver price must break above $72 to open the door for a rally towards the $90 level.
Read more: Cooling US Inflation Sets the Stage for a Break Above $5,000