


US 10-Year Yield Technical Analysis
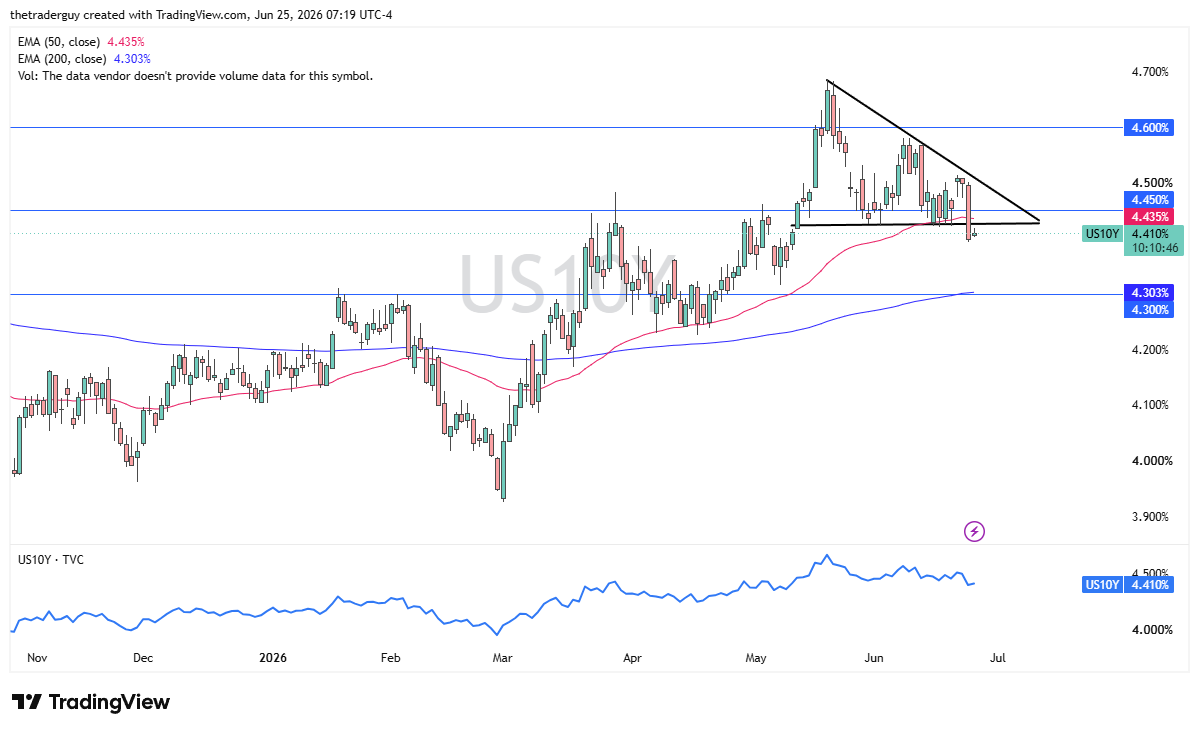
The US 10-year yield is where I start, and we have seen a pretty significant sell-off in the last 24 hours as far as the rate is concerned, meaning bonds are getting a bid again. Perhaps traders are starting to price in the idea of inflation dropping. That does make a certain amount of sense, but at the same time, the US dollar has been relatively resilient.
So, an interesting mix here. We’ll see how this plays out, but for me, it looks like this could add a little bit more risk appetite to the markets. The market seeing the 10-year yield drop below the 50-day EMA is the first major breach of the rising yield story, but we have yet to change the trend, so still in a state of flux.
Platinum Technical Analysis
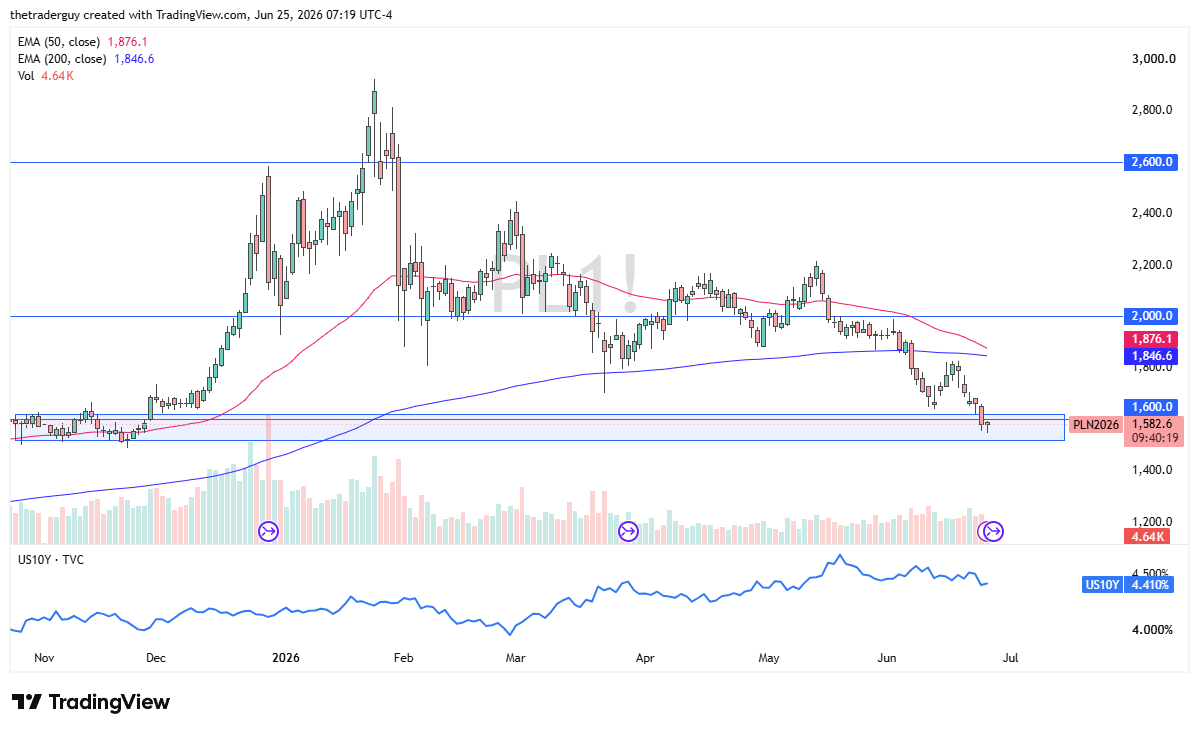
Platinum is a market I’ll be watching today. There’s a little bit of an area just below the $1600 level that has been important a couple of times, and we are right there. The market’s trying to bounce a bit. It wouldn’t surprise me at all to see a little bit of positivity come back into the market for the next day or 2 if rates continue to soften in the United States.
Demand, demand for metals is in a state of flux right now. A lot of what we had seen as far as pricing was concerned previously was based on inflation and not so much on demand. I think the market’s still trying to find its equilibrium. Looks like we could bounce in the process.
USD/JPY Technical Analysis
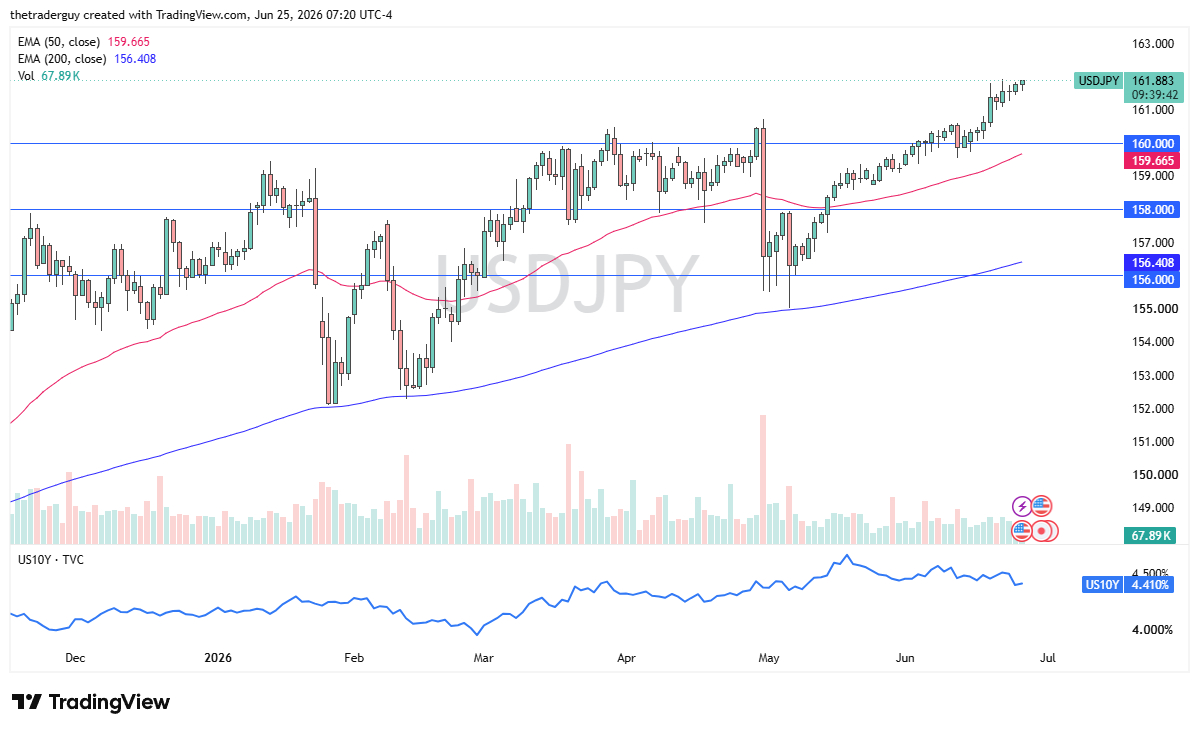
The US dollar initially fell against the Japanese yen, but it continues to grind to the upside, and I think this is the story for a very long time. The 160-yen level is your floor, the 50-day EMA is approaching it, but today I think we’re about to make another fresh new high. We’re already breaking the 1986 swing high over the last week or so. I really don’t see this turning around without Bank of Japan intervention. If they intervene, I’ll just buy it in a couple of days again.
FTSE 100 Technical Analysis
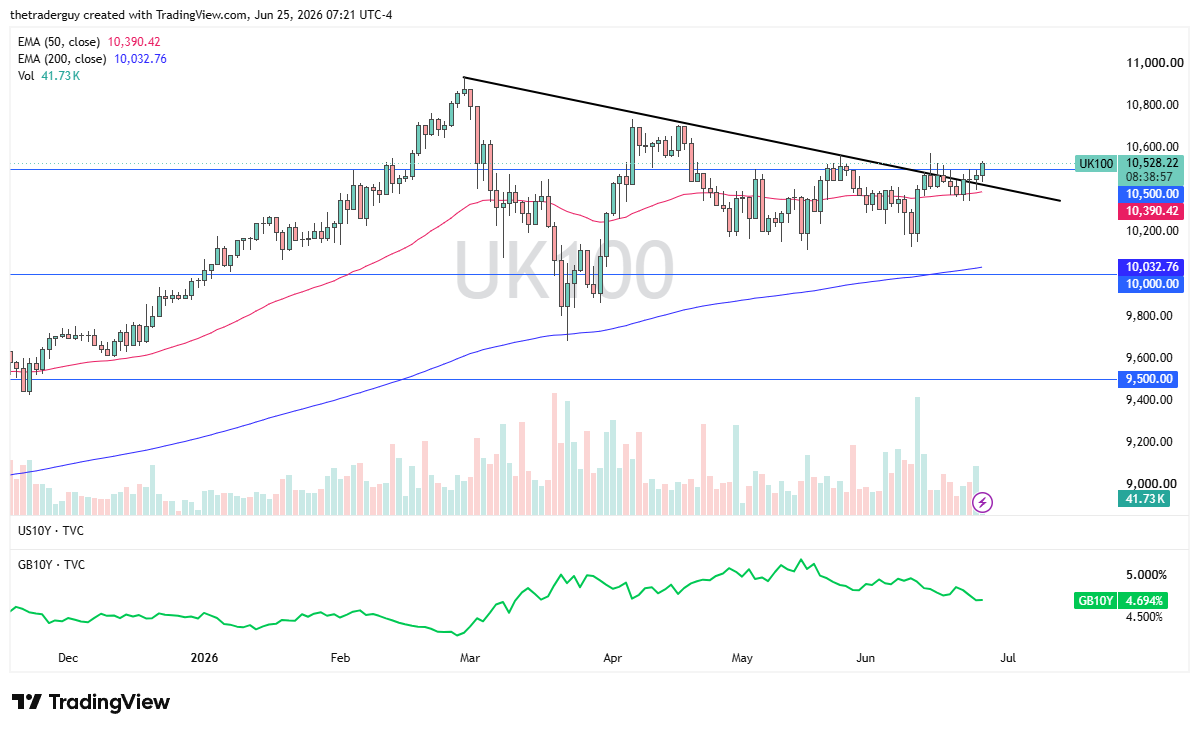
Finally, the FTSE 100 looks as if it’s in the process of breaking out. It did break a significant downtrend line with decent volume during the last 24 hours. The question is can we get above the 10,600 level? If we can, then that would confirm even further what’s going on.
As things stand right now, I do need to see a little bit more in the way of upward momentum because you could just as easily ignore the trendline and make a rectangle here. We’re not quite out of the woods yet, but it does look like a market that’s trying to turn things around. Rates in Britain are falling, which should help overall.