


US 10-Year Yield Technical Analysis
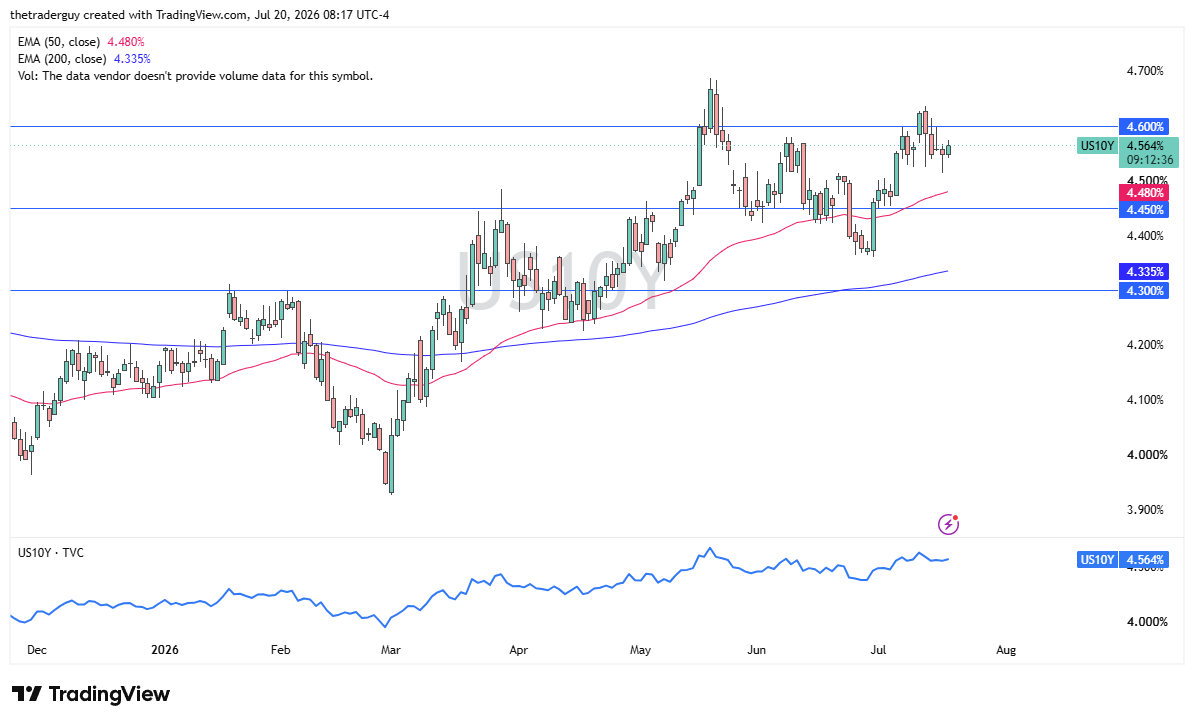
The ten-year yield in the United States is up a little bit during the early part of the trading session here on Monday. That could drive the US dollar a little bit higher; we will just have to wait and see. It is not up drastically, so I am not overly concerned. But it is worth looking at in general. That being said, it is the upward trajectory of rates over time that I think is the real story.
USD/JPY Technical Analysis
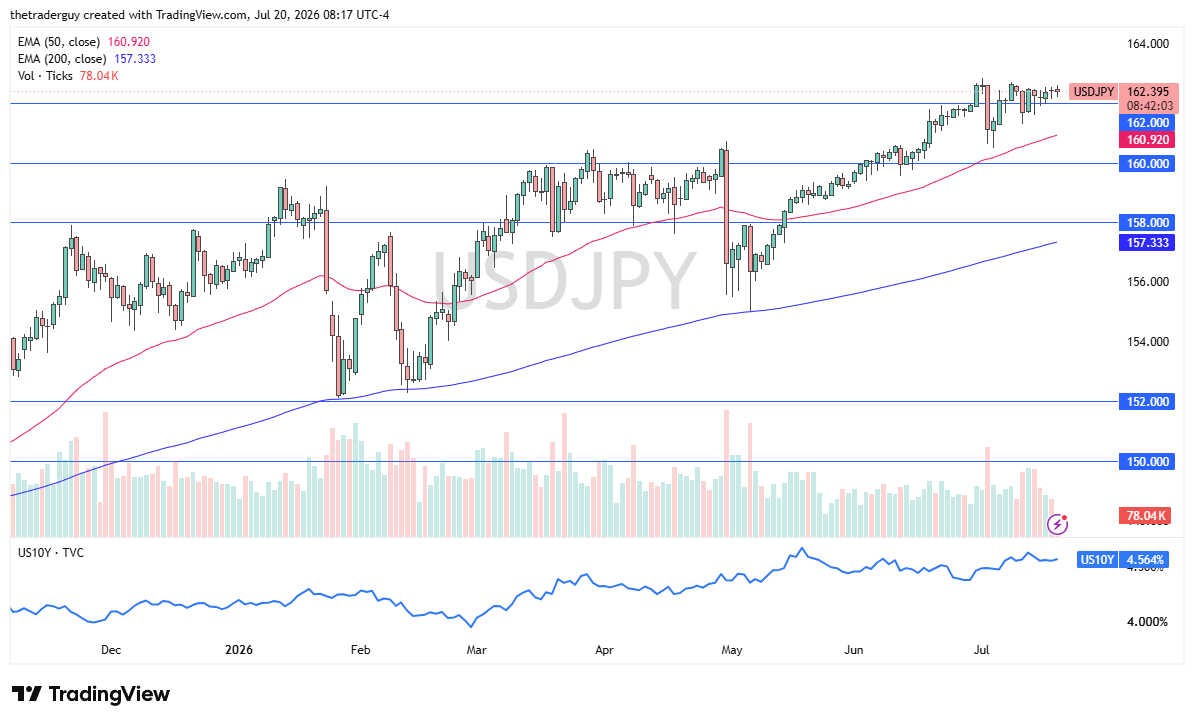
The US dollar initially fell against the Japanese yen, but it is starting to rally again, and we are still forming this ascending triangle.
The ascending triangle suggests that we will eventually break out to the upside, and that makes sense. The interest rate differential is pretty wide, and of course, the Bank of Japan finds itself in a situation where inflation has dropped a little bit, and the debt load in Japan is the thing that most people forget.
It is just too high for super high interest rates. I like buying dips, even if the Bank of Japan intervenes again, I just buy it at a lower level and start all over. This has been a trade that I have been building on for months, adding little bits and pieces. On a break to the upside, I will certainly do more of the same.
Copper Technical Analysis
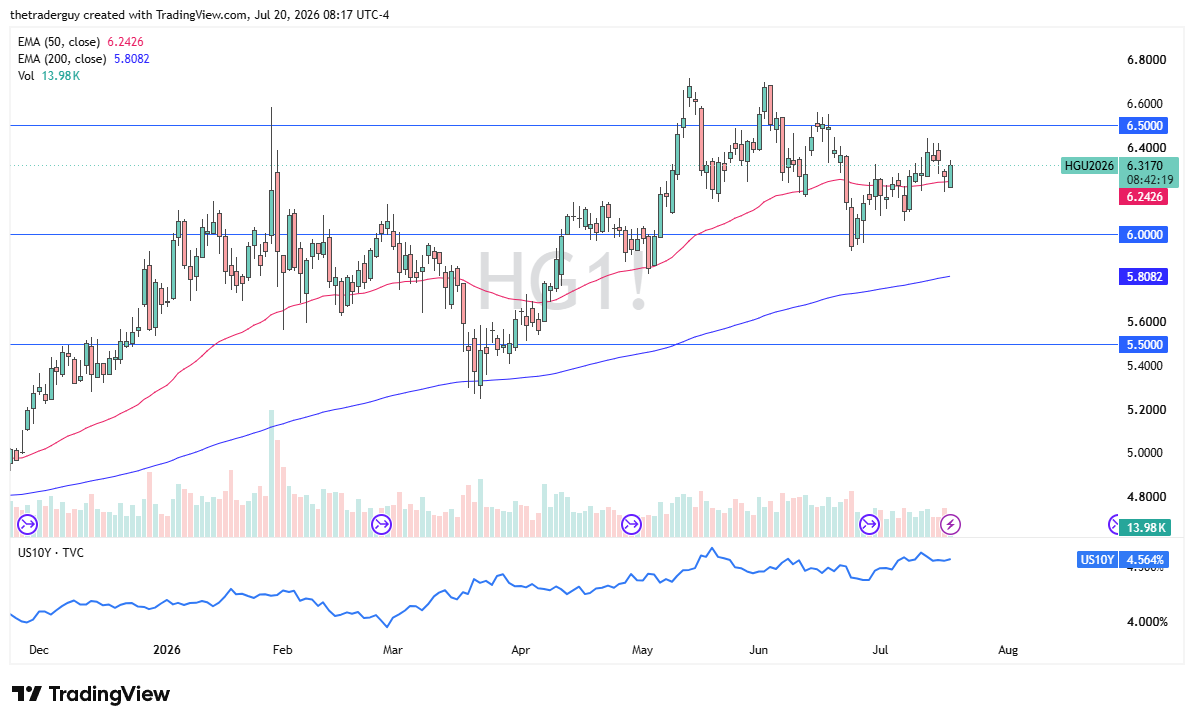
The copper market looks pretty healthy in the early part of the session. Short-term dips I think are buying opportunities in the copper market.
USD/JPY Price Forecast
Every new USD/JPY analysis as it publishes, today's technical signal and key levels, live price — on one page.
See all USD/JPY forecastsThe overall support level for me, at least at this point in time, is the $6 level. As long as we can stay above there, I think we are okay. $6.50 and $6.70 both offer pretty significant resistance.
AUD/USD Technical Analysis
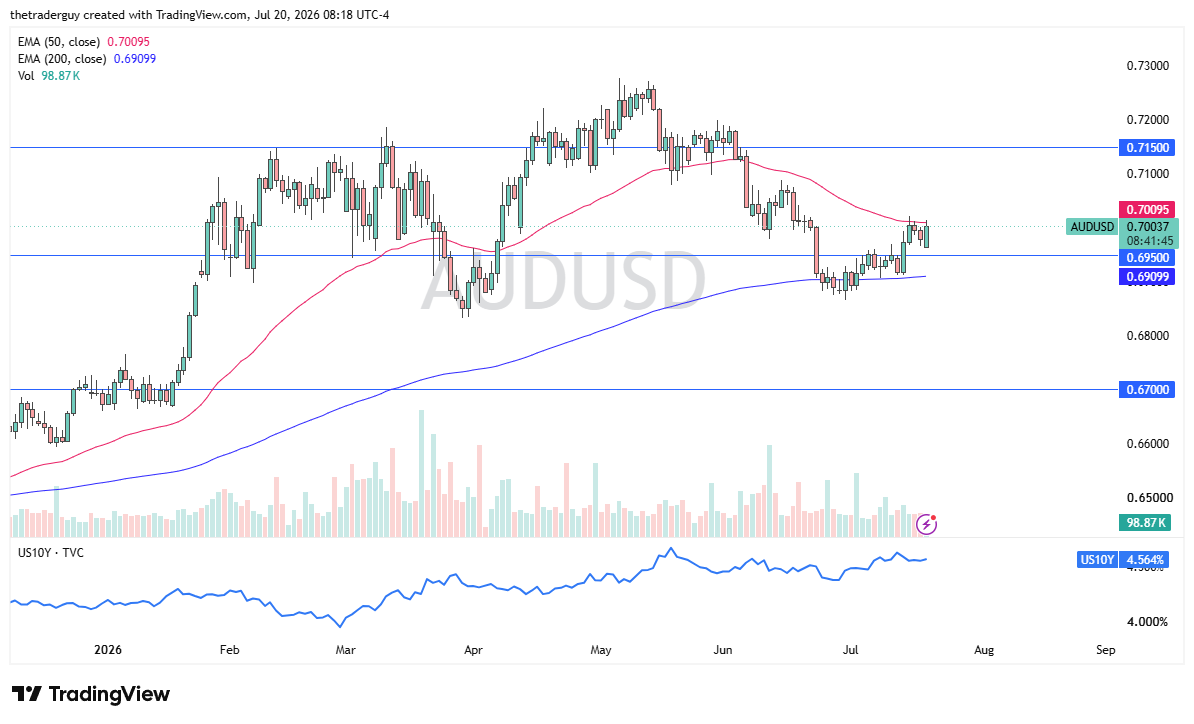
The Australian dollar has rallied a bit to test the 50-day EMA. The 50-day EMA is an indicator that a lot of people will watch very closely. If we can break above basically 0.7025, then I think we could make a run to 0.7150.
Otherwise, we stay in this consolidation. Higher interest rates during the early part of the session could keep us somewhat range-bound, as those rates in the United States still remain stubborn.