


US 10 Year Yield Technical Analysis
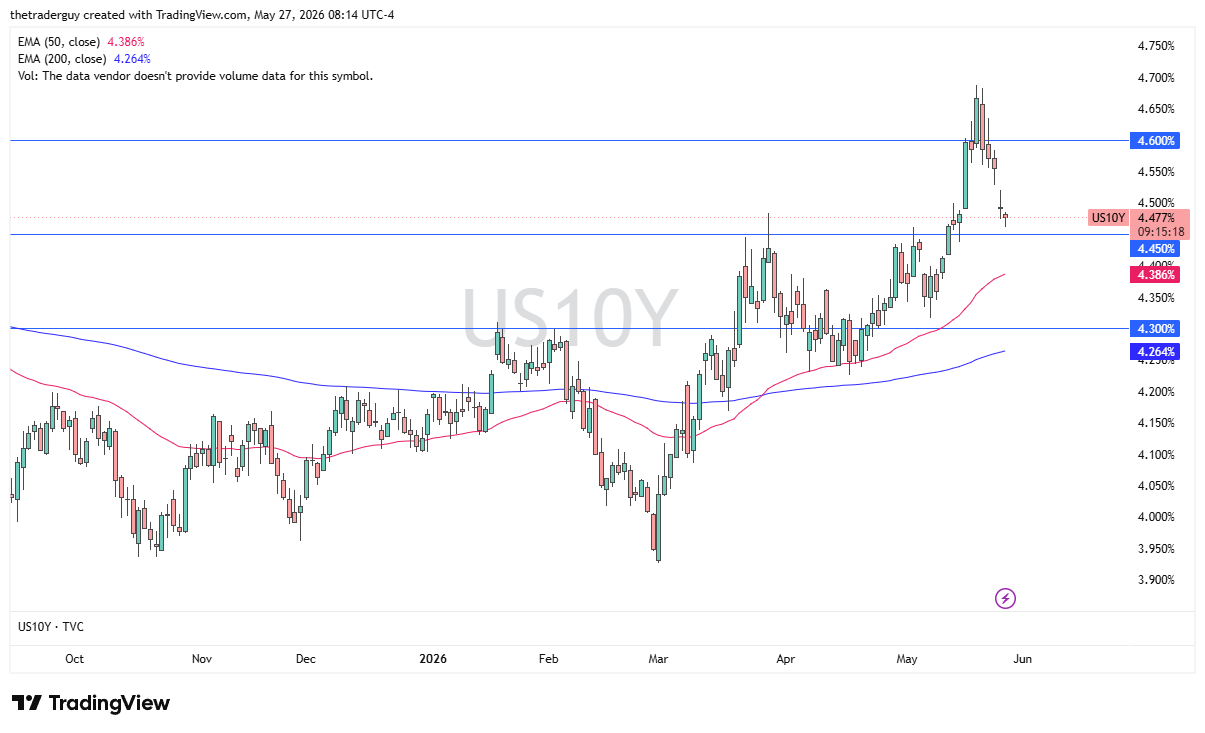
The 10-year yield finds itself dropping again during the session as we are looking towards the 4.45 level in areas that previously had been resistance, so we’ll see if it’s support here, whether or not the market turns around and bounces. It certainly looks like traders are trying to price in a little bit easing of hostilities in the Middle East despite the fact that we have a lot of problems, so it’s kind of interesting to watch how the market thinks about one thing and the headlines say another. If we break down below the 4.45% level, expect to see more risk appetite-based behavior out there.
USD/JPY Technical Analysis
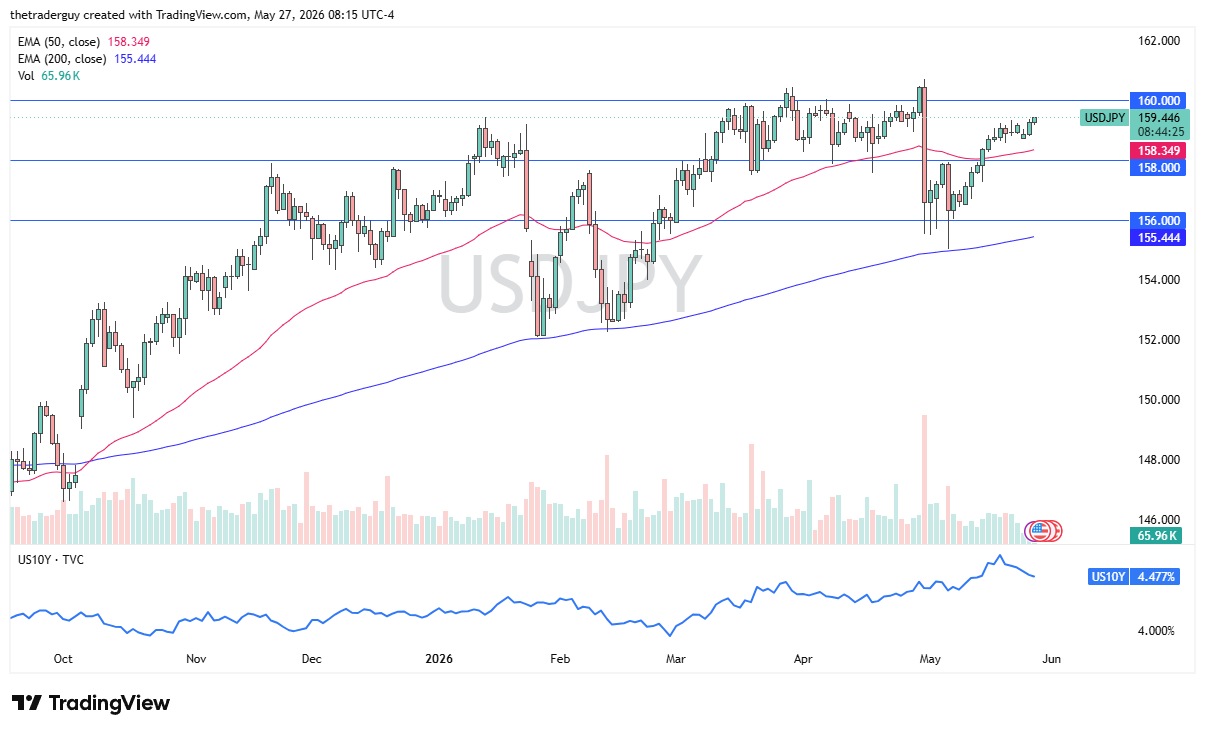
The US dollar continues to rise against the Japanese yen, and I am looking to buy it today for a small short-term trade. I don’t want to put a ton of money into this because I do know that the Bank of Japan intervened recently and of course will have something to say once we get close to the 160-yen level. Short-term pullbacks open up the possibility of buying a bit of value, but we’ll just have to wait and see whether or not we get that opportunity. The 50-day EMA underneath offers plenty of support, but I wouldn’t expect to see that today. I like the idea of looking for short-term dips and then buying on the right-hand side of the V to continue to go to the upside.
Corn Technical Analysis
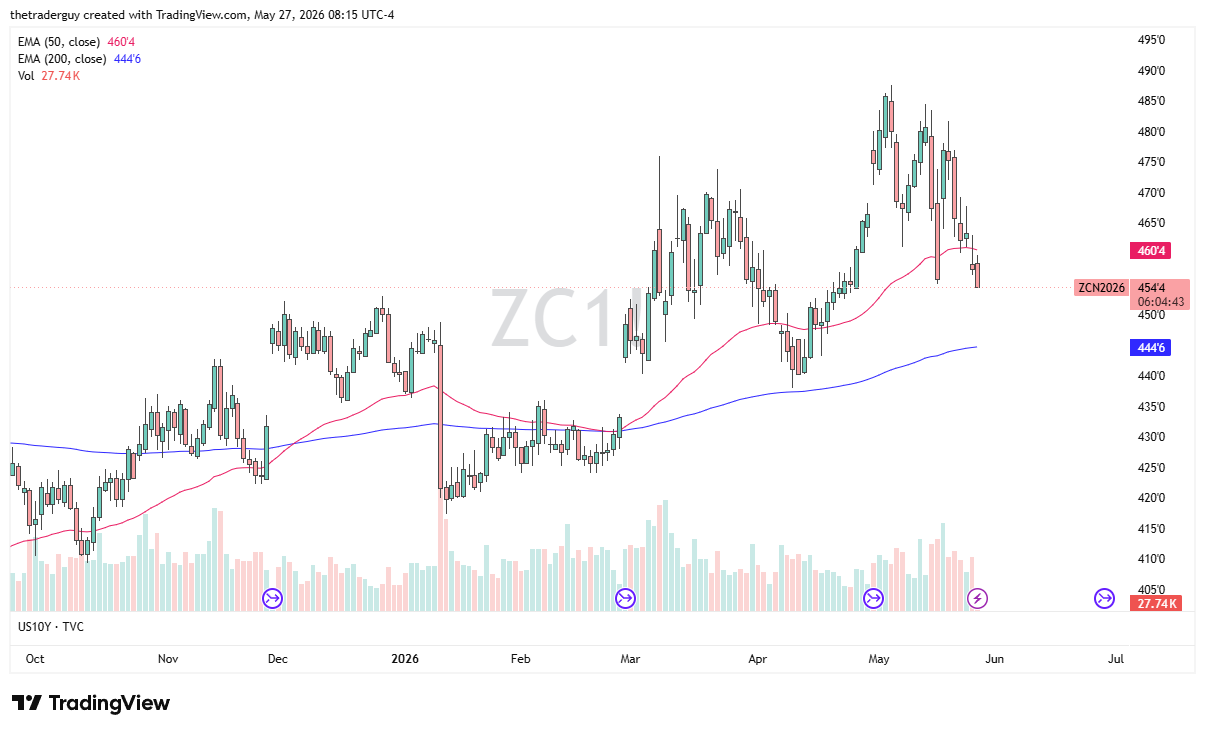
Corn looks like it’s a sell today, and if we drop down below 454, then I think the bottom drops a bit, perhaps down to 450. Corn’s really falling apart. It’s a classic technical overbought and then sell-off type of pattern. We’ll see how this plays out. I think it’s got further to go. It probably ends up at the 200-day EMA before it’s all said and done. This of course is weather-driven, so pay attention to that.
USD/JPY Price Forecast
Every new USD/JPY analysis as it publishes, today's technical signal and key levels, live price — on one page.
See all USD/JPY forecastsBitcoin Technical Analysis
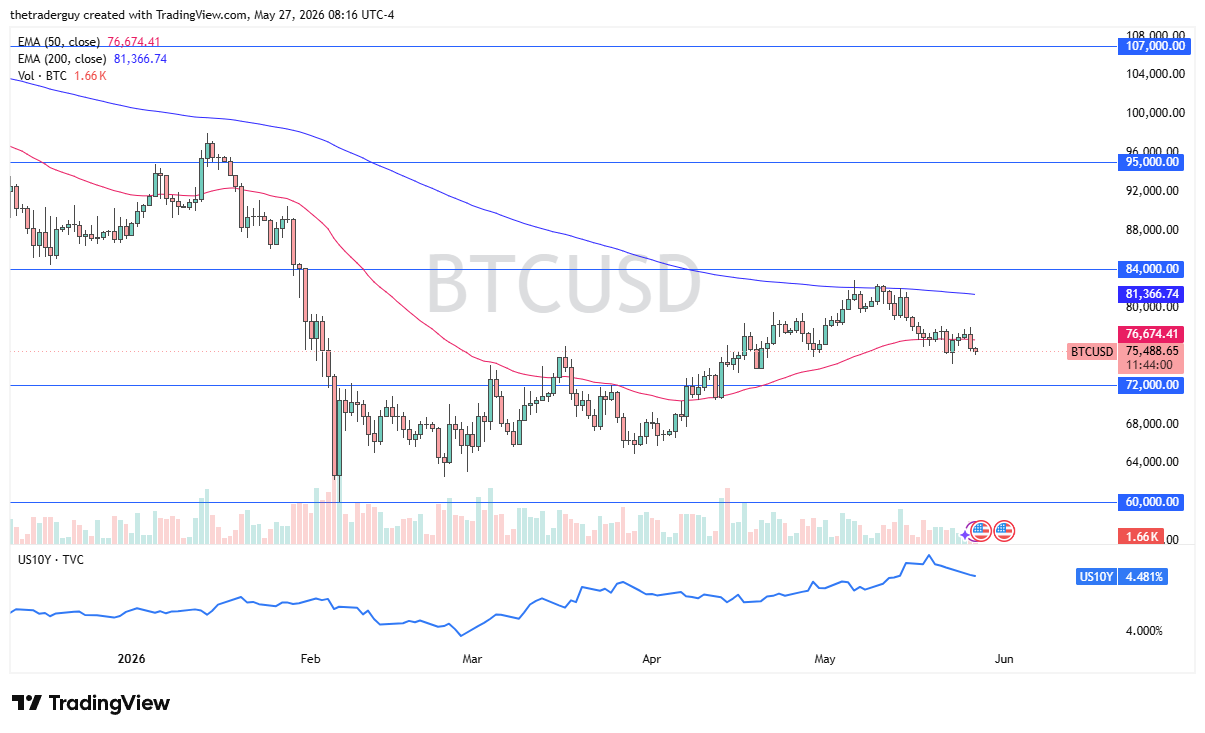
Bitcoin initially fell during the session on Wednesday, but it looks like it is trying to bounce back a bit, and as a result, I’m looking to get in and buy it today. I think it’s likely to go back towards the $78,000 level as we continue to consolidate in general. This is a market that is in the midst of accumulation from what I can see, and I do want to be involved in it given enough opportunity. Do not have any interest whatsoever in trying to short it.