


US 10-Year Yield Technical Analysis
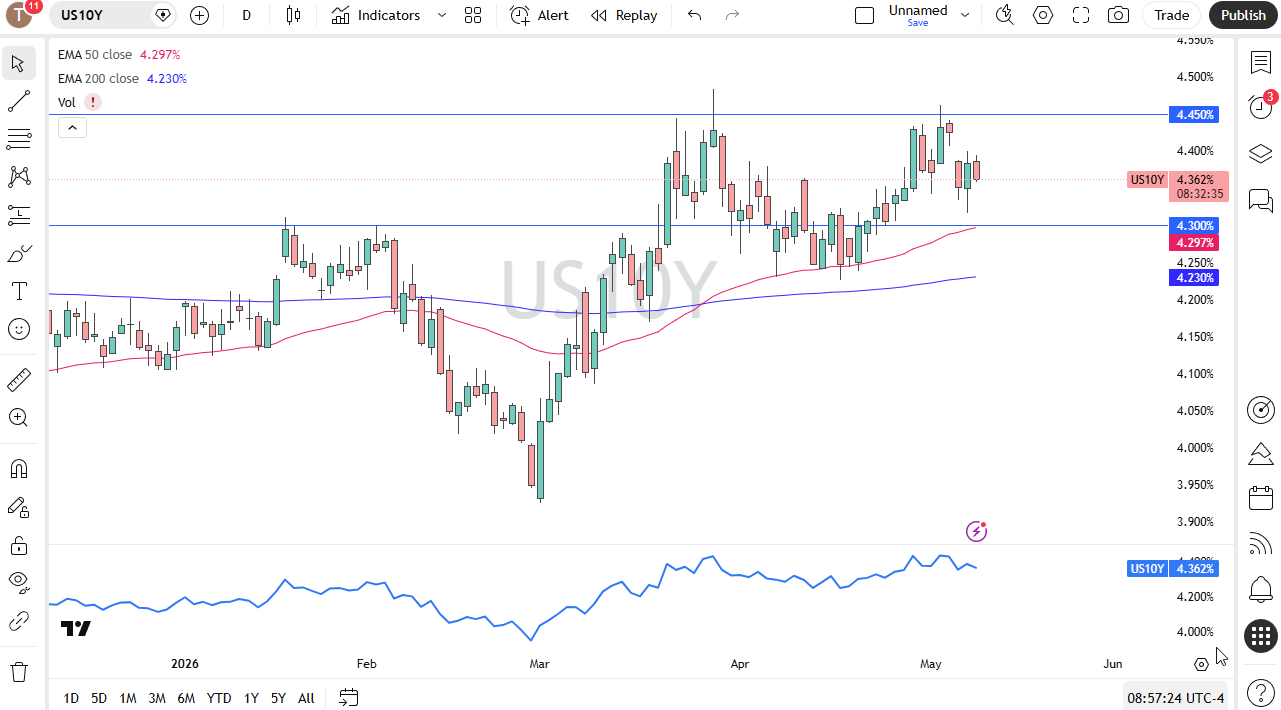
The 10-year yield is where I start, with the US 10-year yield being a major driver of risk appetite around the world. It is worth noting that we did pull back just a touch, but we have also bounced a little bit. I expect some choppiness on Friday; that is not a huge surprise, considering that it is a non-farm payroll Friday.
The United States beat its estimates yet again, and that has people questioning what central banks are going to do. I think this creates a tighter environment. The Federal Reserve has to worry about a labor market that just won’t roll over and now, in the last month or so, has had to worry about energy inflation. That keeps rates tight.
USD/JPY Technical Analysis
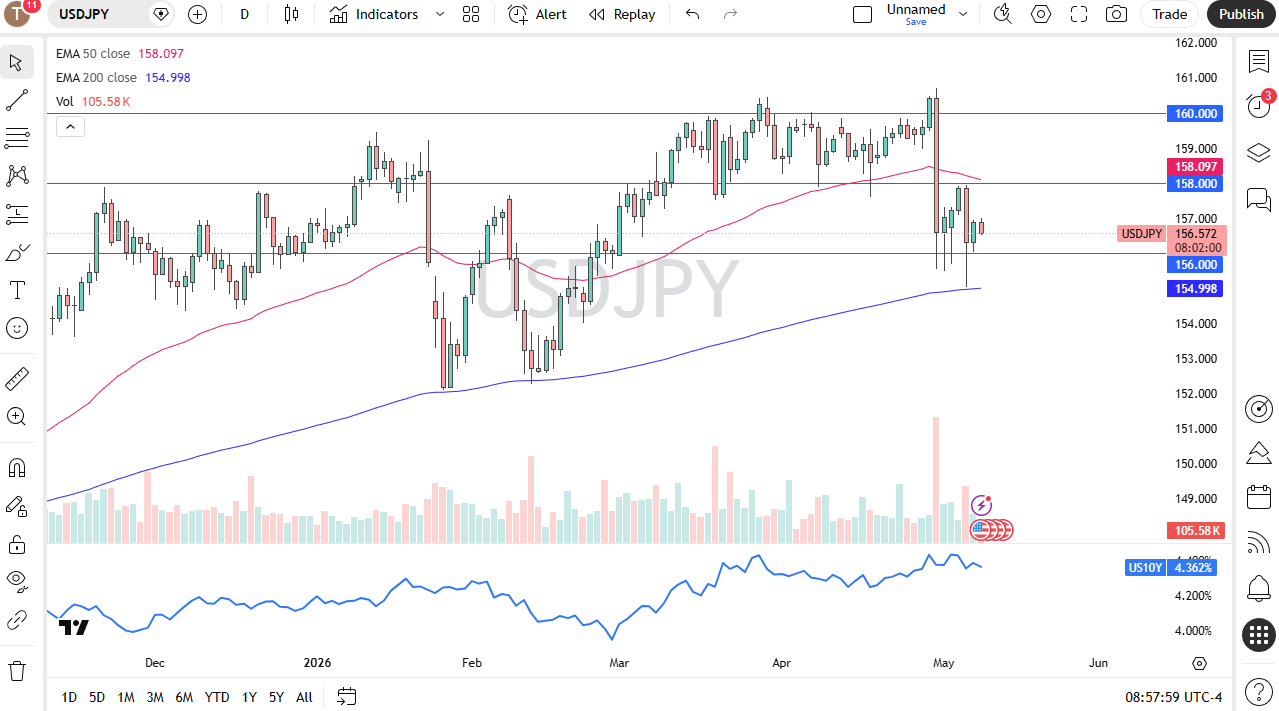
The first market I am looking at after the interest rate is the US dollar against the Japanese yen. The US dollar has been beaten up against the Japanese yen quite a bit over the last couple of weeks due to intervention, but really, at the end of the day, the interest rate differential is still wide enough to drive a truck through.
It is not as wide as it once was, but it is still something that pays you at the end of every day. I still like the idea of trying to buy this market above the 157-yen level for a short-term trade towards 158 yen. If we break down below 156, I will just step aside for a moment and let it catch its breath.
Nvidia Technical Analysis
USD/JPY Price Forecast
Every new USD/JPY analysis as it publishes, today's technical signal and key levels, live price — on one page.
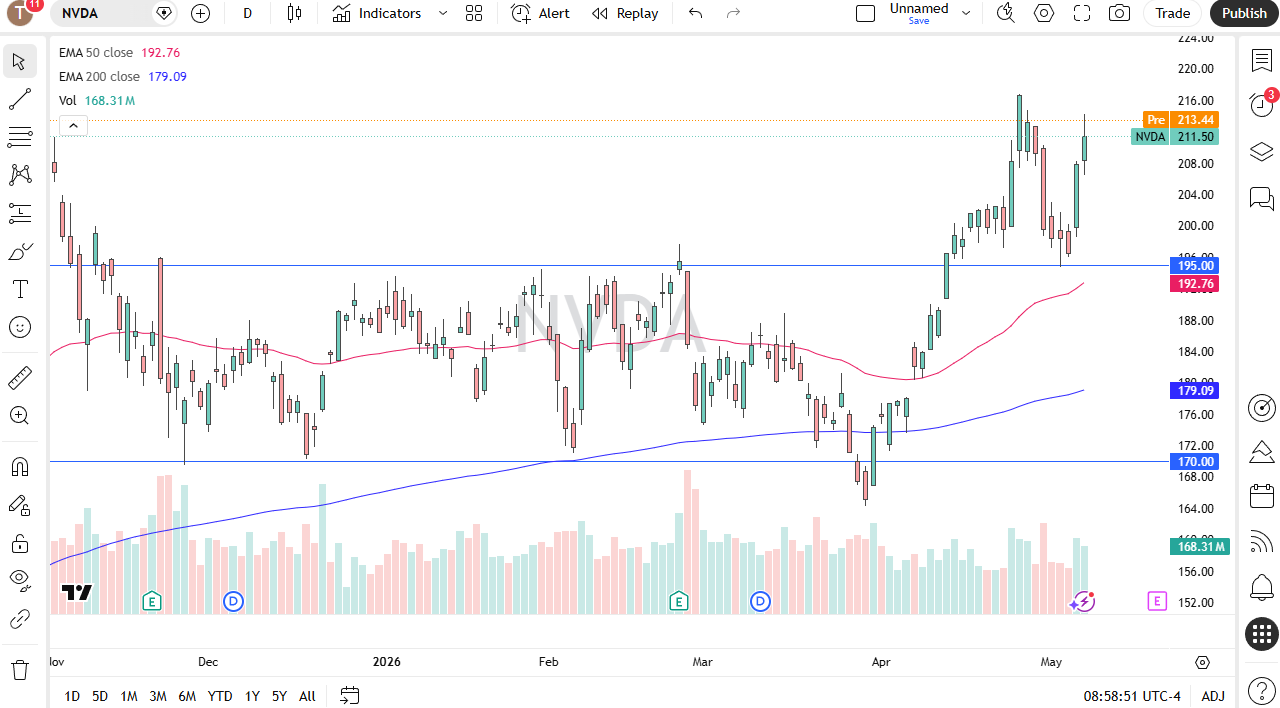
See all USD/JPY forecastsNvidia looks like it is going to jump right at the open. A break above the recent swing high of about $217 is a fresh new high. It is time to start buying again for longer-term investors, and I think that would give it a little bit of rocket fuel to continue climbing. I don’t have any interest in shorting and would be interested in buying a dip if we get it down to the $208 level, although I don’t think that is likely.
XLE (Energy) Technical Analysis
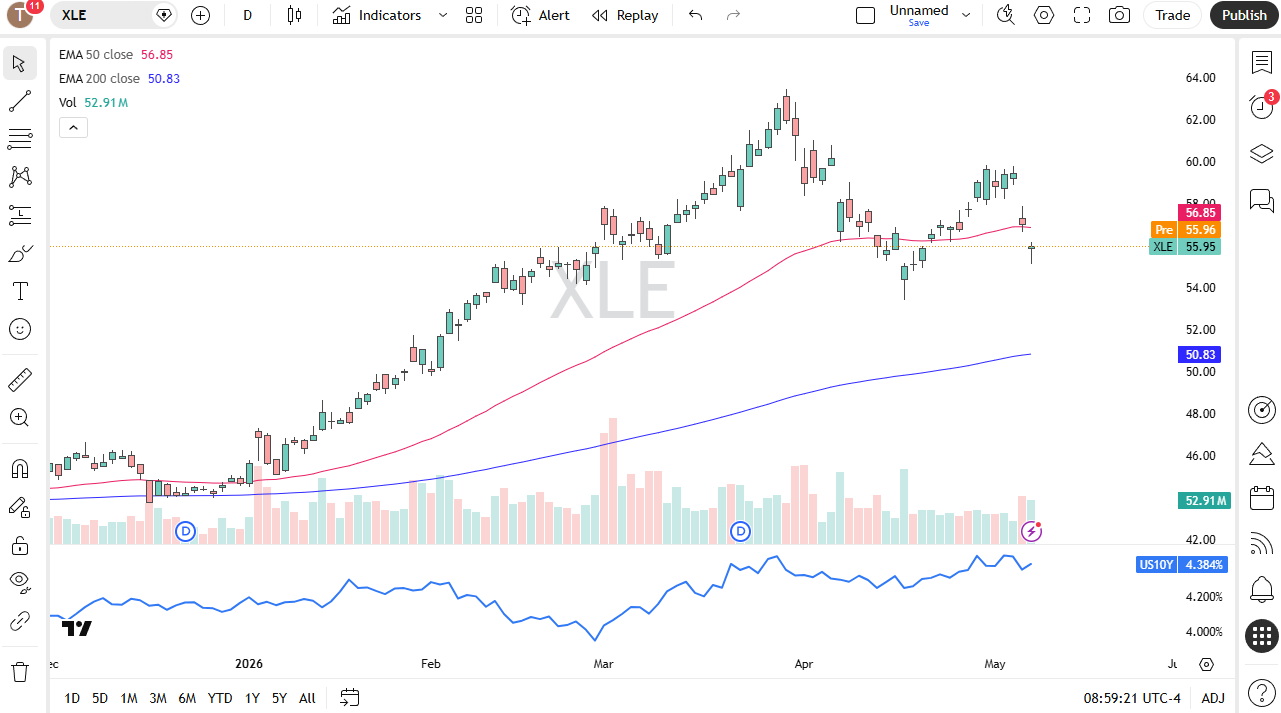
Finally, I am looking at the XLE ETF. This is energy, and it looks like it is going to open up basically where it had closed, but I am watching this very closely because we are starting to see reports of tankers being hit in the Strait of Hormuz.
It is a little bit of a speculative play here because energy prices are going to be higher for longer even if the war ended today. There would be a knee-jerk reaction, obviously, but the infrastructure damage is done. With that, I do like owning this. We formed a hammer on Thursday, so this might be a nice swing trade, maybe to the $60 level.