


10-Year Yield Technical Analysis
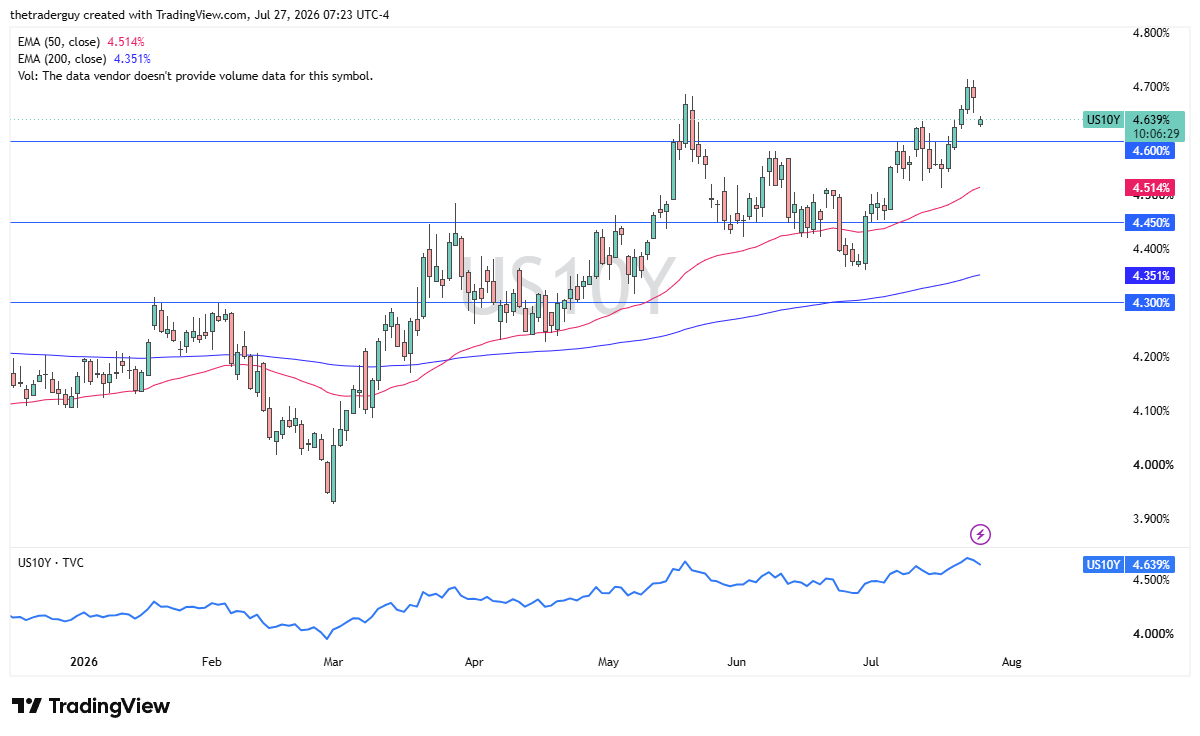
The US 10-year yield has gapped lower, and as a result, more of a risk-on appetite situation has occurred around the world, but let’s not get ahead of ourselves. This is about the 40th time this has happened in the last couple of months, or at least feels like it. The idea that Iran and the United States are not launching missiles at each other in the moment is nice, but it’s not a conclusion to what’s rapidly looking more like a forever problem. So, at this point in time, I would assume that there will be headlines out there that could turn this right back around. So, with that in mind, the 10-year yield is something that I watch very closely.
USD/CAD Technical Analysis
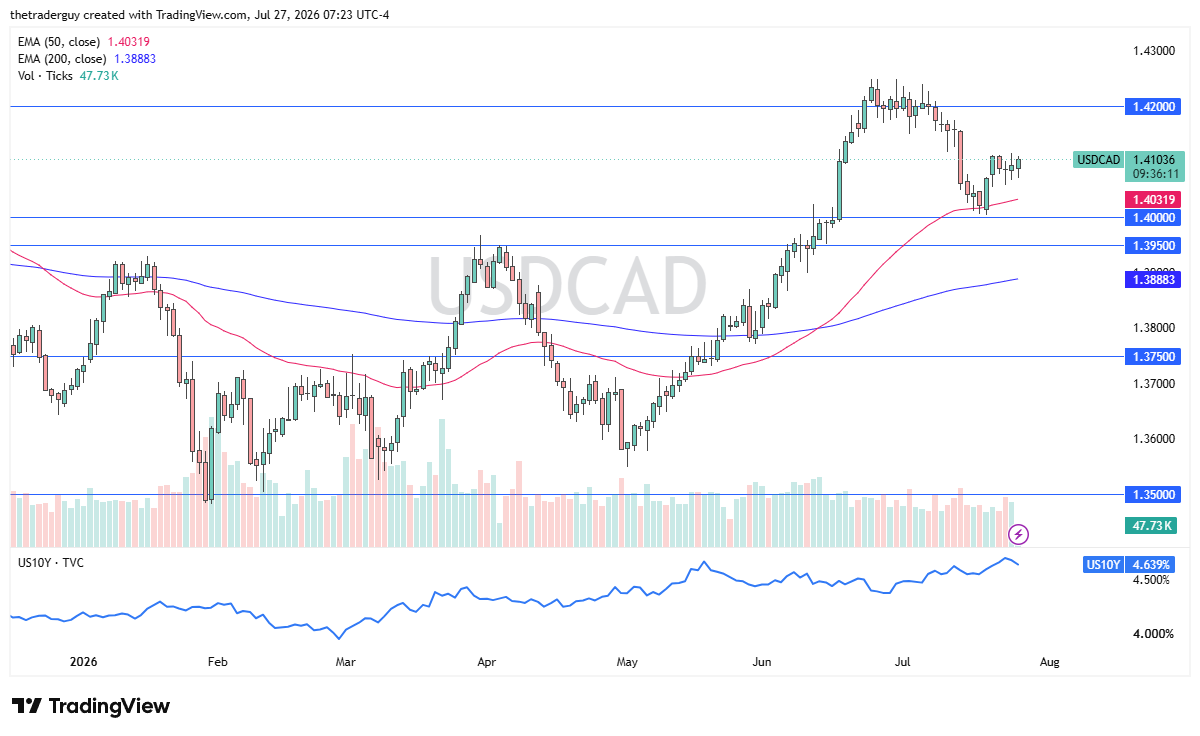
The US dollar initially fell a bit against the Canadian dollar but has since risen. And with the influence of falling oil, it does make a certain amount of sense. But quite frankly, the market has found a bit of a bottom near the 1.40 level again. Above the 1.4125 level, I’m looking to get long, perhaps seeing this pair grind its way to the 1.42 level. I have no interest in shorting this market. The interest rate differential continues to favor the United States despite the fact that rates have fallen, and of course, I’m not a big fan of the Canadian dollar at the moment.
Platinum Technical Analysis
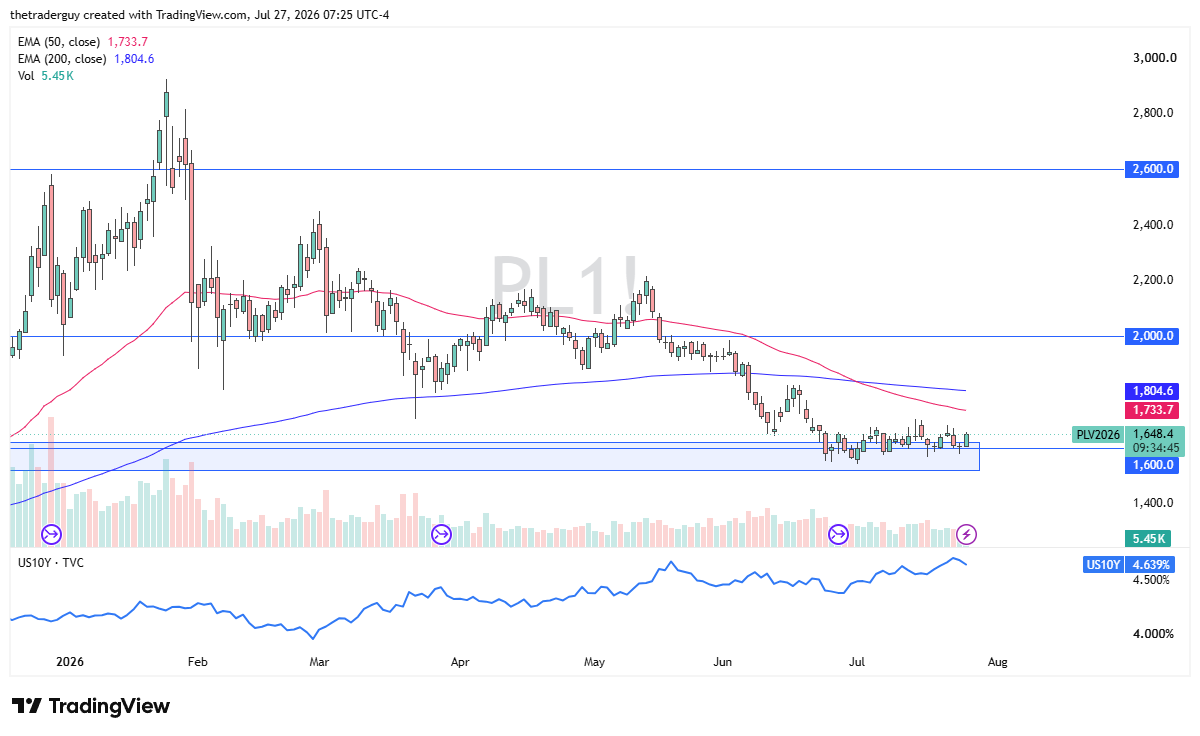
The platinum market has taken off and looks fairly strong in early trading, but we are still very much in the consolidation that we have been in for a couple of weeks. I will be looking for signs of exhaustion on short-term charts, like 15-minute charts, somewhere a little closer to about $1,660 to start shorting for a short-term trade. This is not something I’m getting married to here, but it is the pattern that we’ve been in for some time. Quite frankly, it wouldn’t surprise me at all to see it continue.
CAC Technical Analysis
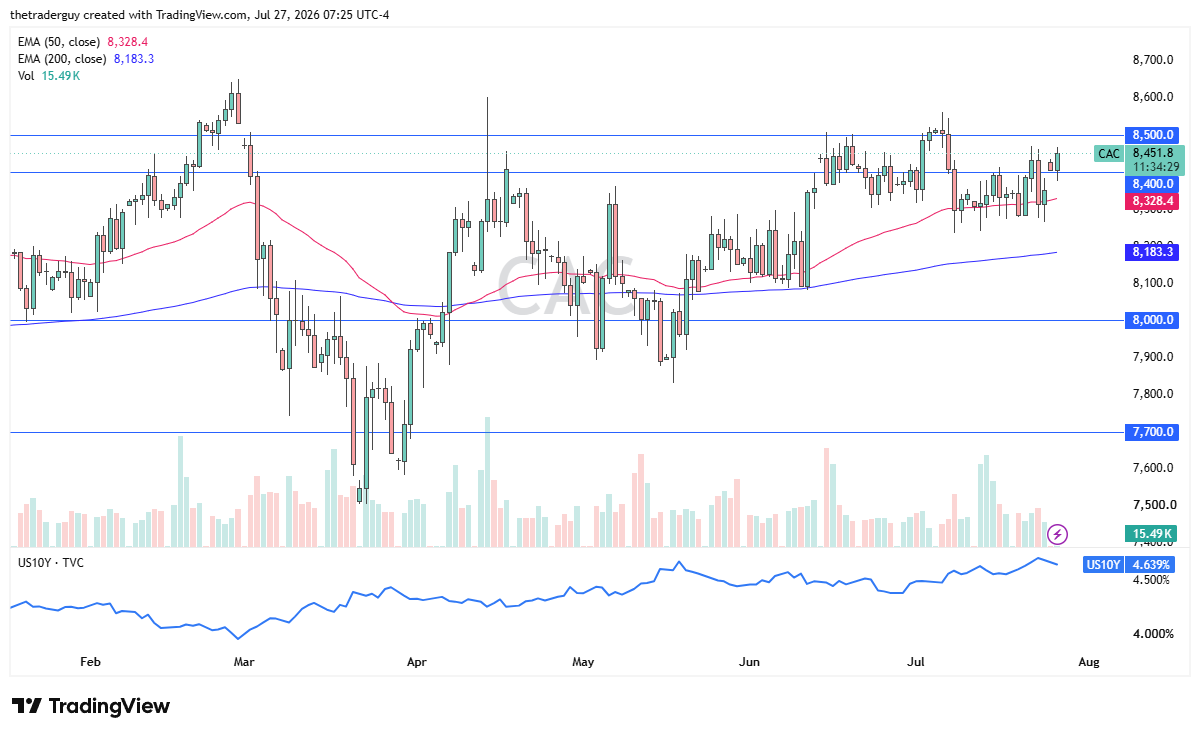
The CAC in Paris is looking strong during the day, waiting to see at this point whether or not we can break the €8,500 level. This may not be a trade on Monday, but it is something I’m setting alarms in order to take advantage of any attempted breakout. We’ll just have to wait and see. Short-term pullbacks continue to find support from what I can see, as we do continue to grind higher over the longer term.