


US 2-Year Yield Technical Analysis
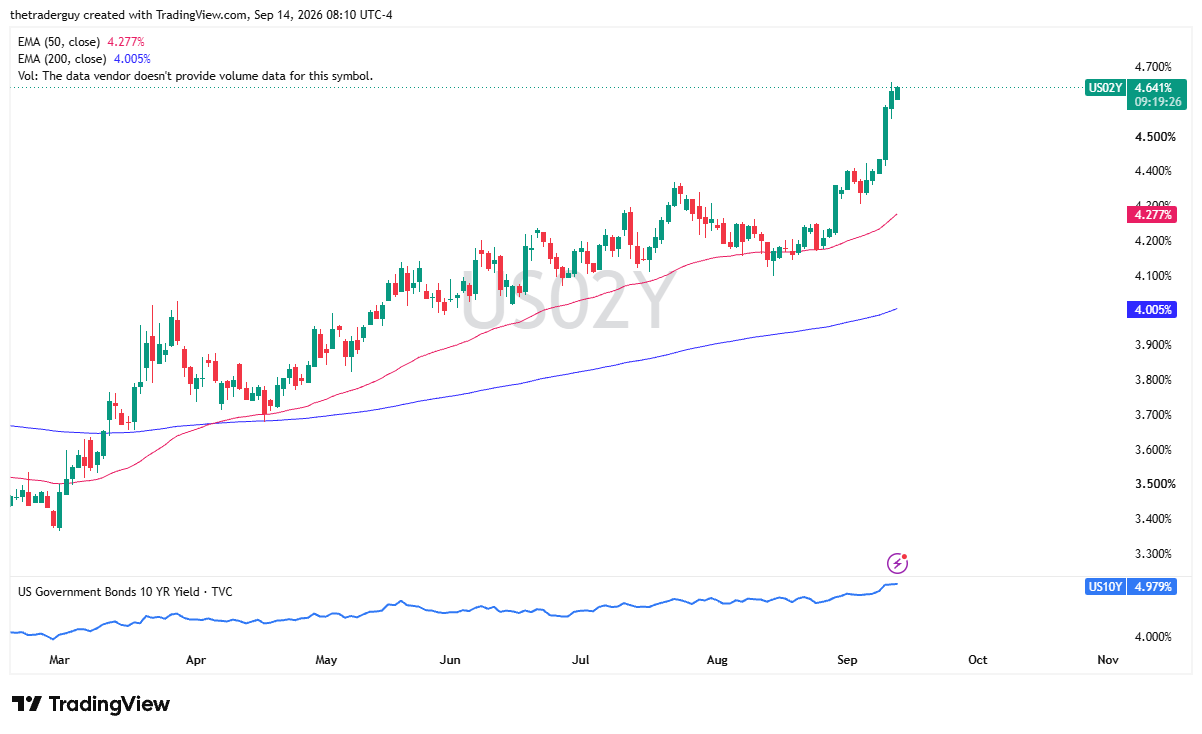
The U.S. 2-year yield continues to rise. We did open down a little bit on Monday, but have turned right back around to see the 2-year U.S. yield jump again. This is going to cause some pressure in certain markets, and we will take a look at that through the prism of perhaps risk appetite deteriorating.
USD/CHF Technical Analysis
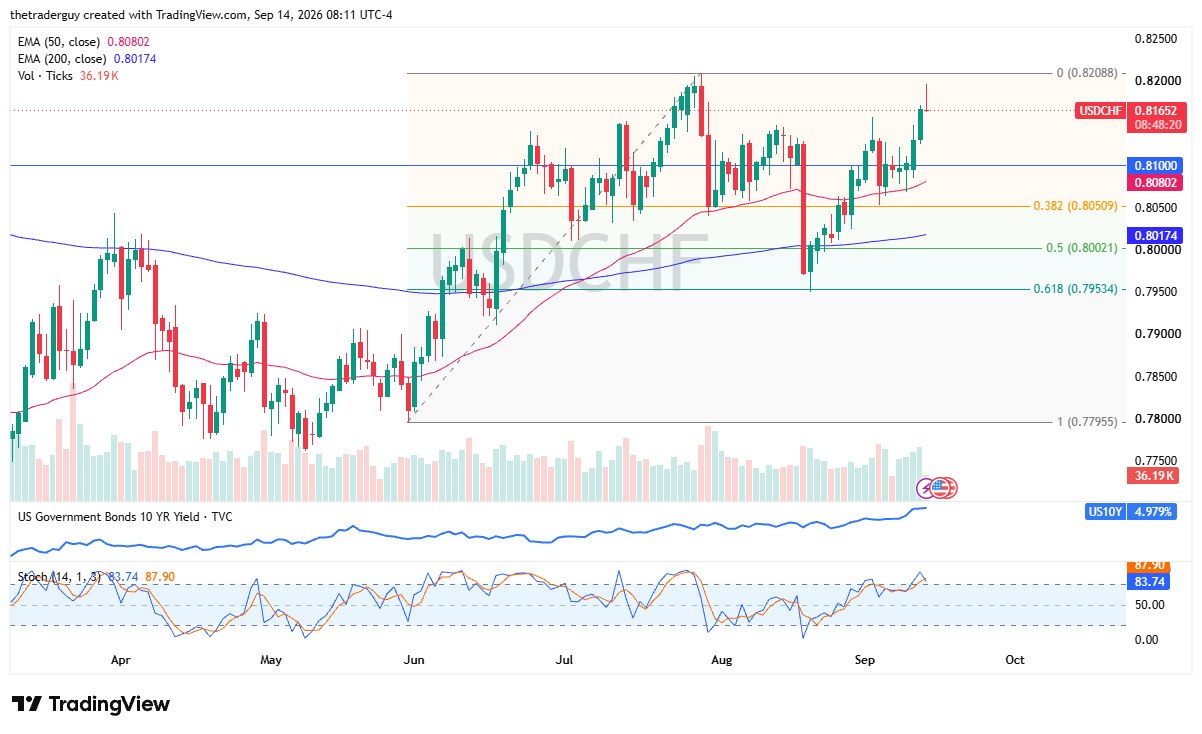
The U.S. dollar against the Swiss franc is something I’m watching because we did rally to kick things off, only to roll over again. The 0.82 level is an area that I look at as a major barrier, and if we were to break through that barrier, I think that would be a very bullish sign for the U.S. dollar.
The interest rate differential is still huge between the U.S. and Switzerland, and therefore there will be demand by some to hold this pair in order to make that swap at the end of every day. The 0.81 level underneath very well could end up being support. I do like the idea of buying dips here and will be watching for an opportunity.
Copper Technical Analysis
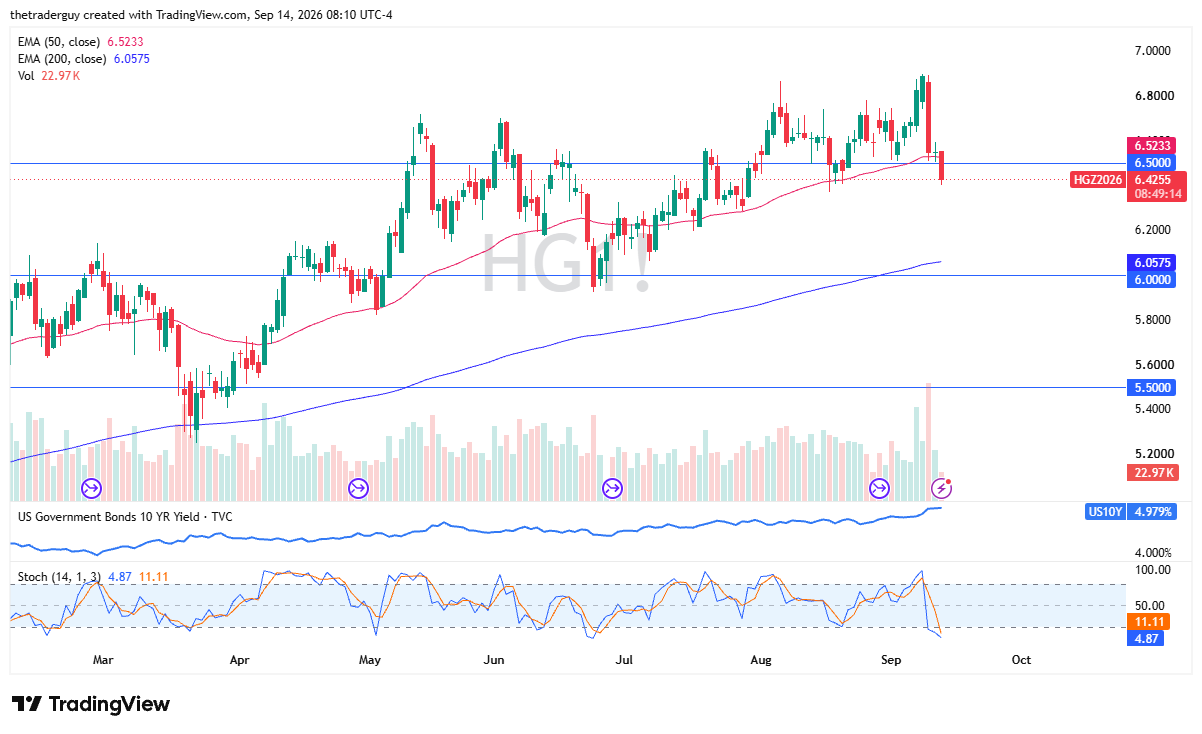
The copper market looks interesting to me because we continue to fall and are starting to get into an oversold condition on the stochastic. The market turning around today could get me going long here because I have no interest in shorting copper, quite frankly. Copper is still a situation where there is nowhere near enough supply to take out demand. A recapture of the $6.50 level would be very interesting to me for bullish reasons.
DAX Technical Analysis
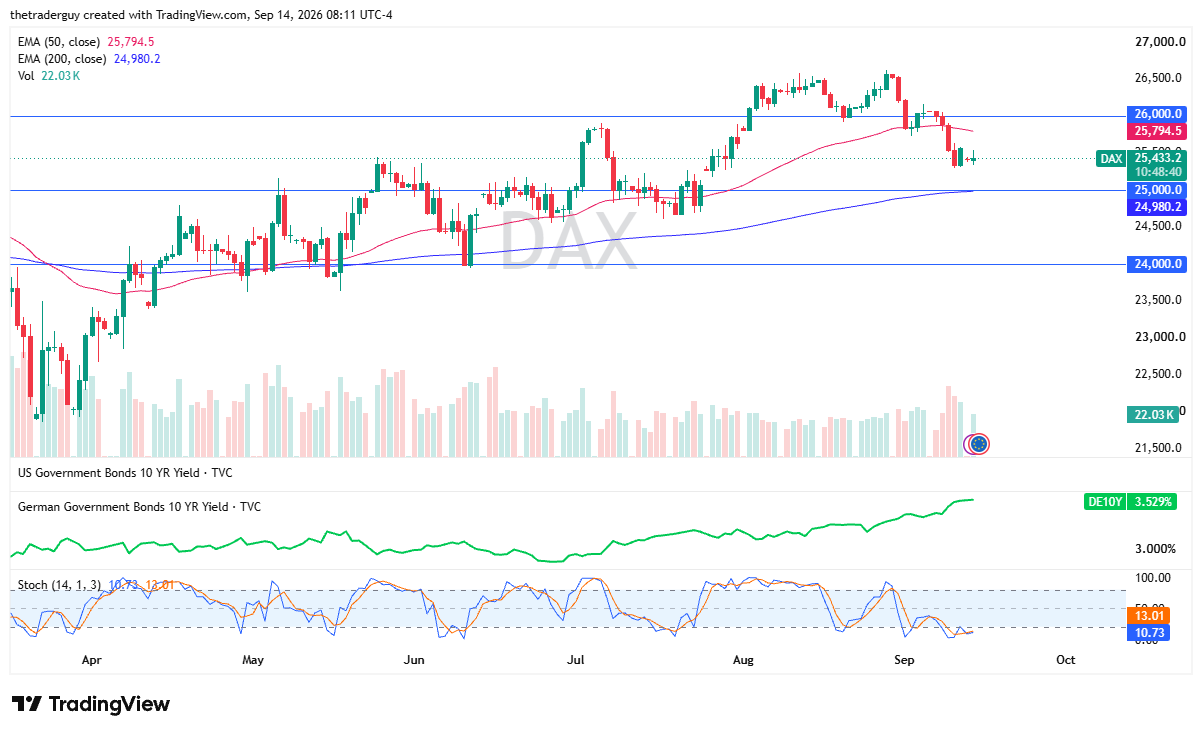
The DAX in Germany is crossing over in the oversold condition of the stochastic oscillator, but we are sitting at an area that could open up the possibility of a bit of a bounce. The 200-day EMA sits at the 25,000 level, which is a large, round, psychologically significant figure and an area we had gapped away from. Rallying from here opens up the possibility of a move to the 50-day EMA, or possibly even the 26,000 level. Either way, I’m watching the DAX closely. The screaming-high rates in Germany are the biggest hurdle at the moment due to energy inflation.