


US10Y Technical Analysis
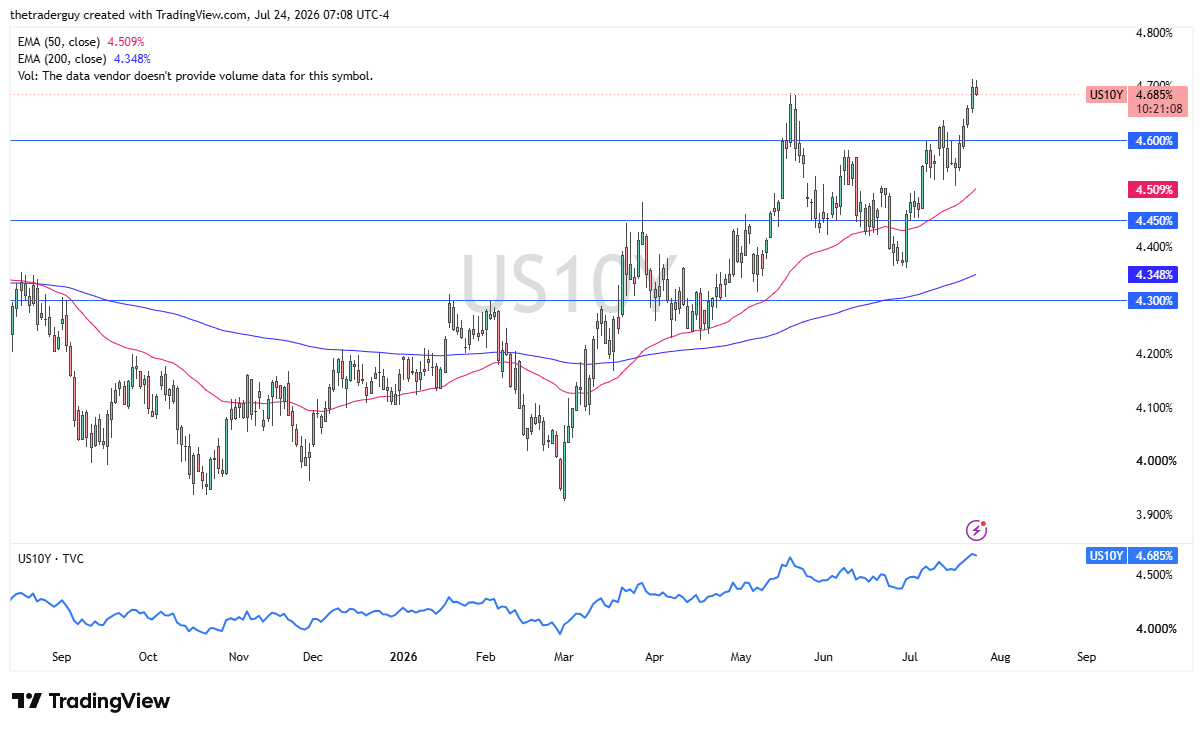
The 10-year yield has pulled back just slightly during the early part of the trading session here on Thursday, as we had gotten a little bit of momentum to the upside, broken out, and now we have pulled back on Friday. At this point, I think the market is a little bit overdone. It does make a certain amount of sense after a move like this to perhaps grind sideways or pull back a bit. Yields are still extraordinarily high, even though they have cooled off.
Platinum Technical Analysis
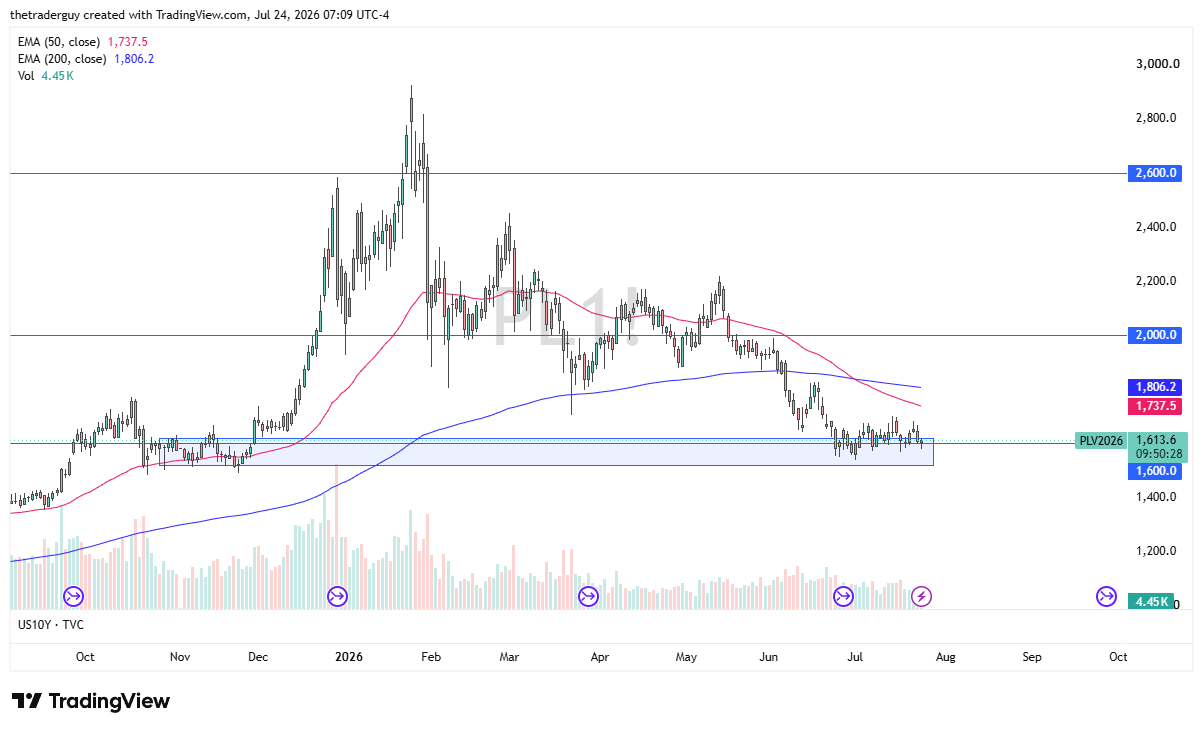
The platinum market looks like it wants to take advantage of that. You can see that the $1,600 level has been acting as an area of support in the past. A short-term bounce from here is possible. It’s what I’m looking for today. Small trade, not a long-term trade, maybe a couple of hours at best. Platinum is a slower and more manageable way to play silver most of the time for me.
GBP/CHF Technical Analysis
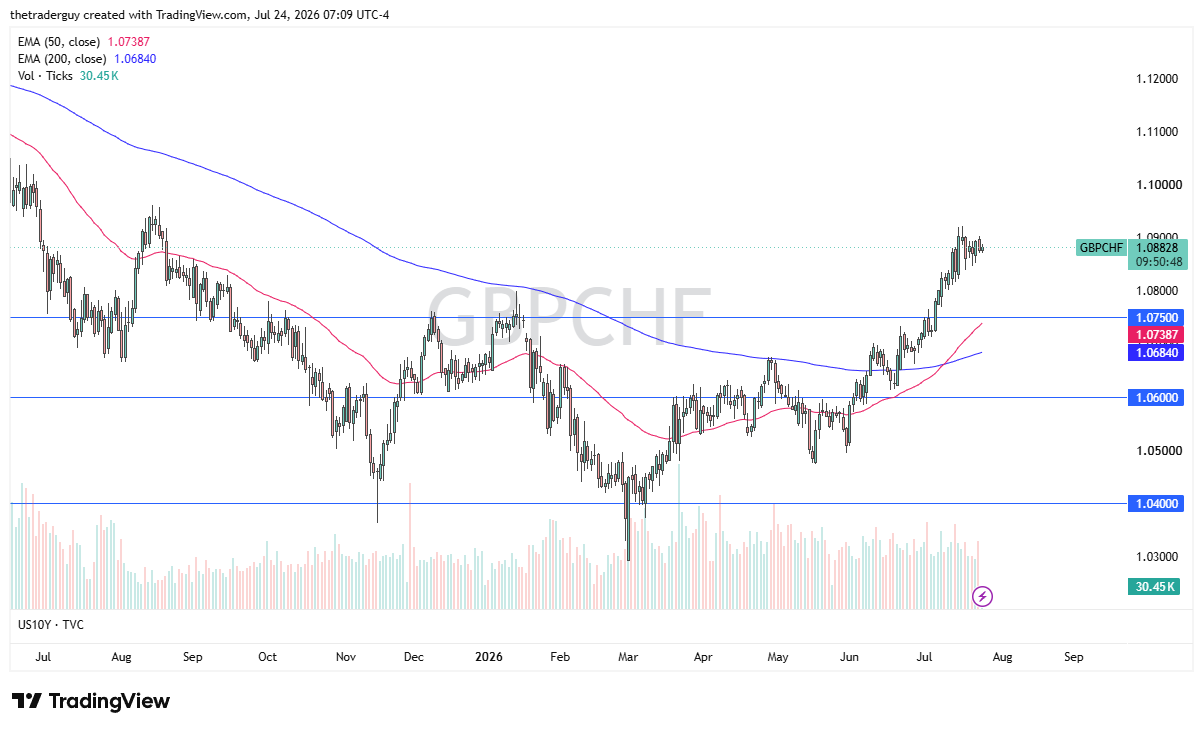
The British pound continues to grind back and forth against the Swiss franc. I like the idea of buying dips. The interest rate differential continues to favor the British pound and will for the foreseeable future. I like this. I like buying dips. I look at the 1.09 level as a bit of a magnet for price as things stand right now. If we break down from here, I would not be interested in shorting. I would just simply wait for some type of bounce to start buying again.
USD/JPY Technical Analysis
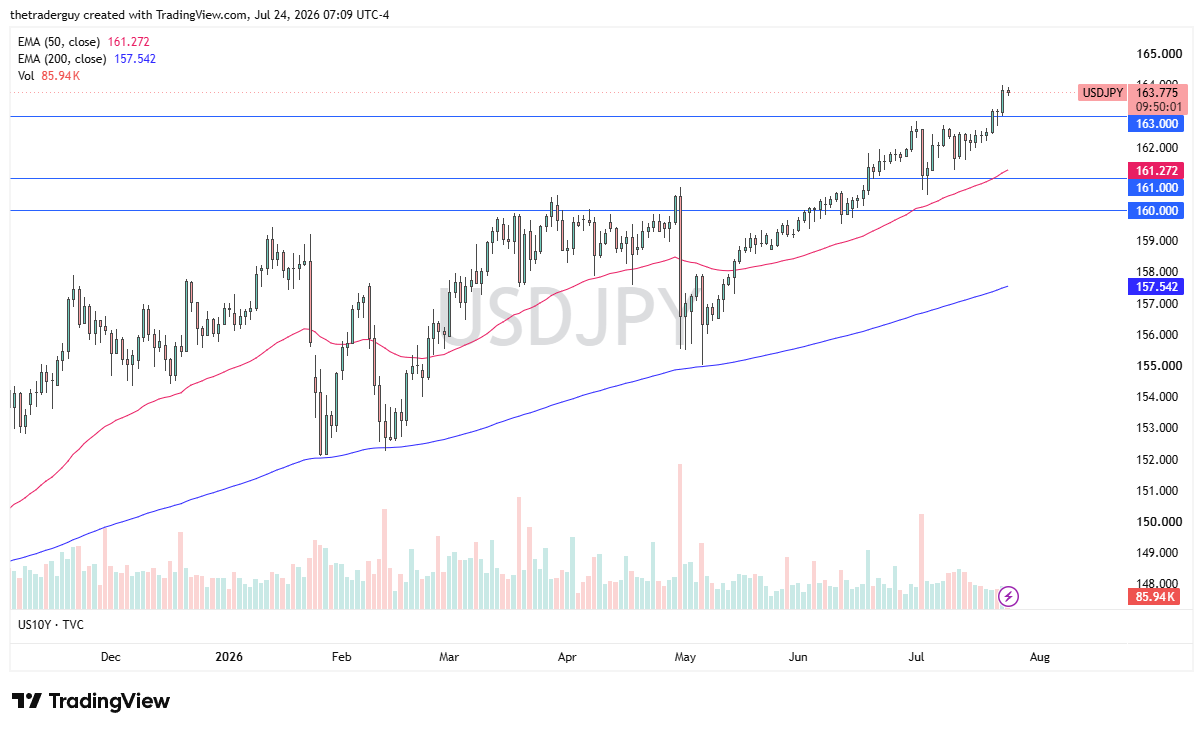
And then finally, USD/JPY. This is a trade that I’ve been in for months. I like buying dips. We had a nice session on Thursday to the upside. I think Friday probably a good time to look for short-term pullbacks to add to an existing position. We are well above 163 yen. That is my plan. Traders clearly are bullish on this pair as we’ve been straight up in the air in a nice 45-degree angled trend since the middle of May.