



Utilities are one of the quiet winners of the AI data center supercycle, and the State Street Utilities Select Sector SPDR ETF (XLU) is sitting at $46, about 4% off its all-time high set in late February. The bull case is real. Power demand is rising faster than we’re building capacity for the first time in two decades. Utility CapEx is at record highs, and data centers are driving what are normally slow-moving, often-monopolistic entities into upping their pace.
But there is a ceiling above this trade, and it is not on the tape, per se. It is minted by the bond market. The 10-year Treasury yield is sitting at ~4.3%, and until that number breaks lower, utilities will have a hard time making real progress past their old highs. This is a trade that hinges almost entirely on where the long end of the curve goes next, because even secular tailwinds can’t beat the risk-free rate.
The Utility Bull Case Is Really A Tech Story
For most of the last 20 years, U.S. electricity demand was flat. Utilities investors got used to modeling 0.1% annual demand growth and writing it off as a sleepy sector where you owned it for the dividend—hence the comparison to the 10-year, which still has a deep pull on demand for utilities. With the AI data center boom, that’s over.
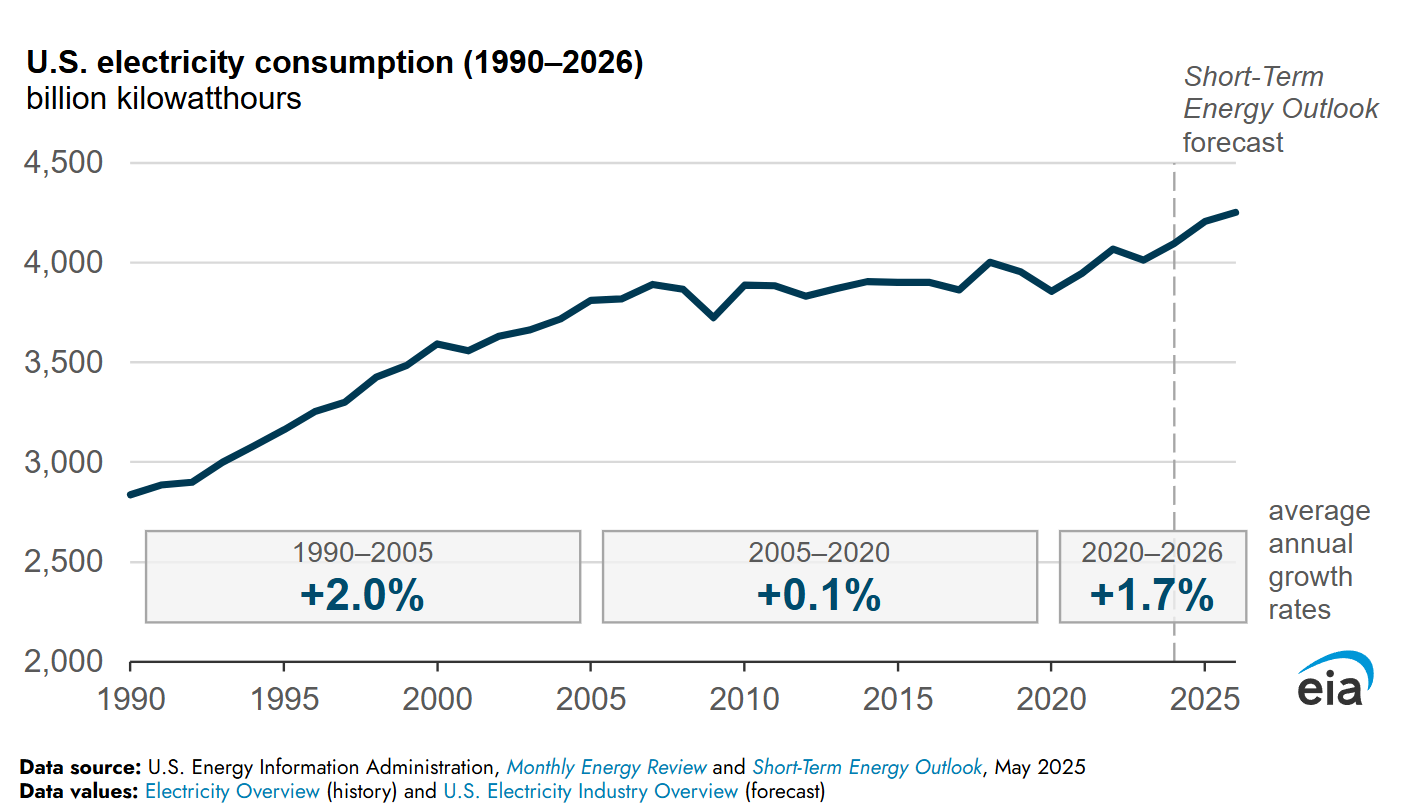
Data center load growth has tripled over the past decade and is projected to double or triple again by 2028, and that is before the AI capex cycle really hits the grid; most of the capital being deployed now won’t go online for full power draw for another two years at least, if not more before they are fully scaled. For context, Meta’s (META) Hyperion data center that broke ground in 2024 won’t be up and running until 2028 and won’t be fully scaled up until 2030, although it is particularly large so smaller operations will take less time.
In net, it’s a massive shift in growth for the sector. S&P Global’s 451 Research has U.S. data center grid demand climbing from ~60 GW last year to over 75 GW this year and 134 GW by 2030.
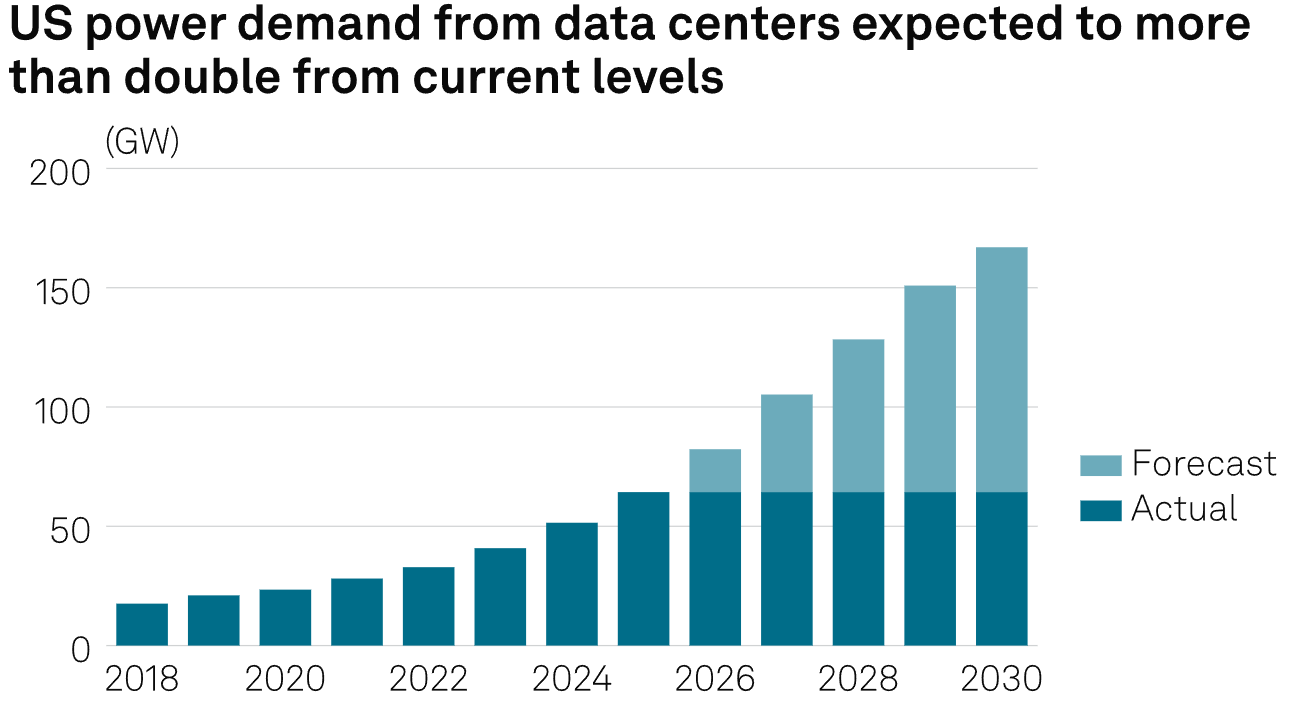
That’s a structural shift, not a cyclical one. Hyperscalers can’t run their AI training runs without power, and the grid was not built for this. The utilities that happen to sit in the right service territories, like American Electric Power Co. (AEP) in Ohio and Virginia, Dominion (D) in Virginia, NextEra (NEE) in Florida and Texas, and Constellation (CEG) and Vistra (VST) with their nuclear fleets, are looking at multi-decade load growth locked in by service agreements. That is the dream scenario for a rate-regulated utility. CapEx goes up, the rate base grows, and earnings compound with it.
You can see the market already pricing this in. XLU is up significantly over the last year, and the fund’s top holdings have been among the best performers in the S&P 500. This is not the defensive, bond-proxy sector it used to be.
The 10-Year Yield Is the Ceiling
Here’s where it gets a little murky, because if the thesis were so cleanly bullish, then there would be no trade.
Utilities still trade like bonds, even if their service demand is growing like tech. The dividend yield on XLU is 2.6%, and the largest component of total return historically comes from that yield plus the regulated earnings growth. That’s great considering the S&P 500’s yield is less than half of that. But it’s far less impressive and interesting when you’ve got bonds this high.
The 10-year Treasury offers 4.3% risk-free, and the relative appeal of a 2.6% utility yield just compresses. Capital has to decide, and the capital most interested in these names is hesitant to buy into them as aggressive positions. Historically, investors have long considered utilities defensive names to be bought up in bearish conditions.
The 10-year has a deeper effect on utilities. See, utility capex is primarily financed with debt. These are capital-intensive businesses with massive bond issuance programs; since they have regulated, stable growth, this isn’t usually an issue for investors.
But when the 10-year rises, their cost of capital rises with it. The higher the long end of the Treasury curve goes, the more of that AI-driven rate base growth gets eaten by interest expense. That’s how a great fundamental story gets stuck and why a 10-year yield that has risen since the start of the U.S.-Iran war has pushed utilities lower.
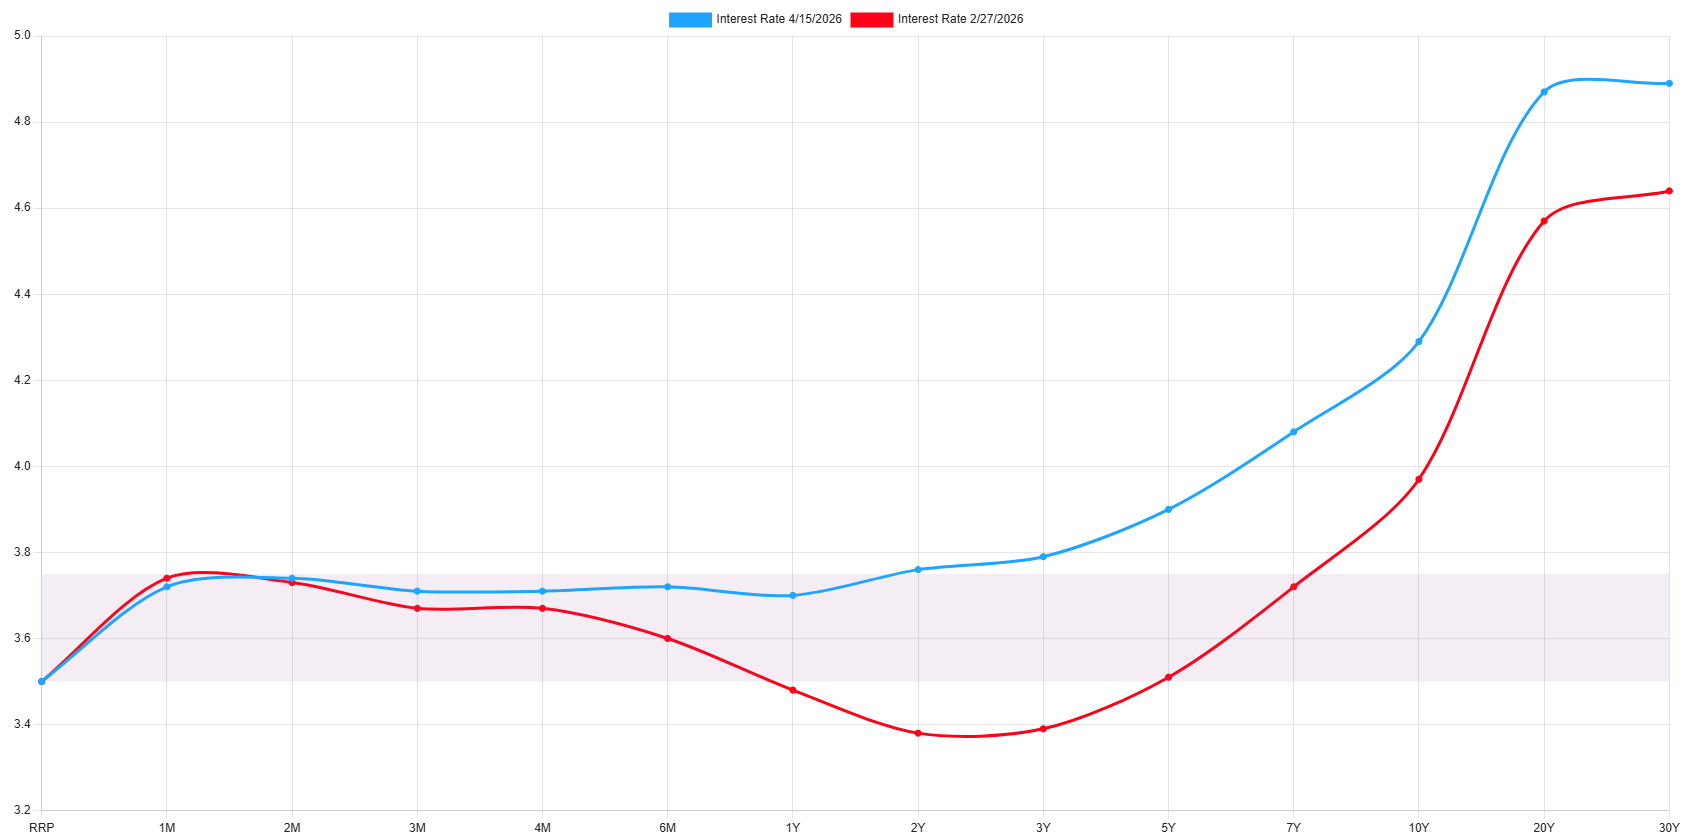
The 10-year yield has risen quickly, but in fact, the entire curve has shifted up.
The 10-year is at 4.3%, and it’s unclear how much breathing room it has given the current uncertainty still baked into the macro picture.
The Fed has emphasized that rates are staying higher for longer, and the bond market has been policing the long end independent of what the Fed does with the funds rate. If 4% is the floor for this cycle, XLU has a ceiling near its all-time high. If yields break meaningfully lower—say, a sustained move under 4.0%—the ceiling lifts, and XLU has room to run into uncharted territory.
The relationship is not perfect tick-for-tick, but over the last three years, XLU has struggled to make new highs when the 10-year is above ~4.25% and has run freely when it is below 4.0%.
XLU Technical Outlook
Here is the 1-year daily chart for XLU with the VWAP anchored to the September 2022 lows:
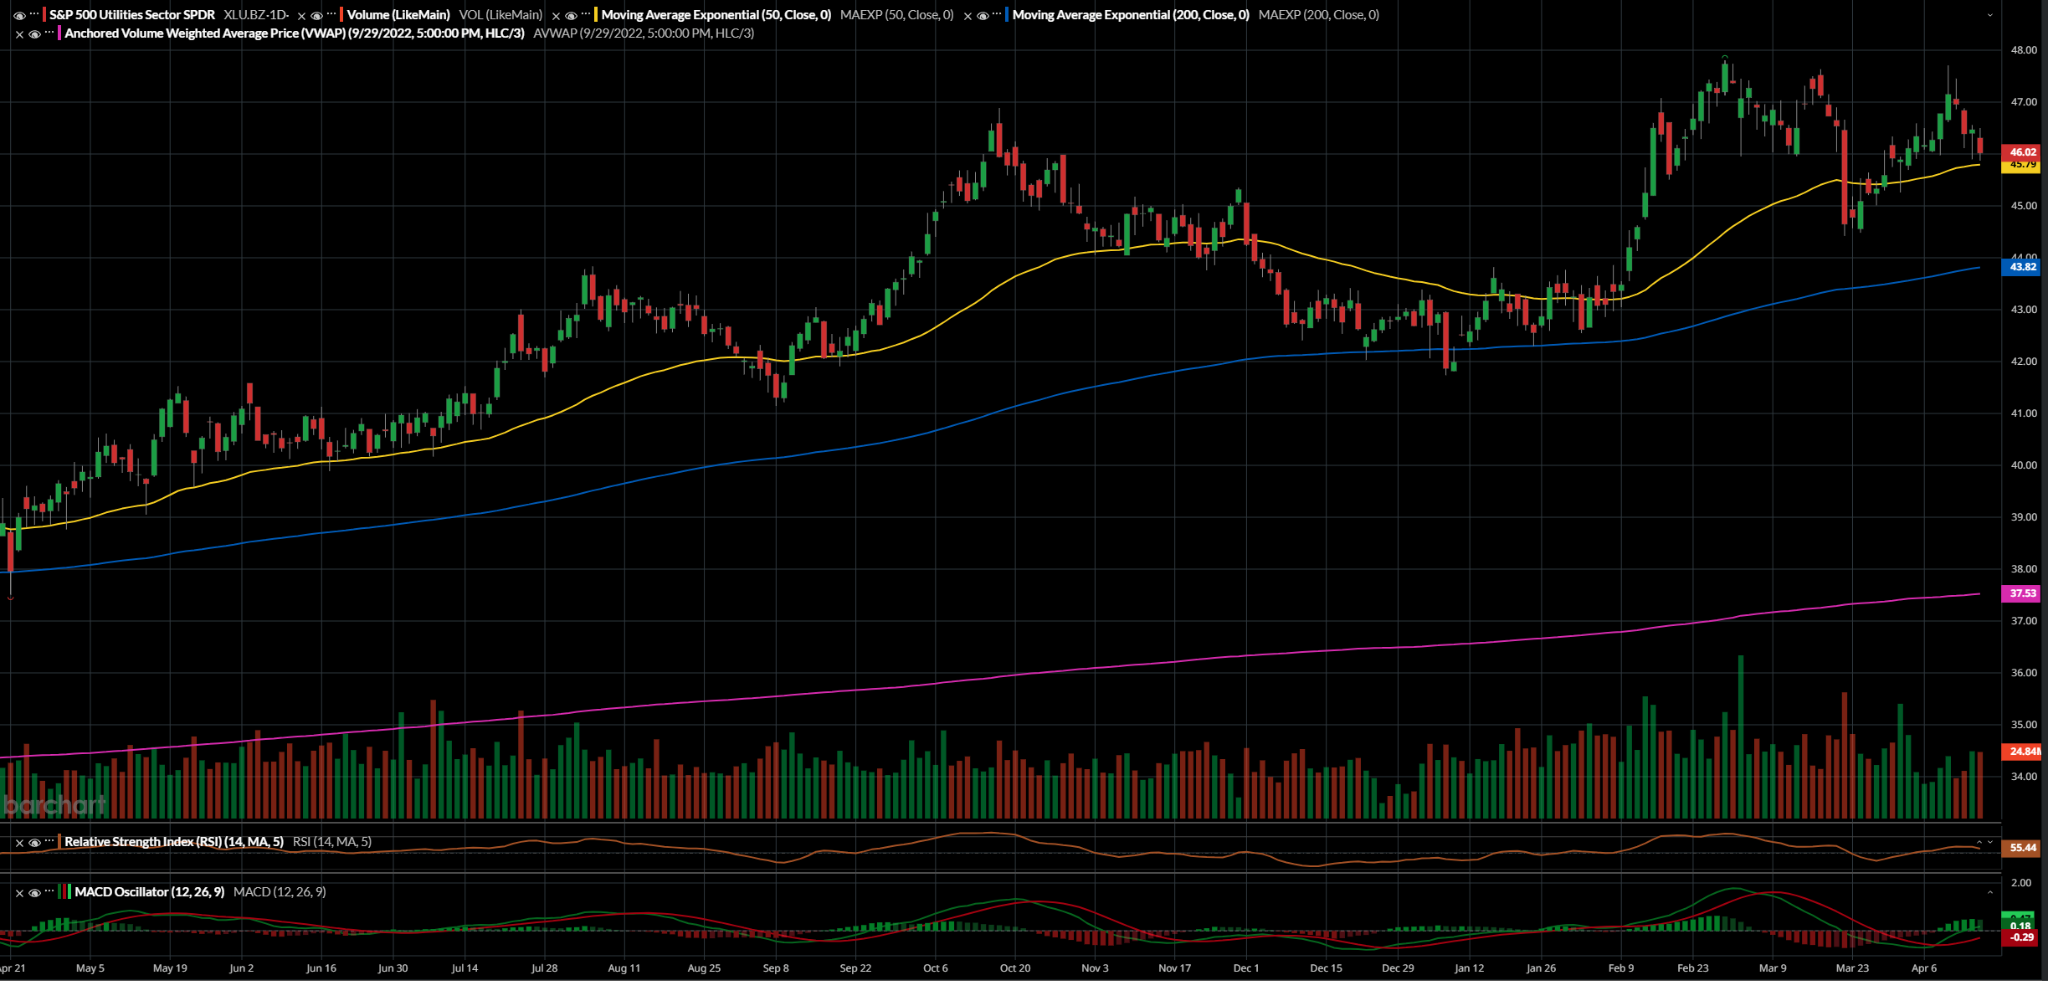
The structure is clean in the long term: higher highs, higher lows, a 50-EMA acting as dynamic support throughout the rally, and a 200-EMA anchoring the one time it broke the 50-EMA’s support in December.
XLU tagged its all-time high at 47.80 in late February, then pulled back as yields backed up and the broader risk-off wave hit during the U.S.-Iran war. The fund held the 50-EMA at the 45.50 zone on the first retest in March, which is the bullish playbook working exactly as it should. It has since consolidated in the ~46 range.
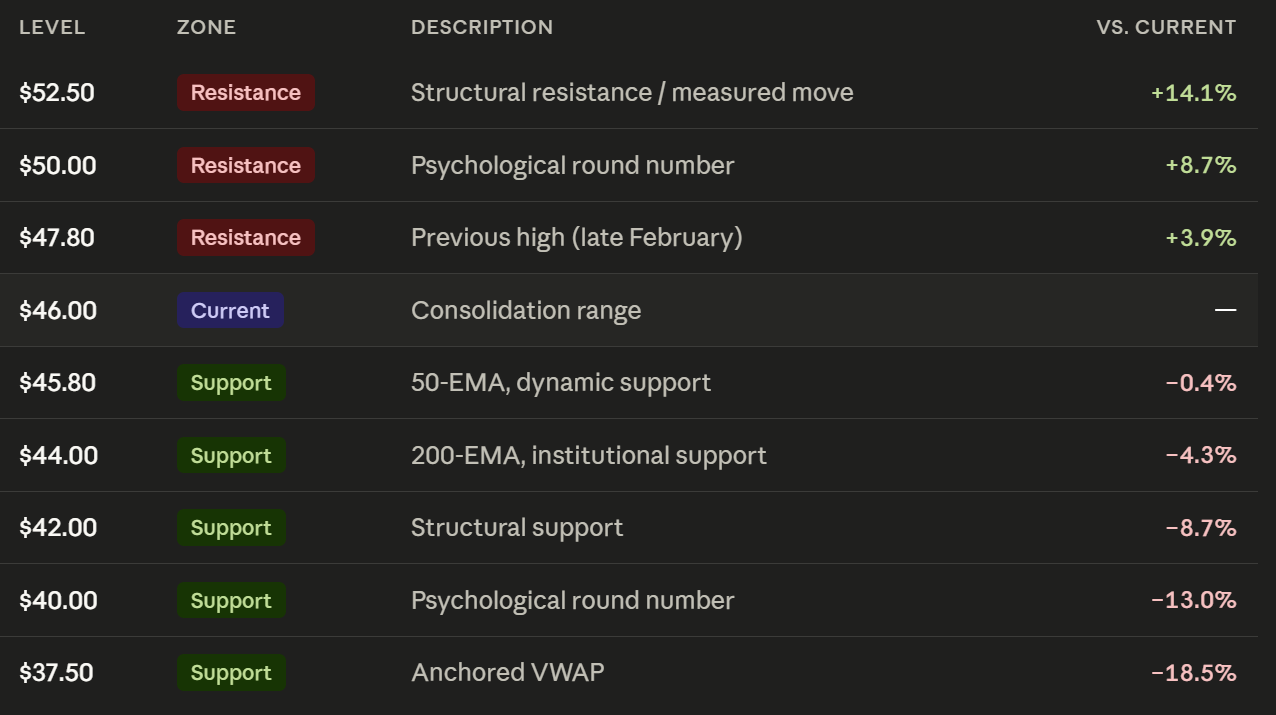
The 50-EMA sits at 45.80 and looks to be tested in the coming days. This is the level bulls need to defend, and likely will given the favorable momentum conditions; failure here would be dire.
For bears: a decisive close below 45.80 breaks the 50-EMA and invites a retest of the 200-EMA at ~44. Below that structural support is weaker, with ~42 and then ~40.50 in play as key support levels to watch. If nothing else holds, the anchored VWAP sits at ~37.50, which should provide a key level for institutional support.
For bulls: the 50-EMA has to hold, and a reclaim of 47 with conviction (above-average volume) is the signal that the consolidation is over. Above 47.80, the trade is fully back on and the next leg can play out. 50 becomes a natural psychological barrier, with 52.50 looking to be a structural resistance level above that—but again, that is uncharted territory. And none of that happens without cooperation from the 10-year. A move in yields below 4.0% would very likely be the catalyst.
Here are the key levels to watch:
Conclusion
Utilities are not the trade they used to be, in some ways but not in others. The AI data center buildout has turned a flat-demand sector into the one place in the market where regulated monopolies get to participate in the supercycle, and the XLU ETF has been repriced accordingly. The fundamental case is intact and will likely remain so for years, because grid buildouts take a decade and the demand is already here. The question is can it go higher, and the answer depends on the 10-year Treasury.
The 10-year’s yield is the gating factor for any new leg higher. At 4.3%, utilities are boxed in between a compelling fundamental story and a bond market that refuses to give them room to breathe. The Fed’s higher-for-longer posture and long end of the curve pricing in future inflation means that this ceiling is not lifting without either a meaningful growth scare or a credible disinflation path. Neither looks imminent.
But traders are working to make money in either scenario. Consider that buying XLU at 46 and hoping for a breakout to new highs requires you to also be bullish on a yield decline, and that is a bet on macro rather than on utilities themselves. The cleaner entry is either a pullback to the 200-EMA at 43.80 with the 10-year still elevated (the setup where you get paid to be patient) or a confirmed breakout above 47.80 on volume after yields break under 4.0% (the setup where macro is validating the move). Buying in the middle of the range, which is where we are now, is the least favorable spot. Patience will reward prudent traders with this one.