


AUD/USD
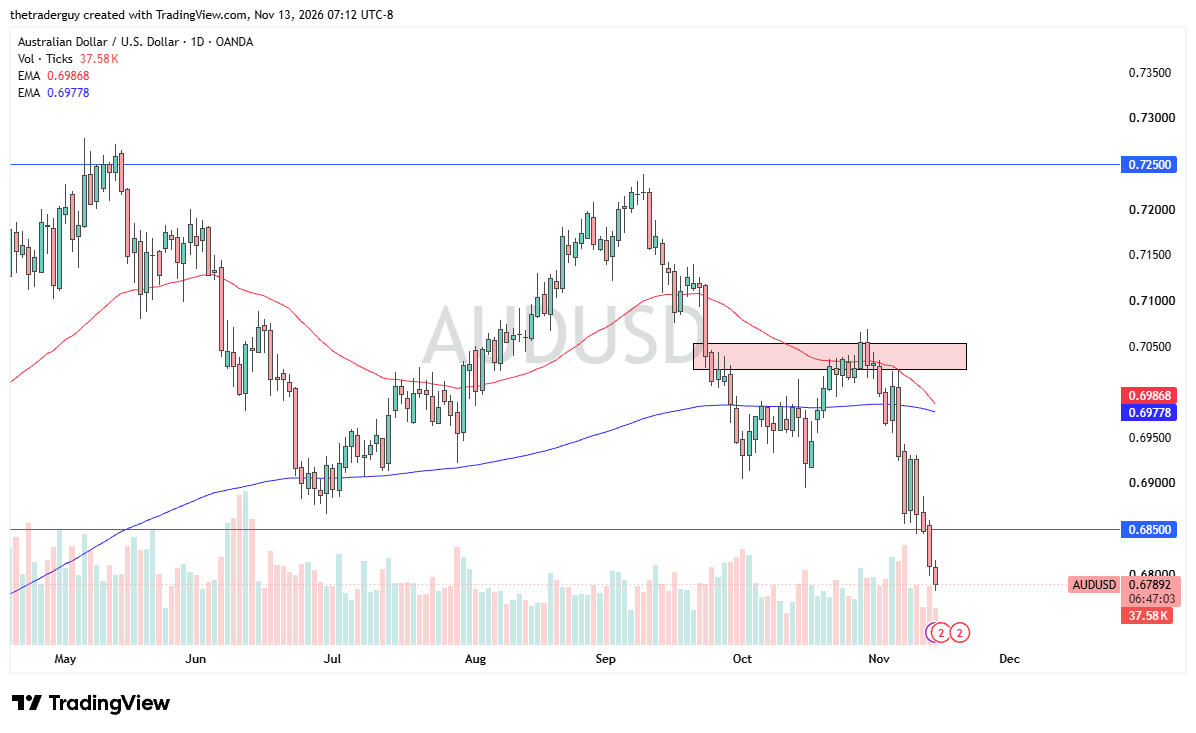
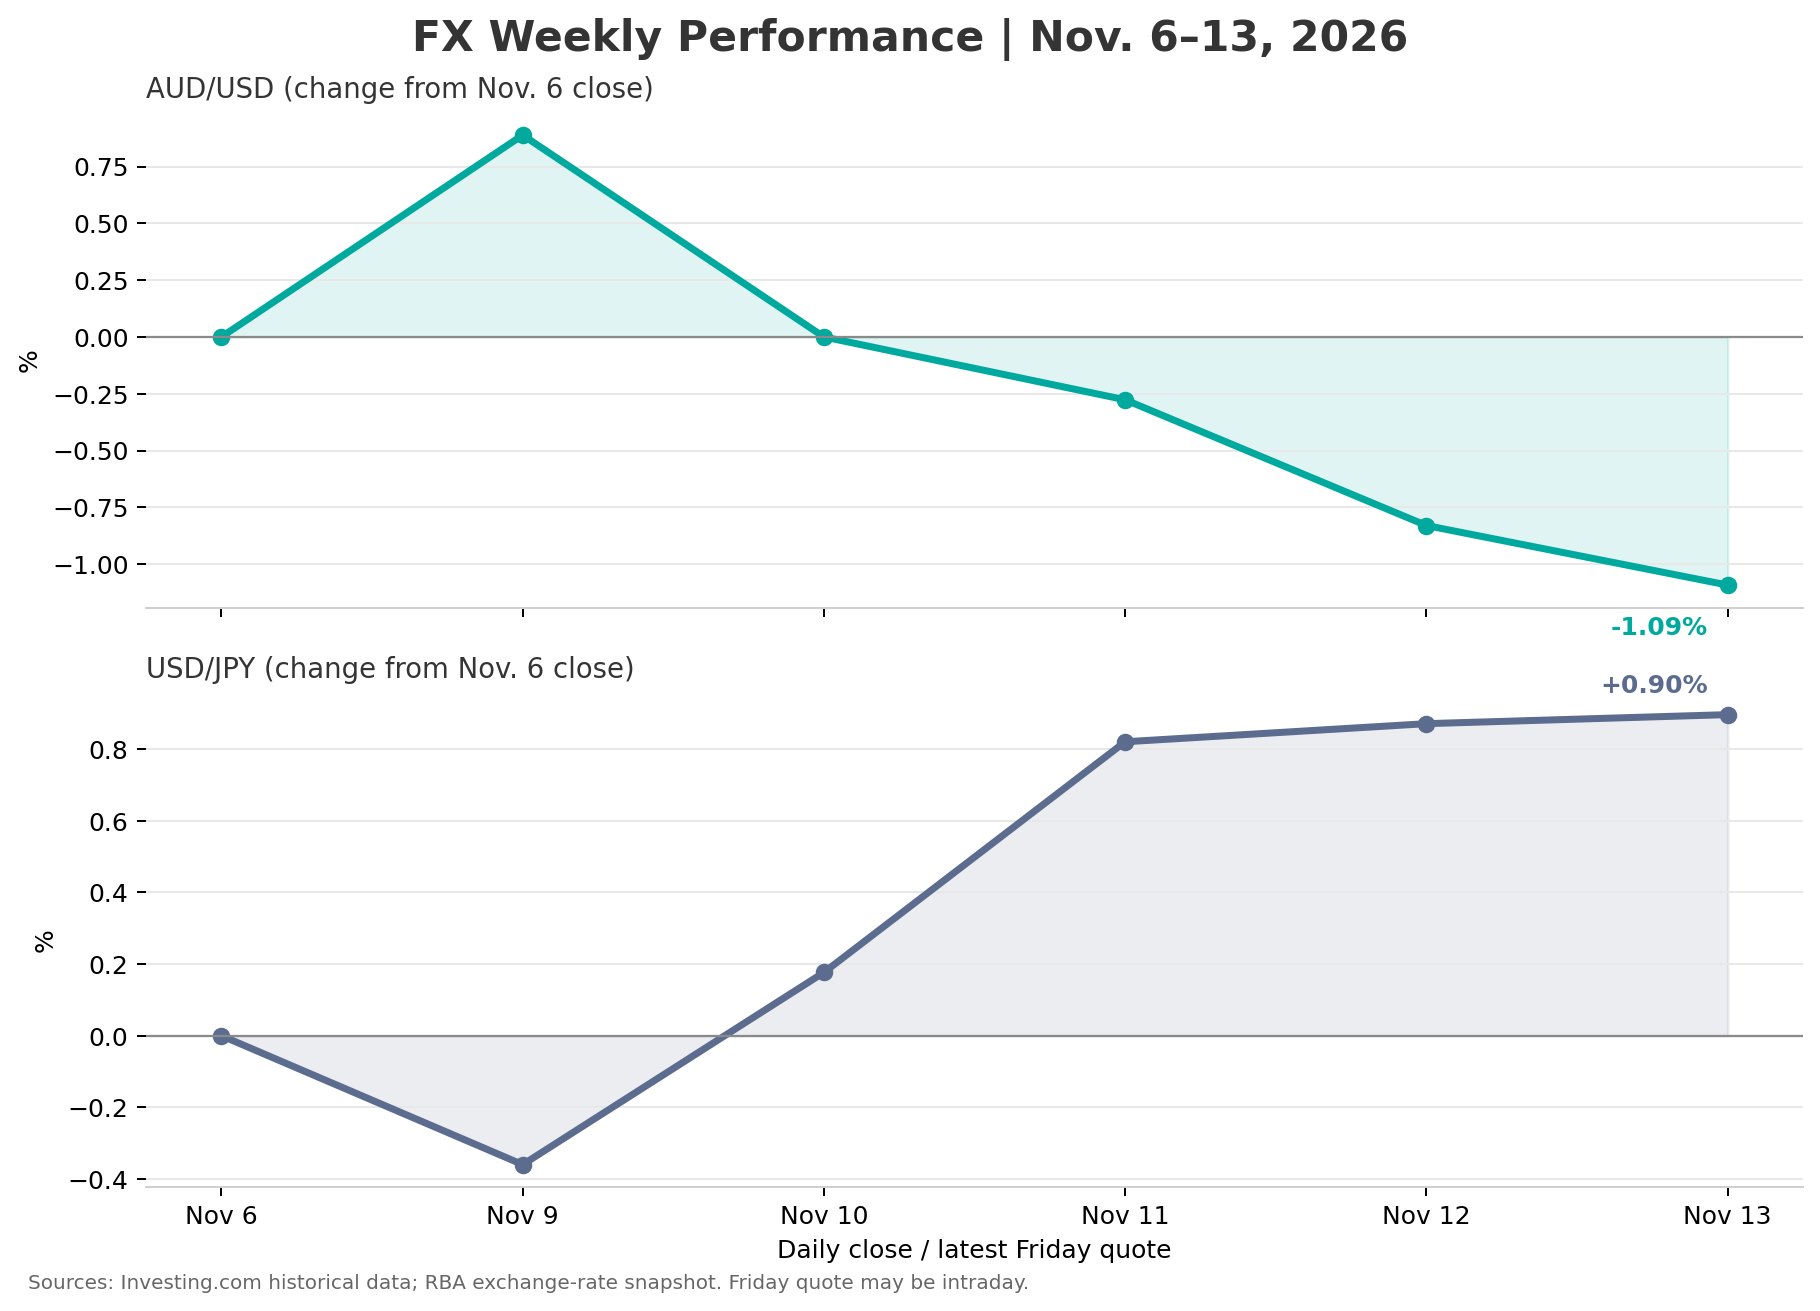
The Australian dollar continues to fall against the U.S. dollar, which makes a certain amount of sense considering that real yields in America continue to climb. In other words, traders get paid to hold U.S. debt over inflation figures. It’s a real return, and therefore the U.S. dollar becomes much more attractive.
Furthermore, the PPI numbers came in with final demand rising 0.3% in October, below September’s revised 1.4% in America, but the annual rate has accelerated to 6.5%. In other words, the Federal Reserve has to worry about inflation. I continue to fade rallies as they occur.
USD/JPY
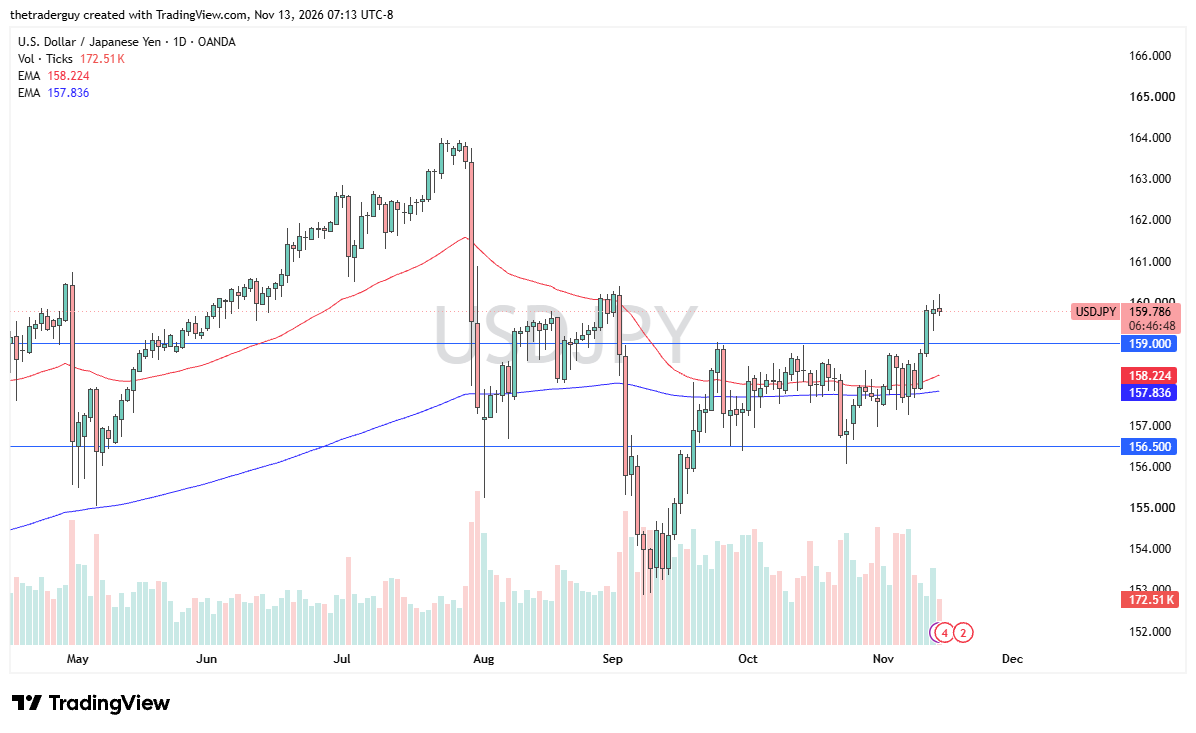
The U.S. dollar against the Japanese yen is a little choppier at the moment, but that makes sense. We’re trying to bust through this area of intervention by the Bank of Japan just above the ¥160 level, and we’ve seen a huge push to the upside. It looks like we’re consolidating, pressuring this area, trying to break through that area of significant supply.
Technically speaking, the ¥160 level is roughly the pivot point. Tokyo has warned against the sudden acceleration, and Finance Minister Satsuki Katayama out of Japan said that officials were ready to respond to volatility after the yen crossed ¥160 to the dollar. This, of course, has the market somewhat spooked. They have intervened several times.
That being said, economics is still a thing. Reality is still a thing. The Bank of Japan can distort the market, but over time, as long as real rates in the United States remain positive, there are people out there willing to take advantage of the carry trade. I’m one of them. I like the idea of buying pullbacks, especially closer to ¥159, if we get that opportunity.
Copper
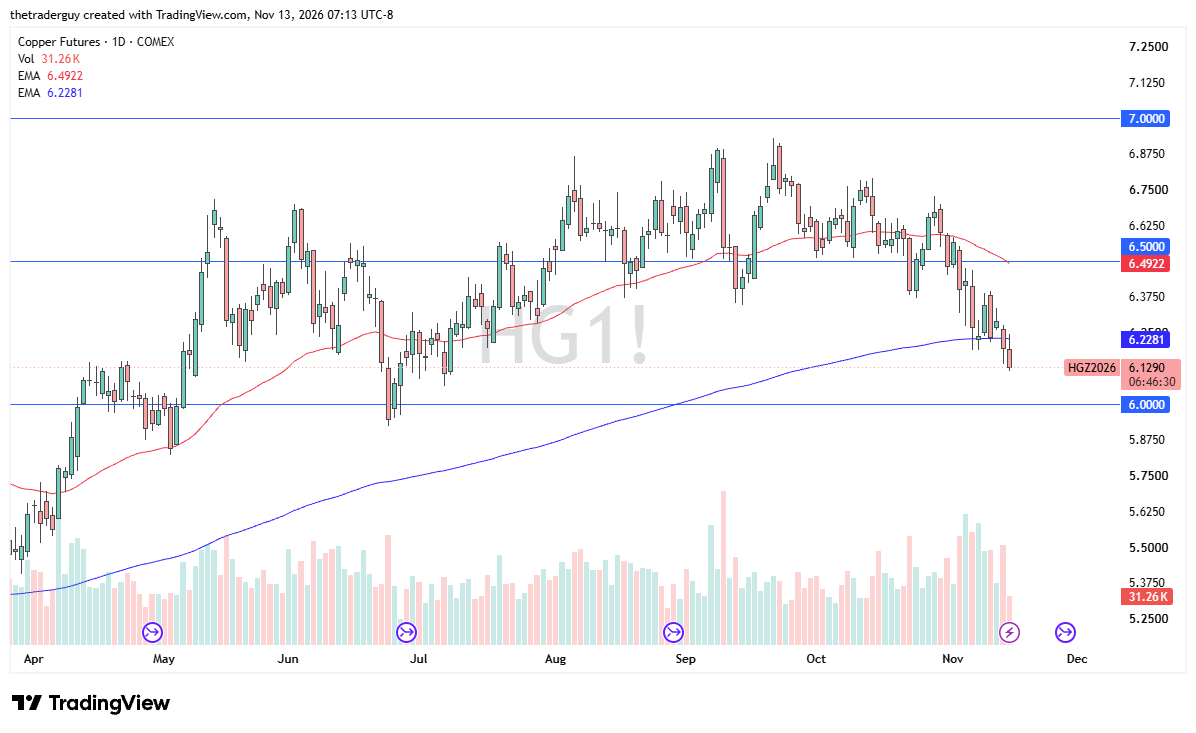
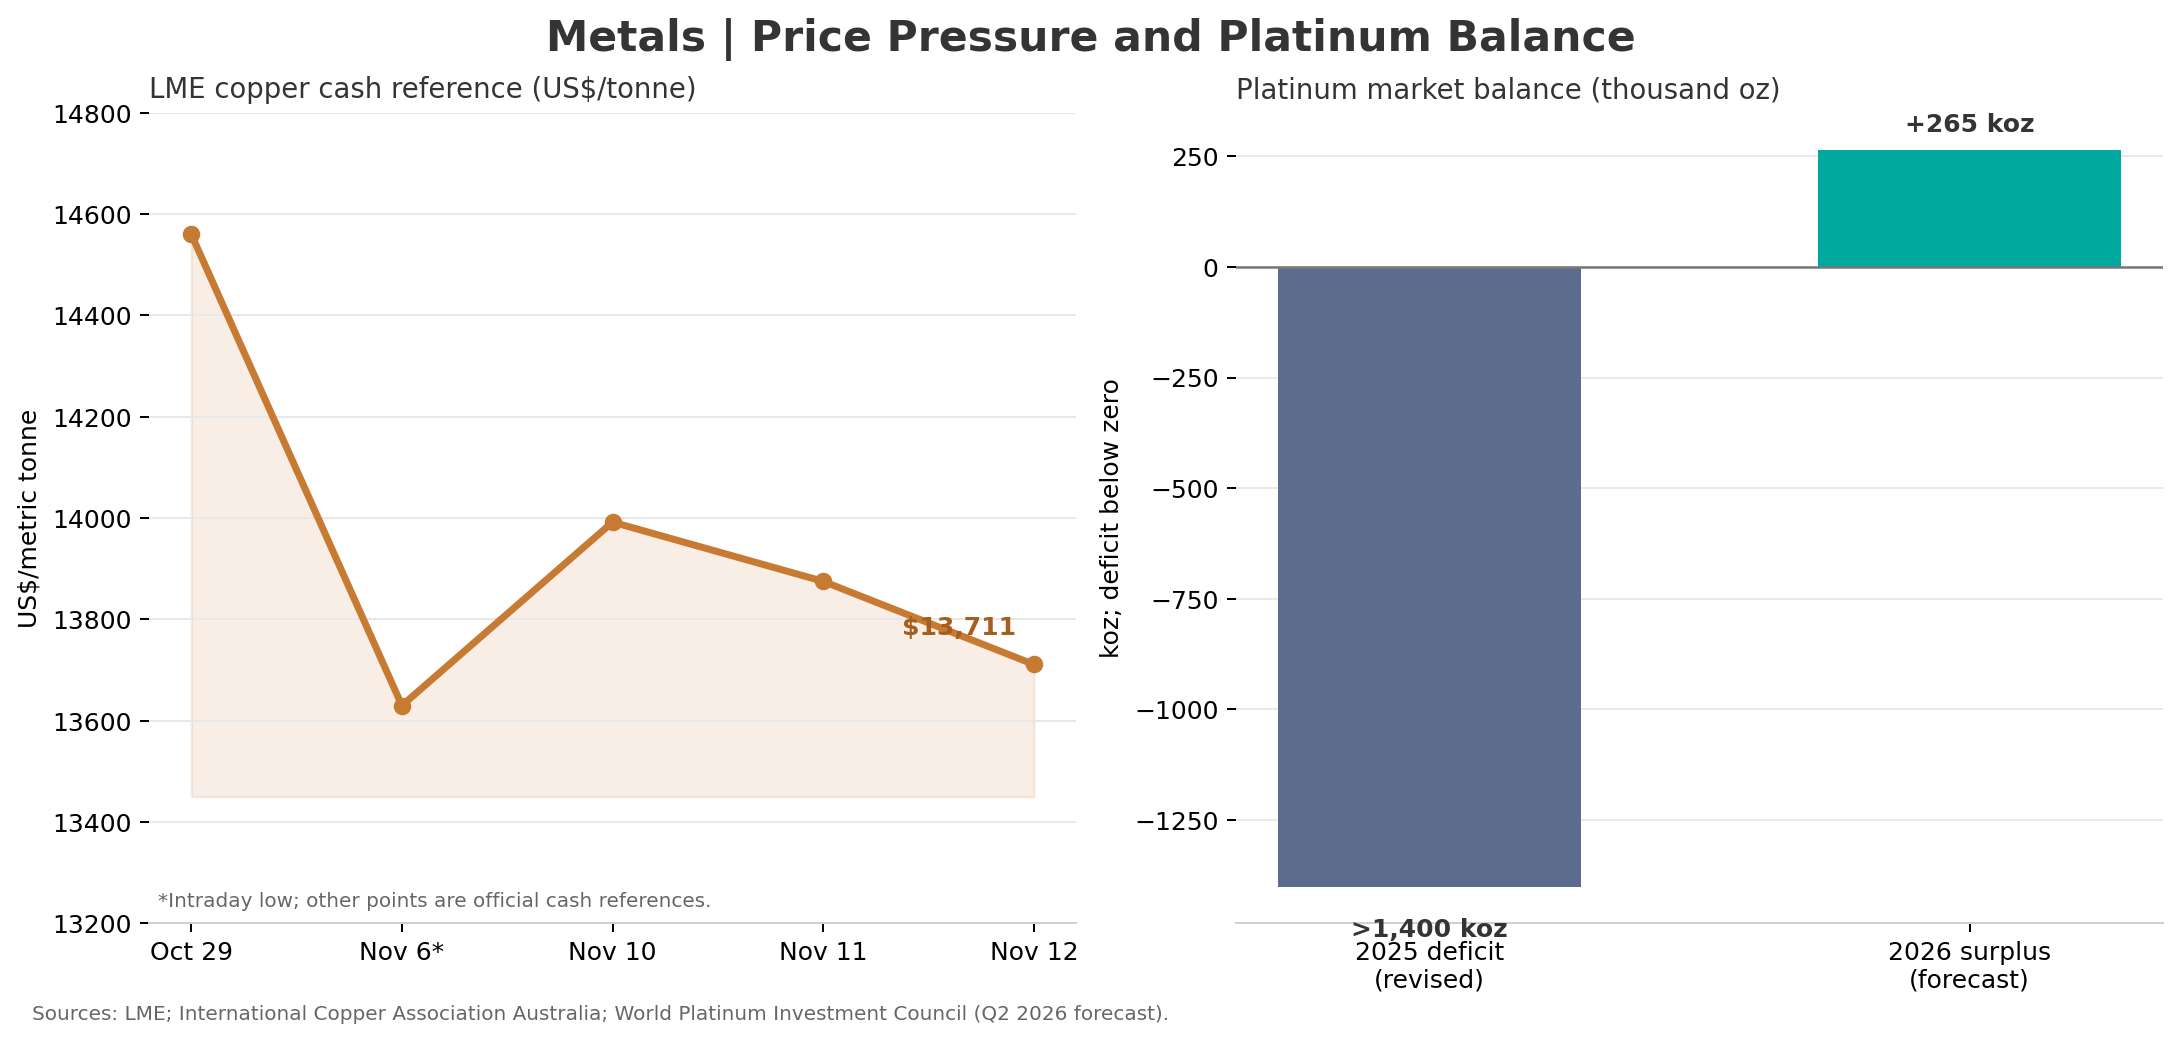
Copper remains caught between a weakening financial trade, meaning real rates, and a tight Asian physical market. At this point in time, the market looks like it is playing the financial situation more than the physical situation. Quite frankly, the physical picture is not really bearish at all.
AUD/USD Price Forecast
Every new AUD/USD analysis as it publishes, today's technical signal and key levels, live price — on one page.
See all AUD/USD forecastsShanghai Futures Exchange stocks fell 24% in the week to November 6, to 33,848 tons. This means that there is a growing lack of supply in Asia. Chinese buyers are paying up for copper. The import premium has reached $230 a ton, so I suspect it is probably only a matter of time before we see buyers come back in.
I’ll be eyeballing this $6 level. I really don’t like shorting copper. I understand part of this is the AI trade unwind. Those who wish to short copper might aim for $6, but I think $6 is going to end up being rather important support. I’m more or less just watching today, but if we get anywhere close to that, I might be willing to have a swing at it.
Platinum
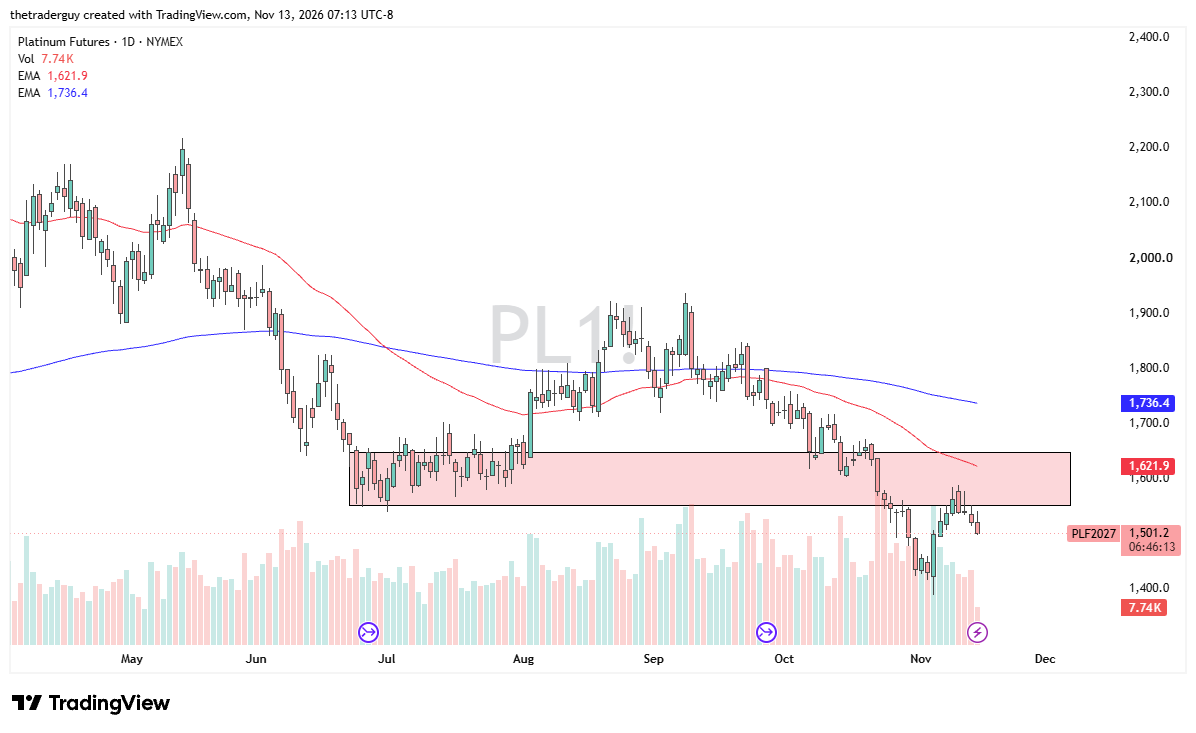
And finally, platinum tried to rally early during the session, but we can see it remains a fade-the-rally market. I feel the same way about this as I do about silver or gold or anything else. Higher yields and a firm U.S. dollar continue to work against it.
I do not have any interest in trying to own platinum at the moment. Someday down the road, maybe, but right now I look at the $1,600 level as a massive ceiling. We are $100 below there as I record this video.
The next main catalyst would be the World Platinum Investment Council Q3 quarterly report on November 18. Its latest Q2 assessment forecasts a 265,000-ounce surplus for the full year, including 83 ounces of net investment outflows. That being said, the prior year’s deficit exceeded 1.4 million ounces, leaving projected above-ground stocks at only 3.5 months of global supply by the end of this year.
I do think platinum becomes a big play eventually, but right now I’m fading short-term rallies for short-term targets.