


USD/CAD
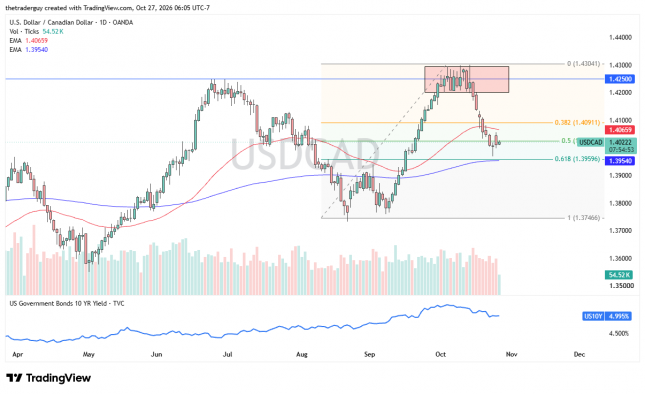
The U.S. dollar is trading against the Canadian dollar, with the market bouncing around the 50% Fibonacci retracement level and between the 200-day and 50-day EMA indicators.
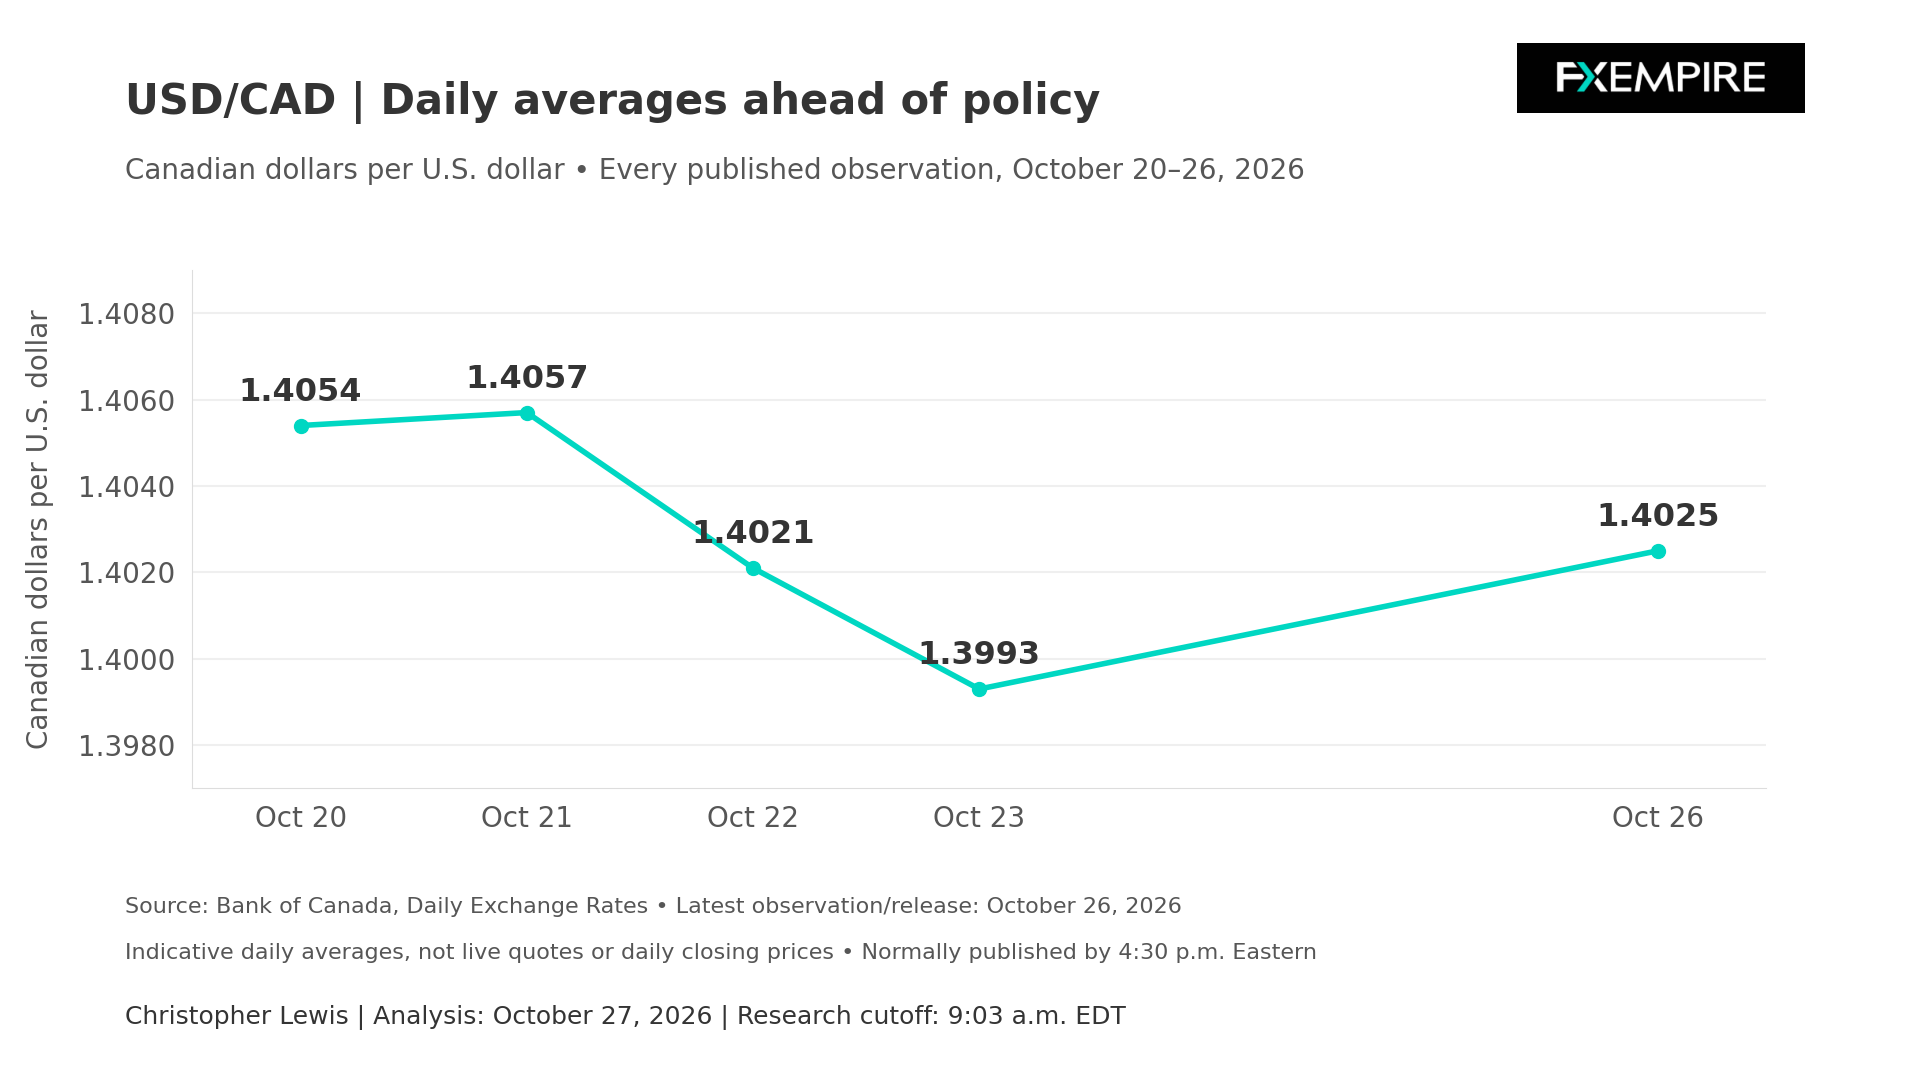
It’s interesting because we do have both a Federal Reserve and Bank of Canada announcement this week. But when I look at this pair, it has already, I believe, priced in the idea of the Bank of Canada adding 25 basis points. This will come down to the ball being in the court of the Federal Reserve, would be my suspicion.
If they sound hawkish, it could turn things right around. If the Federal Reserve does, in fact, hike, which they’re not expected to do, that could really get the thing moving. The business outlook survey in Canada did show that overall sentiment has improved, but the other thing, of course, that weighs against the Canadian dollar is the fact that the jobs report was so horrific.
So, I’m watching this area. A break above the 50-day EMA has me interested in going long.
USD/CHF
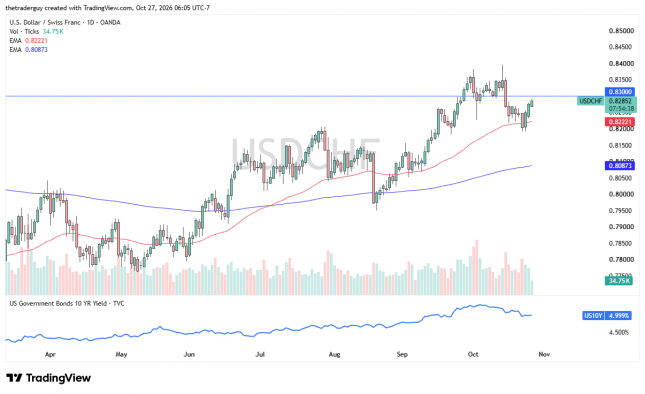
The U.S. dollar is rising against the Swiss franc again, and the situation, of course, is all about the interest rate differential, as the FOMC set the latest target range in the United States between 3.75% and 4% on September 16th.
It does still have a situation on the other side of the Atlantic where the Swiss National Bank’s September decision left its policy at 0%. The quarterly bulletin by the Swiss National Bank also suggested that it was willing to intervene in the foreign exchange markets as necessary, although it did not state a particular level.
If we can break above the 0.83 level, I think we continue to see a bounce from the 50-day EMA, and we get paid at the end of every day. This is one of my favorite pairs to be long of at the moment.
AUD/USD Price Forecast
Every new AUD/USD analysis as it publishes, today's technical signal and key levels, live price — on one page.
See all AUD/USD forecastsAUD/USD
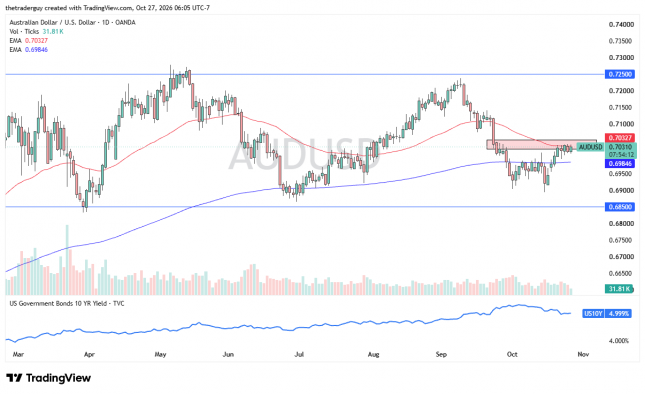
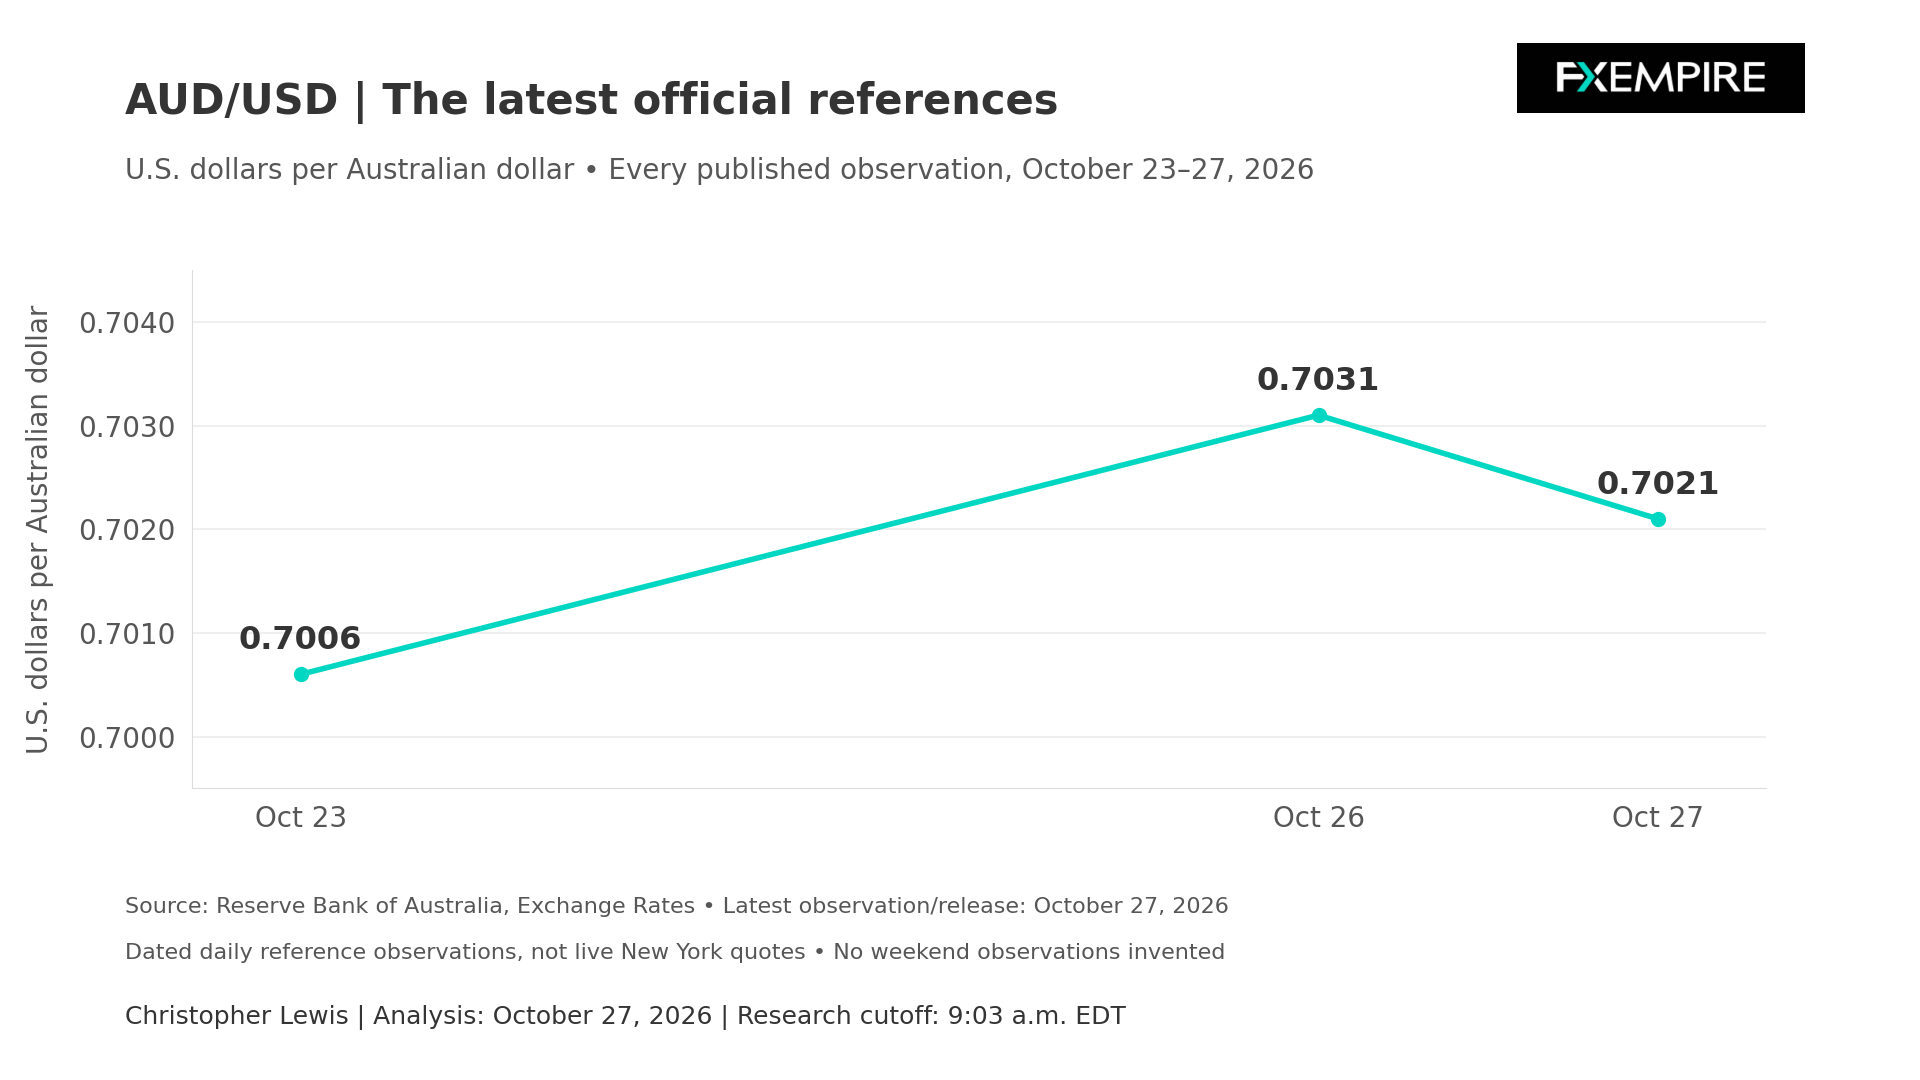
The Australian dollar has CPI coming out early tomorrow, and the market is likely to pay close attention to that. But at the same time, we have a Federal Reserve decision late tomorrow, so a little bit of stasis here makes a certain amount of sense.
If we can break above the 0.7050 level, then I think the Aussie has some room to run, maybe 50, 60, possibly even 75 pips. Once we get closer to the Federal Reserve interest rate decision, though, I think things will settle back down.
A breakdown below the 200-day EMA could have me short. We’ll just have to see what that CPI number tells us. If it’s horrific, then that could send things lower.
GBP/USD
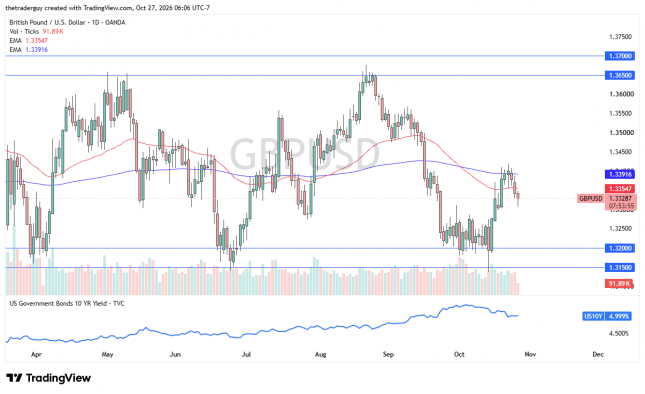
And finally, the British pound looks like it is trying to bounce after an initial fall. The Bank of England is a bit cautious at the moment. It says that its September CPI inflation is 3.5% year over year, up from 3.1% in August, which provides a little bit of resiliency to the British pound in relation to other currencies.
The fact that we are bouncing the way we are does have me interested in going long here, but I don’t look for the world. I think maybe a return to the 1.34 level could be in the cards. But the closer we get to that Federal Reserve meeting, the less interested I am in having a position on in a range-bound market like this.
So, it doesn’t affect my longer-term holdings.