Advertisement
Advertisement
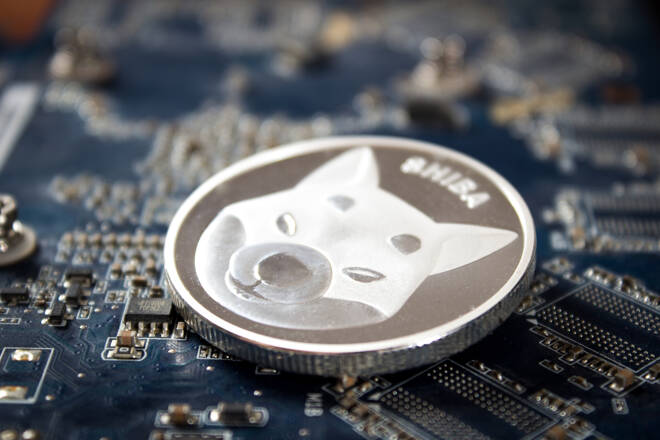
SHIB Eyes the November High of $0.00001364 on Shibarium Upgrade
By:
SHIB was in breakout mode this morning, with DOGE in tow. While there were no network updates, the anticipated Shibarium upgrade remains the key.
Key Insights:
- Dogecoin (DOGE) and shiba inu coin (SHIB) had a mixed session on Tuesday, with SHIB rising by 0.19% to buck the broader market trend.
- US recession jitters weighed, though investor sentiment toward the Shibarium upgrade continued to provide SHIB price support.
- The technical indicators remain bullish, signaling further price gains.
Dogecoin (DOGE) fell by 0.96% on Tuesday. Following a 2.79% loss on Monday, DOGE ended the day at $0.0829. DOGE avoided sub-$0.0800 for the fourth consecutive session despite the bearish session.
A bearish start to the day saw DOGE fall to an early low of $0.0820. Steering clear of the First Major Support Level (S1) at $0.0808, DOGE rose to an early afternoon high of $0.0852. However, coming up short of the First Major Resistance Level (R1) at $0.0874, DOGE fell back to end the day in the red.
Shiba inu coin (SHIB) rose by 0.19% on Tuesday. Partially reversing a 1.13% loss from Monday, SHIB ended the day at $0.00001055. SHIB avoided sub-$0.000010 for a second consecutive session.
Tracking the broader market, SHIB fell to an early morning low of $0.00001025. Steering clear of the First Major Support Level (S1) at $0.00001005, SHIB rose to an early afternoon high of $0.00001082. However, falling short of the First Major Resistance Level (R1) at $0.00001103, SHIB fell back to end the day at $0.00001055.
Shiba Inu Targets $0.000013 in a Breakout Morning
It was a quiet Tuesday session for DOGE and SHIB, with no network updates to provide direction. SHIB found support after a bearish Monday, with the anticipated Shibarium upgrade driving demand.
However, DOGE saw red for a second consecutive session, weighed by uncertainty over Twitter’s integration plans and a broader crypto market pullback.
SHIB was in breakout mode this morning, with DOGE also on the move. However, there were no updates from the Shibarium Network or the Dogecoin Foundation to deliver the early price action.
News of SHIB making it to the top ten most purchased tokens among the 500 biggest ETH whales over the last 24 hours may have contributed to the bullish start to the day. SHIB was also reportedly the biggest token position by dollar value for the top 100 ETH whales.
Today, network updates remain the key drivers. However, a lack of updates would leave the broader crypto market to provide direction in the afternoon session. US economic indicators and corporate earnings will draw interest alongside regulatory chatter.
Dogecoin (DOGE) Price Action
At the time of writing, DOGE was up 5.07% to $0.0871. A bullish start to the day saw DOGE rally from an early morning low of $0.0828 to a high of $0.0877.
DOGE broke through the First Major Resistance Level (R1) at $0.0847 and the Second Major Resistance Level (R2) at $0.0866.
Technical Indicators
DOGE needs to hold above R2, R1, and the $0.0834 pivot to target the Third Major Resistance Level (R3) at $0.0898 and the Saturday high of $0.0912. A return to $0.0880 would signal an extended breakout session. However, the crypto news wires and network updates need to be DOGE-friendly to support further gains.
In the event of an extended rally, the bulls would likely test resistance at $0.10.
A fall through the Major Resistance Levels and the pivot ($0.0834) would bring the First Major Support Level (S1) at $0.0815 into play. However, barring an extended sell-off, DOGE should avoid sub-$0.0810 and the Second Major Support Level (S2) at $0.0802. The Third Major Support Level (S3) sits at $0.0770.
The EMAs sent a bullish signal, with DOGE sitting above the 50-day EMA, currently at $0.0819. This morning, the 50-day EMA pulled away from the 200-day EMA, with the 100-day EMA converging on the 200-day EMA. The price signals were bullish.
A bullish cross of the 100-day EMA through the 200-day EMA would support a breakout from R3 ($0.0898) to target the Saturday high of $0.0926. However, a fall through the 50-day EMA ($0.0819) would give the bears a run at S1 ($0.0815). A fall through the 50-day EMA would signal a shift in sentiment.
Shiba Inu Coin (SHIB) Price Action
At the time of writing, SHIB was up 19.34% to $0.00001259. A breakout morning saw SHIB surge from an early low of $0.00001053 to a high of $0.00001269. SHIB broke through the Major Resistance Levels.
Technical Indicators
SHIB needs to avoid a fall through the Major Resistance Levels and the $0.00001054 pivot to target resistance at $0.000013. A return to $0.00001280 would signal an extended breakout session. However, the bulls would need risk-on sentiment to support an extended rally.
In the event of an extended rally, SHIB could test resistance at the November 4 high of $0.00001364.
A fall through Major Resistance Levels and the pivot would bring the First Major Support Level (S1) at $0.00001026 into play. However, barring an extended sell-off, SHIB should avoid sub-$0.000010 and the Second Major Support Level (S2) at $0.00000997.
The Third Major Support Level (S3) sits at $0.00000940.
The EMAs send a bullish signal, with SHIB sitting above the 50-day EMA, currently at $0.00001002. The 50-day EMA pulled away from the 100-day EMA, with the 100-day EMA widening from the 200-day EMA. The signals were bullish.
A hold above S1 ($0.00001026) and the 50-day EMA ($0.00001002) would support a breakout from the morning high of ($0.00001269) to retarget $0.000013. However, a fall through S1 ($0.00001026) would bring the 50-day EMA ($0.00001002) into view. A fall through the 50-day would signal a shift in sentiment.
About the Author
Bob Masonauthor
With over 28 years of experience in the financial industry, Bob has worked with various global rating agencies and multinational banks. Currently he is covering currencies, commodities, alternative asset classes and global equities, focusing mostly on European and Asian markets.
Advertisement
