


The fundamental picture for silver is currently divided between its exposure to industrial activity and its sensitivity to financial conditions. The most recent development was the Federal Reserve’s decision to leave the federal funds target range at 3.75% to 4% yesterday. Two policymakers, though, did prefer to raise rates.
For silver, that leaves a setting in which industrial resilience can support the demand narrative, while the cost of holding the asset due to its non-yielding properties remains a relevant issue.
Industrial Production
The latest U.S. industrial production release was published on October 16, reporting a 0.7% increase in total industrial production during September. Manufacturing increased 0.3%, mining increased 0.2%, and utilities increased 3.5%. Manufacturing output was 1.1% above the level last year, compared with 2.2% for total industrial production.
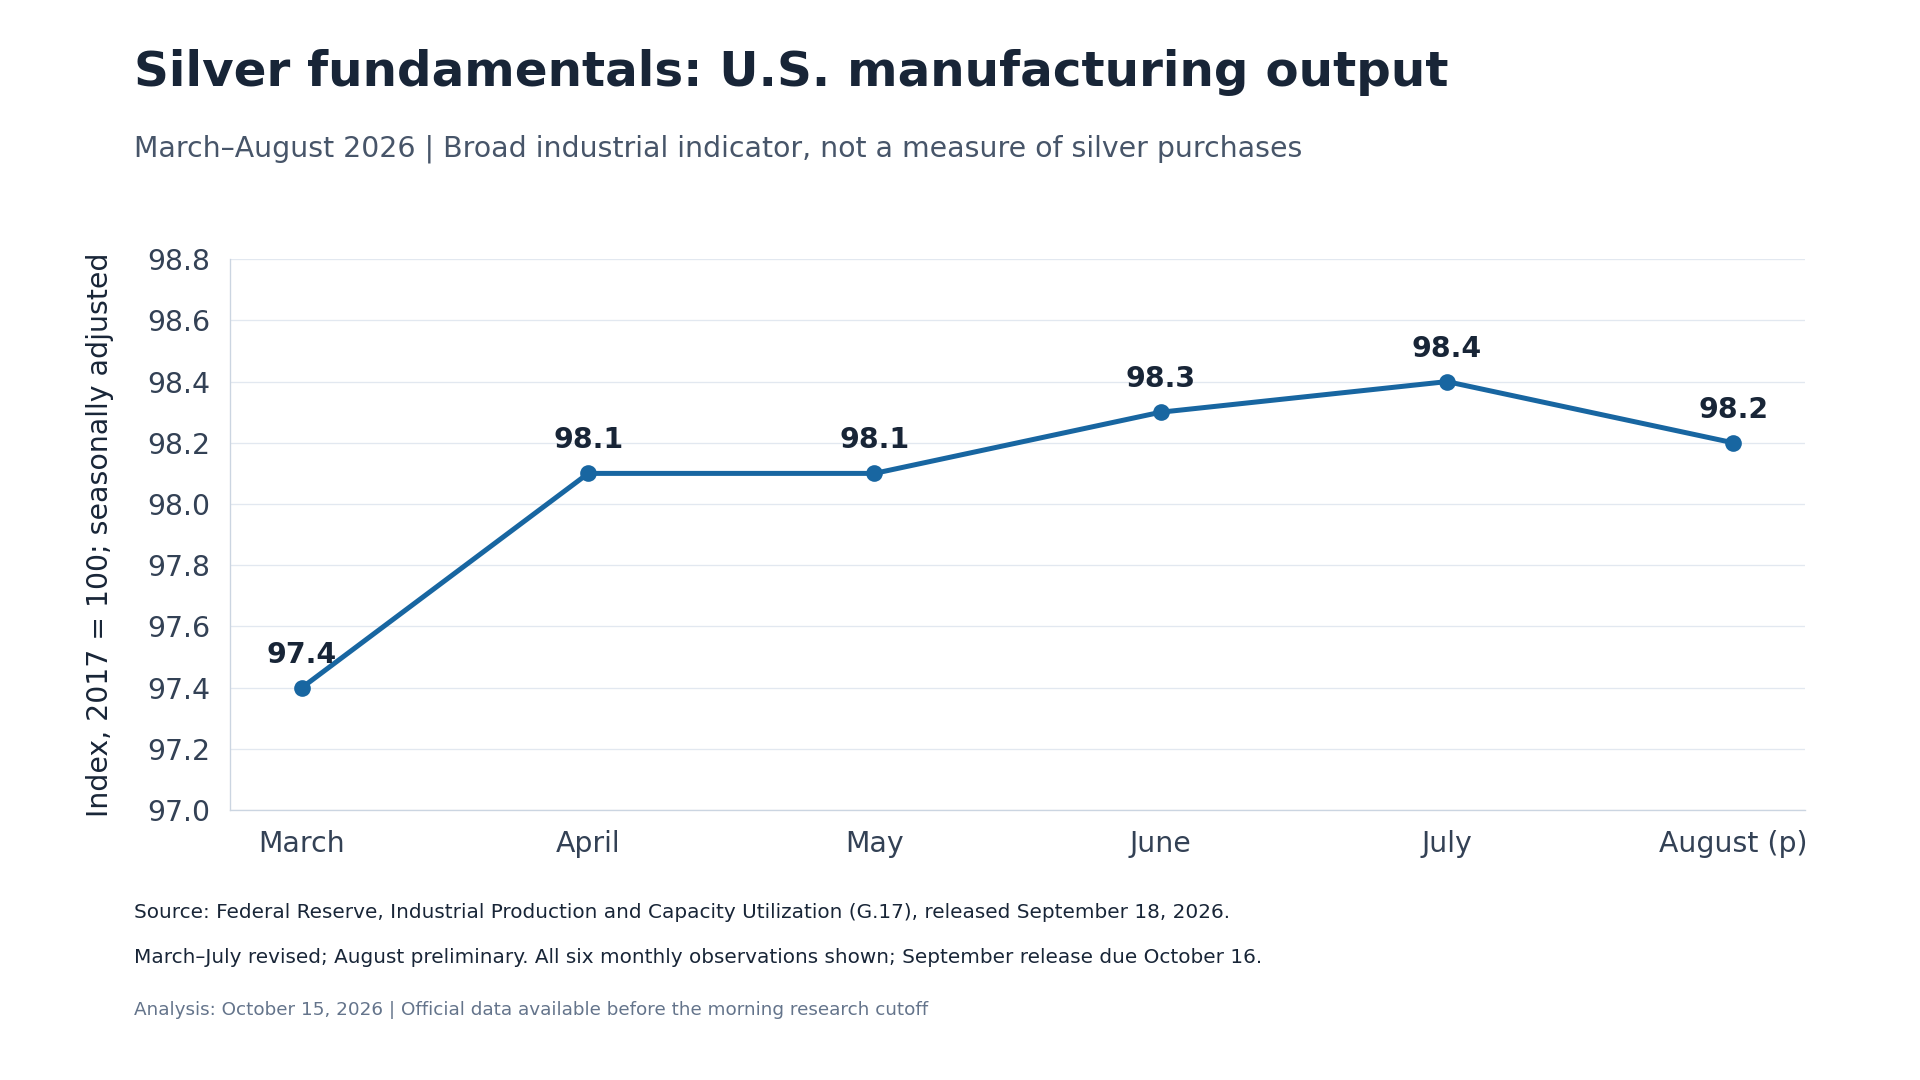
The chart follows the manufacturing index from April through September, the most recent reading, including every month in that range. The published readings were 98.1, 98.1, 98.4, 98.2, and 98.4, with the year 2017 equal to 100. The September number is preliminary, while the preceding observations have already been revised.
The Tension Is Pretty Straightforward at the Moment
The industrial backdrop is more accurately described as modestly resilient than as some type of manufacturing boom. The distinction matters, as the strong headline production increase contains a large utility contribution. Electricity output and manufacturing activity are different scenarios, and neither can be converted directly into ounces of silver demanded.
The longer-term industrial appeal needs to be looked at through broad expansion possibly helping silver, but not necessarily demanding it. The amount of metal used also depends on the mix of products, inventories, and substitution of quantity required to fuel the output. Higher activity does not necessarily produce an increase in silver purchases.
Silver Price Forecast
Every new Silver analysis as it publishes, today's technical signal and key levels, live price — on one page.
See all Silver forecastsMonetary Policy
On the monetary policy side, the 10-year real yield is at 2.67%. That was 3 basis points above the previous day’s reading, although below October 19’s 2.8%. This is a background to keep in mind when dealing with precious metals that do not produce any type of income.
Economic strength can support industrial activity while limiting the case for easier monetary policy. Growth disappointment can reduce expectations for borrowing costs but simultaneously weaken the industrial outlook.
GDP and PCE
Today’s BEA release of the advanced third-quarter GDP estimate and September personal income and outlays could have an influence on how the markets play out. The income and outlays report supplies consumption and PCE inflation information. Advanced GDP was 3.4%, 0.2% above forecast, while the core PCE price index came in as anticipated at 0.3%.
For silver, this provides a bit of a mixed picture, although taken through the longer-term outlook, it is worth noting that interest rates remain elevated. Strong growth with sticky inflation is a bit ambiguous at this point in time.
Technical Analysis
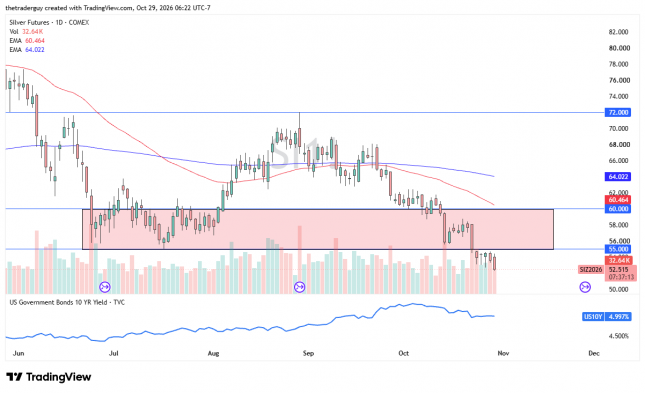
The technical analysis for silver seems to be getting worse as we are pulling away from that previous cluster of support near the $54 level. As GDP continues to climb and inflation remains elevated, this could continue to put pressure on the Federal Reserve to raise rates.
Currently, it looks as if the silver market could very well find its way down to the $50 level if historical precedent is taken into account. Rallies at this point in time have to be looked at with suspicion until we break well above the $55 level.
If you’d like to know more about technical analysis and how traders use it, please visit our educational area.