


Interest Rates Remain the Main Fundamental Driver
To me, the fundamentals are clear once you set aside the stories about Comex and London running out of silver and China buying all the silver to make solar panels. My primary focus at this time is the direction of interest rates. When pure demand becomes the story then I’ll build my case for that being the main driver, but right now I’m watching interest rates.
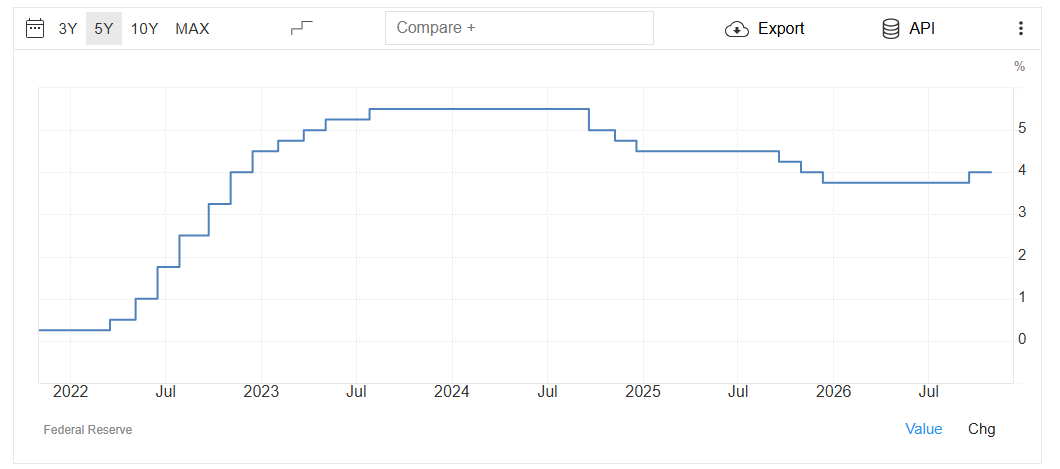
Near the end of October 2025, the chatter on the street was the Fed was going to cut interest rates 2 or 3 times in 2026. That outlook came to a screeching halt on January 28, 2026, when then Fed Chair Powell wouldn’t confirm even two cuts and said the central bank would watch the data. The next day silver topped. At that time, the CME started to raise margins, which took out the little guys chasing the rally.
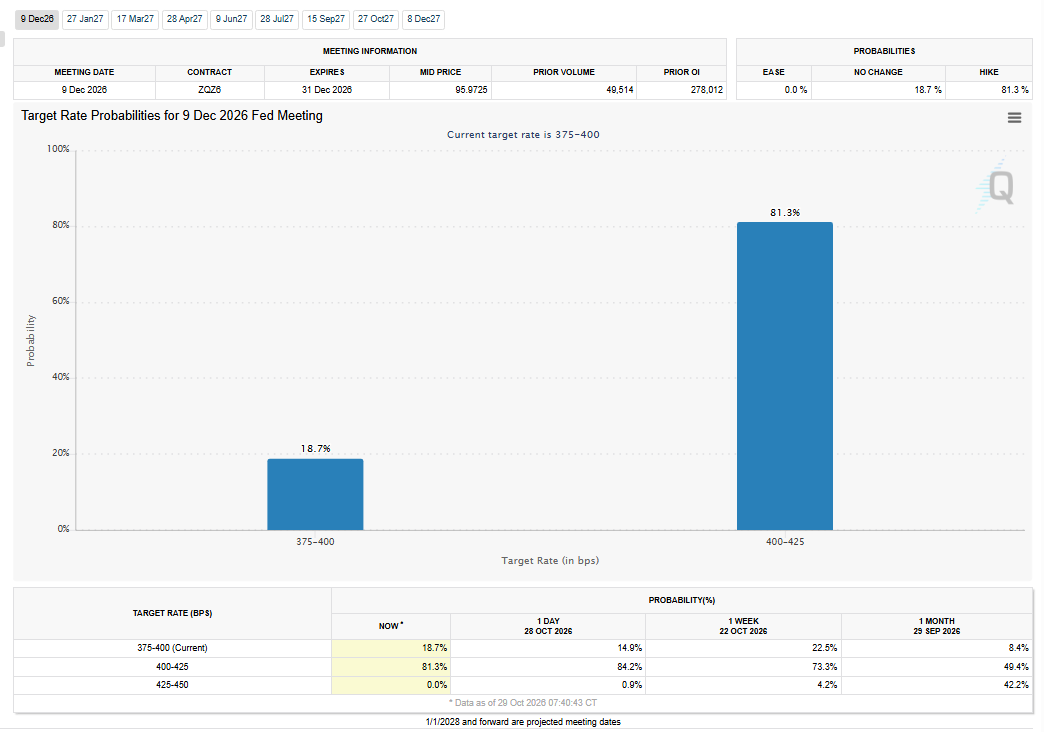
As the year moved forward, prices continued to drop as the Fed left rates on hold then gradually, the chances of a rate hike started to increase and silver selling increased. In September, the Fed raised rates and left open the possibility of another rate hike. Yesterday, the Fed left rates on hold, but the FedWatch tool indicates the market sees another rate hike in December.
Daily Spot Silver (XAGUSD) Technical Analysis
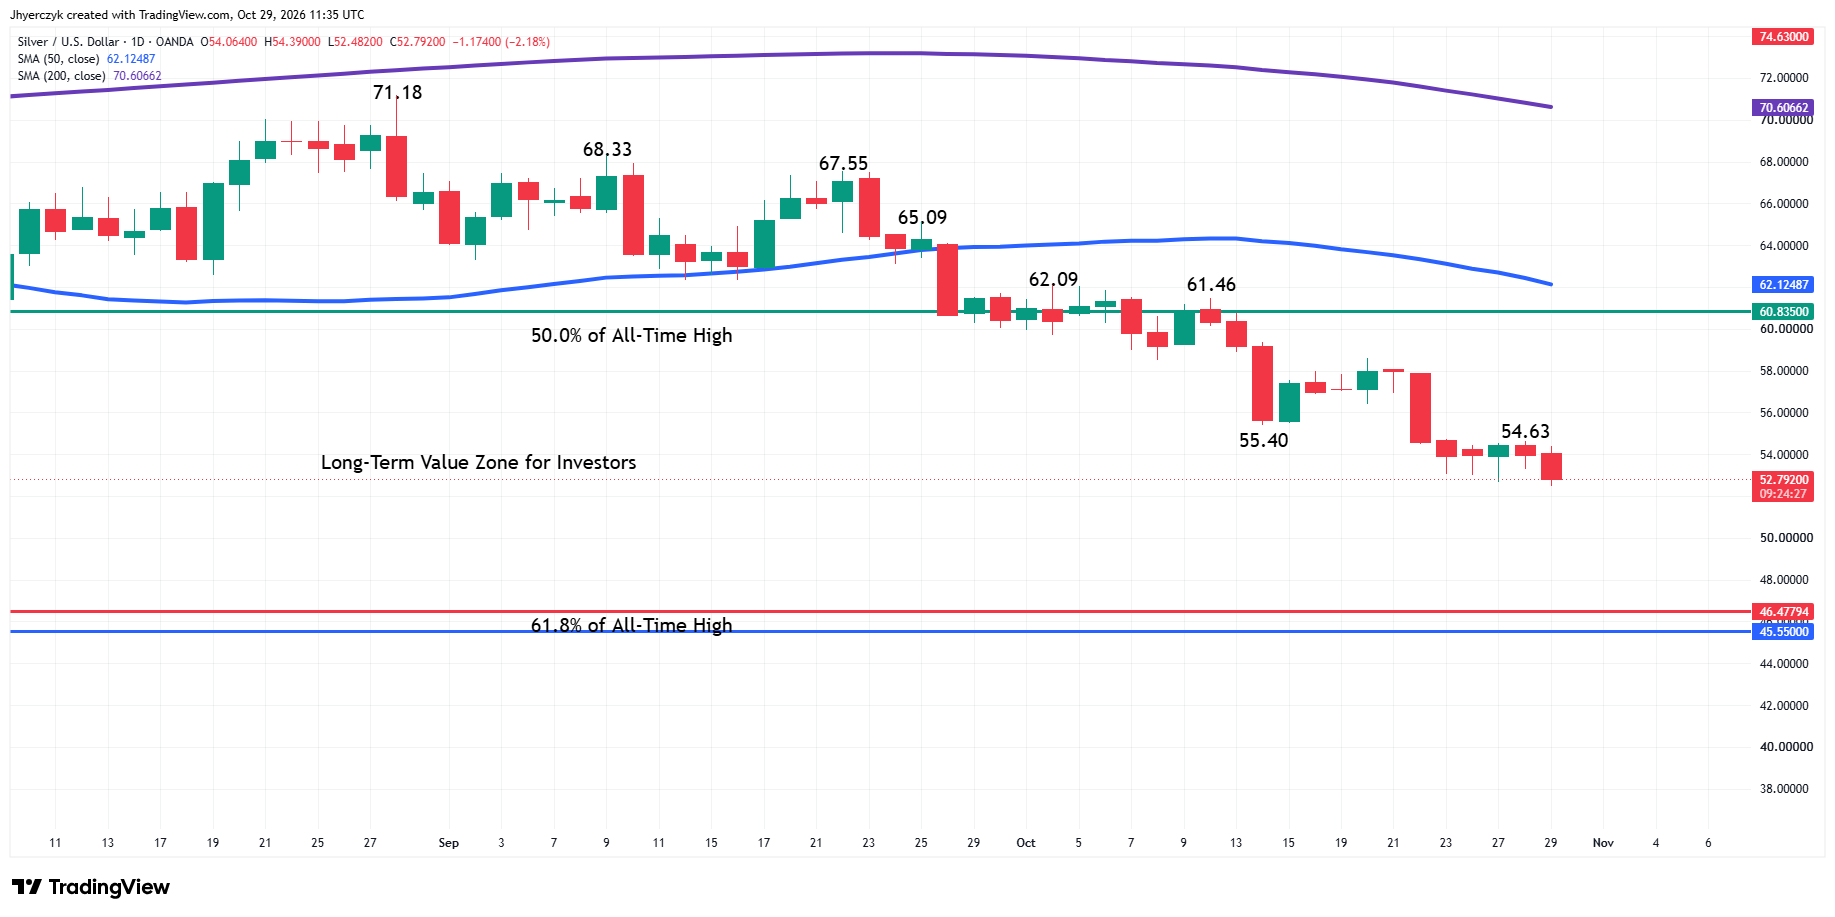
Spot silver continues to edge lower for a second session on Thursday. The main trend is down according to the daily swing chart. The main trend will change to up on a trade through $61.46.
The minor trend is also down. A trade through $54.63 will change the minor trend to up. This will shift momentum to the upside. Until the market establishes an actual swing bottom, we have no minor retracement zone targets, but based on the current intraday low at $52.48, we have an active minor trend 50% level at $55.55. This will move lower if $52.48 is violated.
The market is also well below the 50-day moving average at $62.12 and the 200-day moving average at $70.60. Besides acting like resistance, they are also trending lower.
Silver Price Forecast
Every new Silver analysis as it publishes, today's technical signal and key levels, live price — on one page.
See all Silver forecastsLong-Term Value Zone
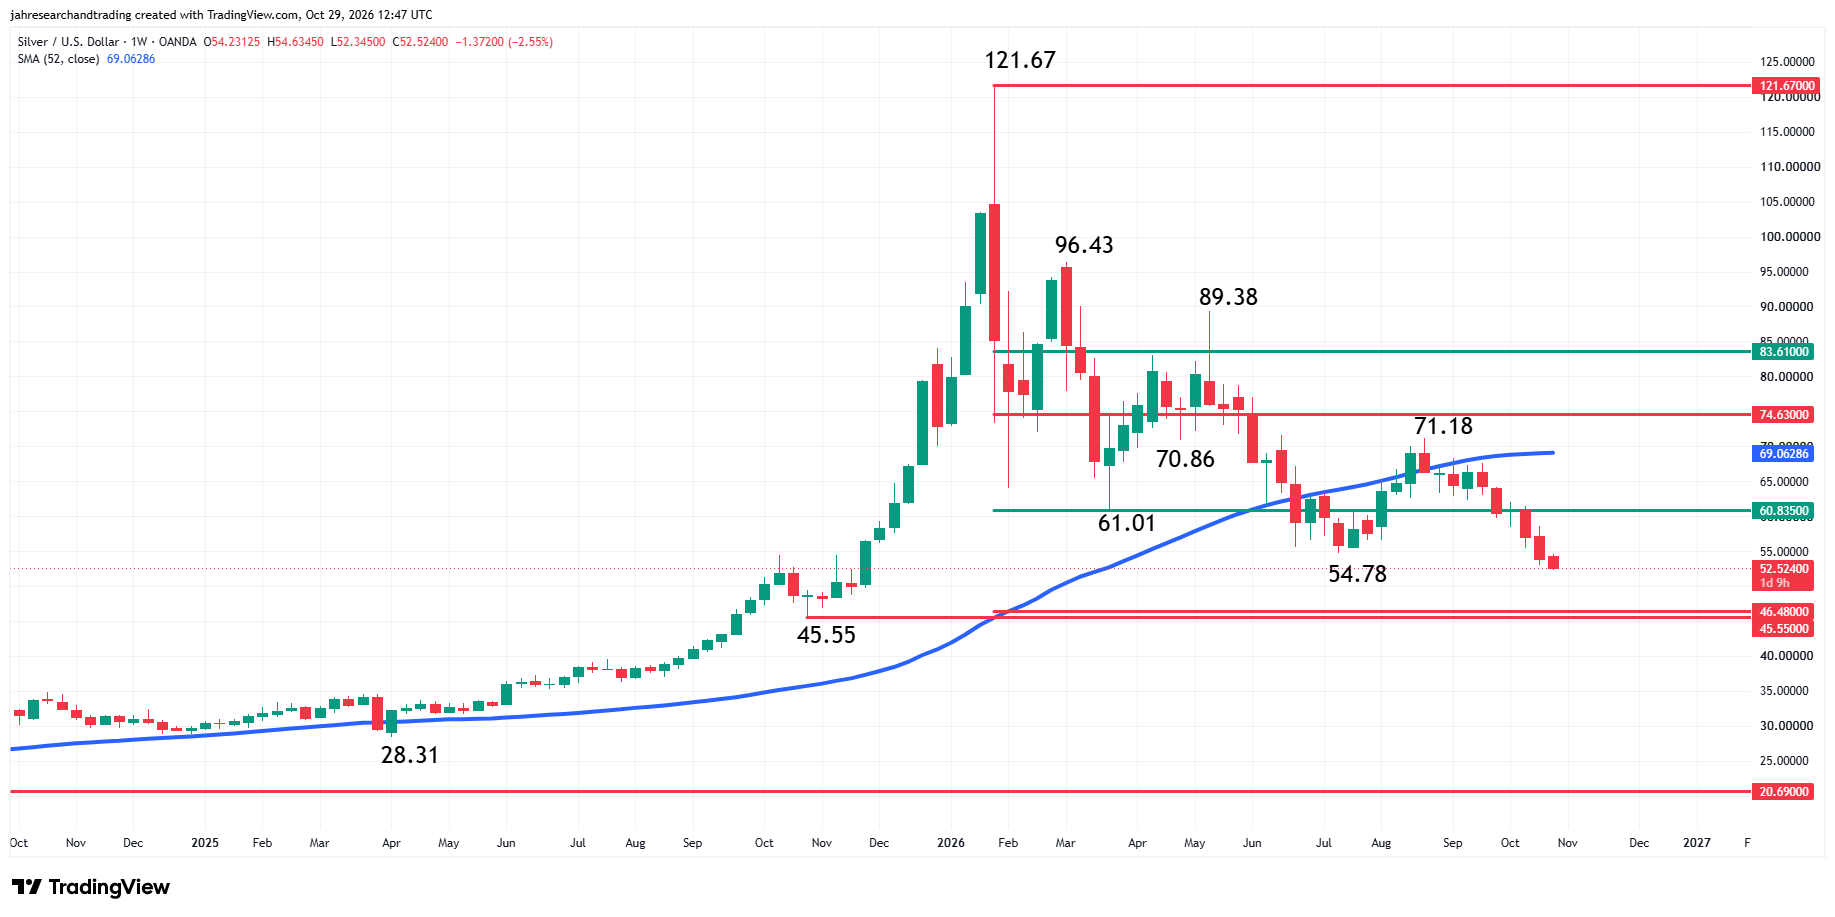
That analysis covered the short-term price action. When dealing with the long-term view, I believe one has to start with the all-time high at $121.67. In the bigger picture, all this market is doing is correcting 50% to 61.8% of the all-time record. The 50% level is $60.835 and the 61.8% level is $46.48. It’s a wide range, but I don’t think it should be treated any differently than any other similar retracement zone.
During the first leg down from the January top at $121.67 to the March bottom at $61.00, traders showed respect for the 50% level at $60.835. In June and July, traders lost respect and the market plunged to $54.78, but still remained inside the long-term retracement zone.
On August 5, the subsequent breakout over $60.835 drove spot silver to $71.18. Then on October 12, it made its last breakdown under $60.835 to take us where we are today at about $52.48.
With the main trend down on the swing chart and the market well below the key moving averages as well as on the bear side of the long-term 50% level at $60.835, one cannot question that the market is in a well-established downtrend.
Furthermore, it’s trading on the weak side of what I consider to be the breakout point that launched the final rally to $121.67. That breakout top is $54.48.
Passive Bidding Has Yet to Establish Value
So now that I’ve revealed nearly every technical reason why spot silver is bearish and in a downtrend, let’s start looking for value. The market usually shows weakness when traders stop taking offers and start passively bidding. That passive bidding usually means buyers want the market to come to them. I can see a little of that going on in the market too.
At this time, I don’t see enough passive bidding to turn the market around. We may see some that is designed to put in a short-term bottom and alleviate some of the downside pressure, but until the market recognizes value, I’m expecting the lows to keep getting lower.
On October 28, 2025, spot silver made its final bottom at $45.55 before it rallied to $121.67. Perhaps the best place to watch for value is $46.48 to $45.55 because under this area, it’s anyone’s guess where the selling will stop.
I have to conclude that silver is unlikely to establish a durable bottom until it is clear that the Fed is done raising rates. So right now, we have silver nearing the bottom of a major value area, but we still have the possibility of a Fed rate hike in less than two months. Until price and the fundamentals align properly, gains are likely to be limited and prices may drop another $6.00 to $7.00.
More Information in our Economic Calendar.