



Spot silver is trying to stabilize early Thursday after Wednesday’s sell-off took out the October 2025 main bottom at $45.55. The break reaffirmed the weekly downtrend, but a pause in the U.S. Dollar’s rally may be giving silver sellers a reason to take profits.
The larger problem remains the outlook for U.S. interest rates. The market came into 2026 expecting rate cuts. Now traders are trying to determine how many hikes will be needed and how long rates will remain elevated.
Fed Minutes Reinforce Hawkish Outlook
Wednesday’s minutes from the Fed’s October meeting showed that nearly all participants expected a rate hike in December. Some favored raising rates in October, while two discussed the possibility of a 50-basis-point increase in December.
The minutes followed a series of hawkish comments from Fed officials. On Tuesday, New York Fed President John Williams said the central bank will likely need to raise rates again to lean against inflationary pressures. However, he stopped short of saying the Fed needs to move to a more aggressive path.
St. Louis Fed President Alberto Musalem warned that several rate hikes may be needed before spring. Dallas Fed President Lorie Logan has called for at least two more 25-basis-point increases and said the Fed may need to move faster if inflation remains elevated.
Dollar and Yields Hold the Key
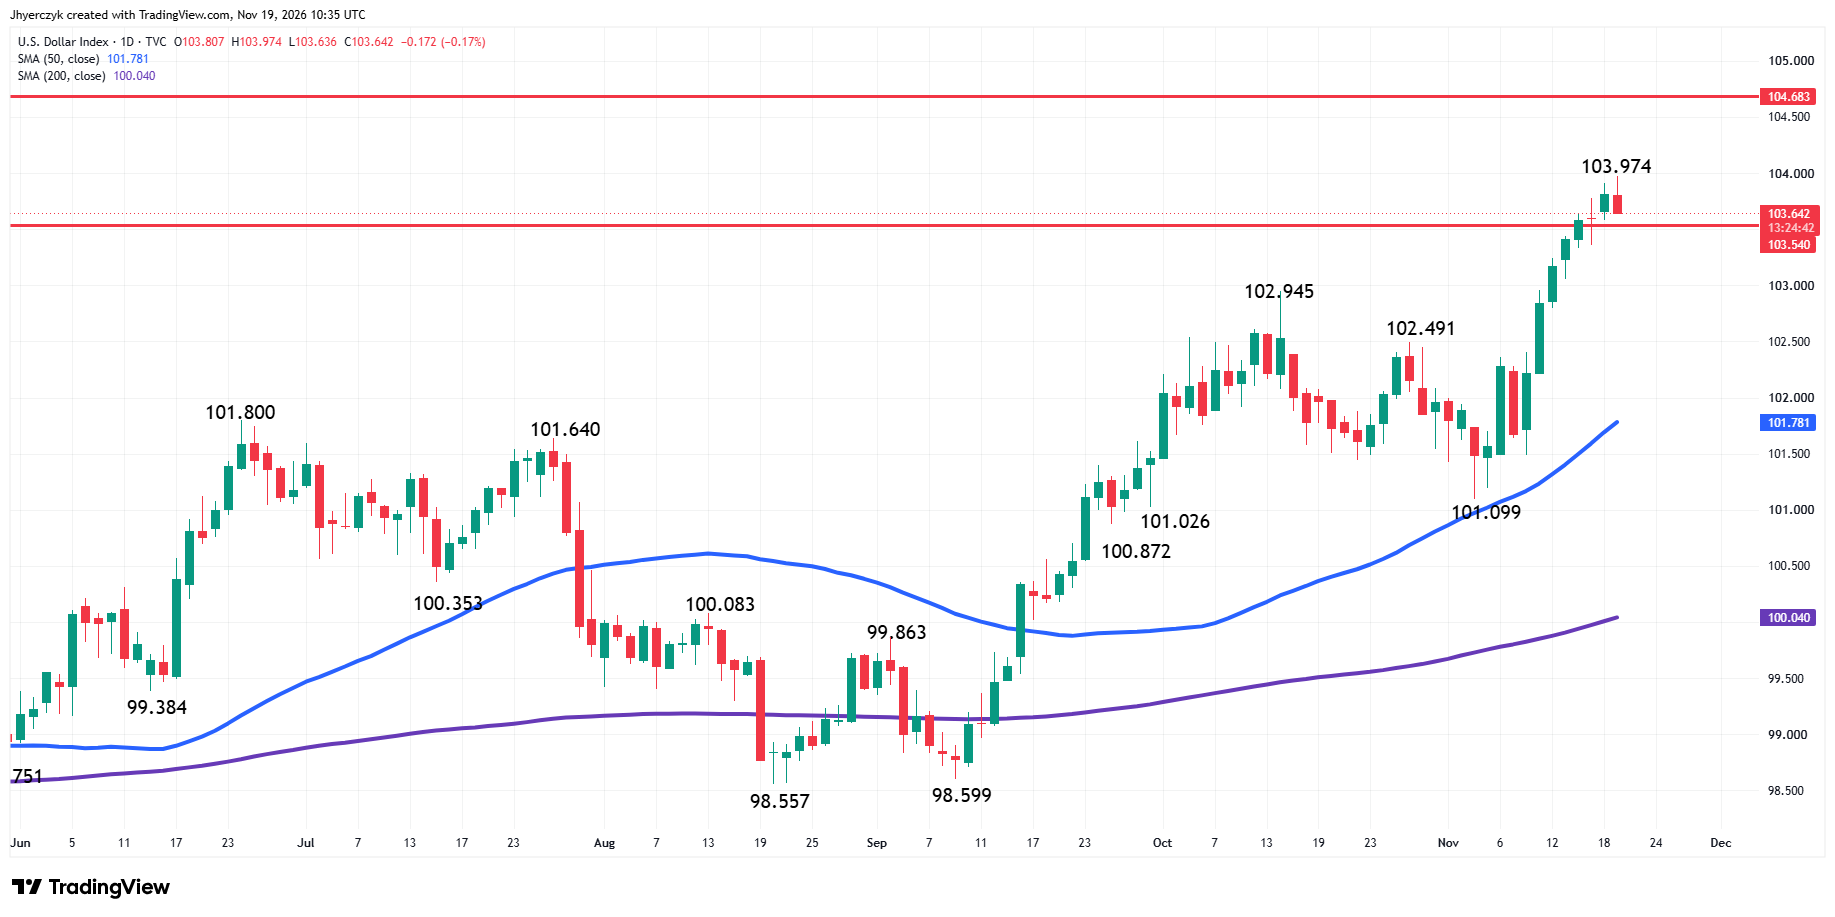
The U.S. Dollar Index’s January 2026 low at 95.551 coincided with spot silver’s all-time high. The dollar’s base-building throughout the spring and summer, and its current price surge, also mirrored the decline in silver.
Silver Price Forecast
Every new Silver analysis as it publishes, today's technical signal and key levels, live price — on one page.
See all Silver forecastsThe 10-year U.S. Treasury note yield is testing 5.090%, with its 50-day moving average at 5.071%. If yields resume their climb and the dollar follows, silver could remain under pressure.
In my opinion, we’re not likely to see a lasting bottom in silver until the dollar tops. That may not be determined until traders have a better idea of how many rate hikes are in the cards for the Fed.
Weekly Spot Silver (XAGUSD) Technical Analysis
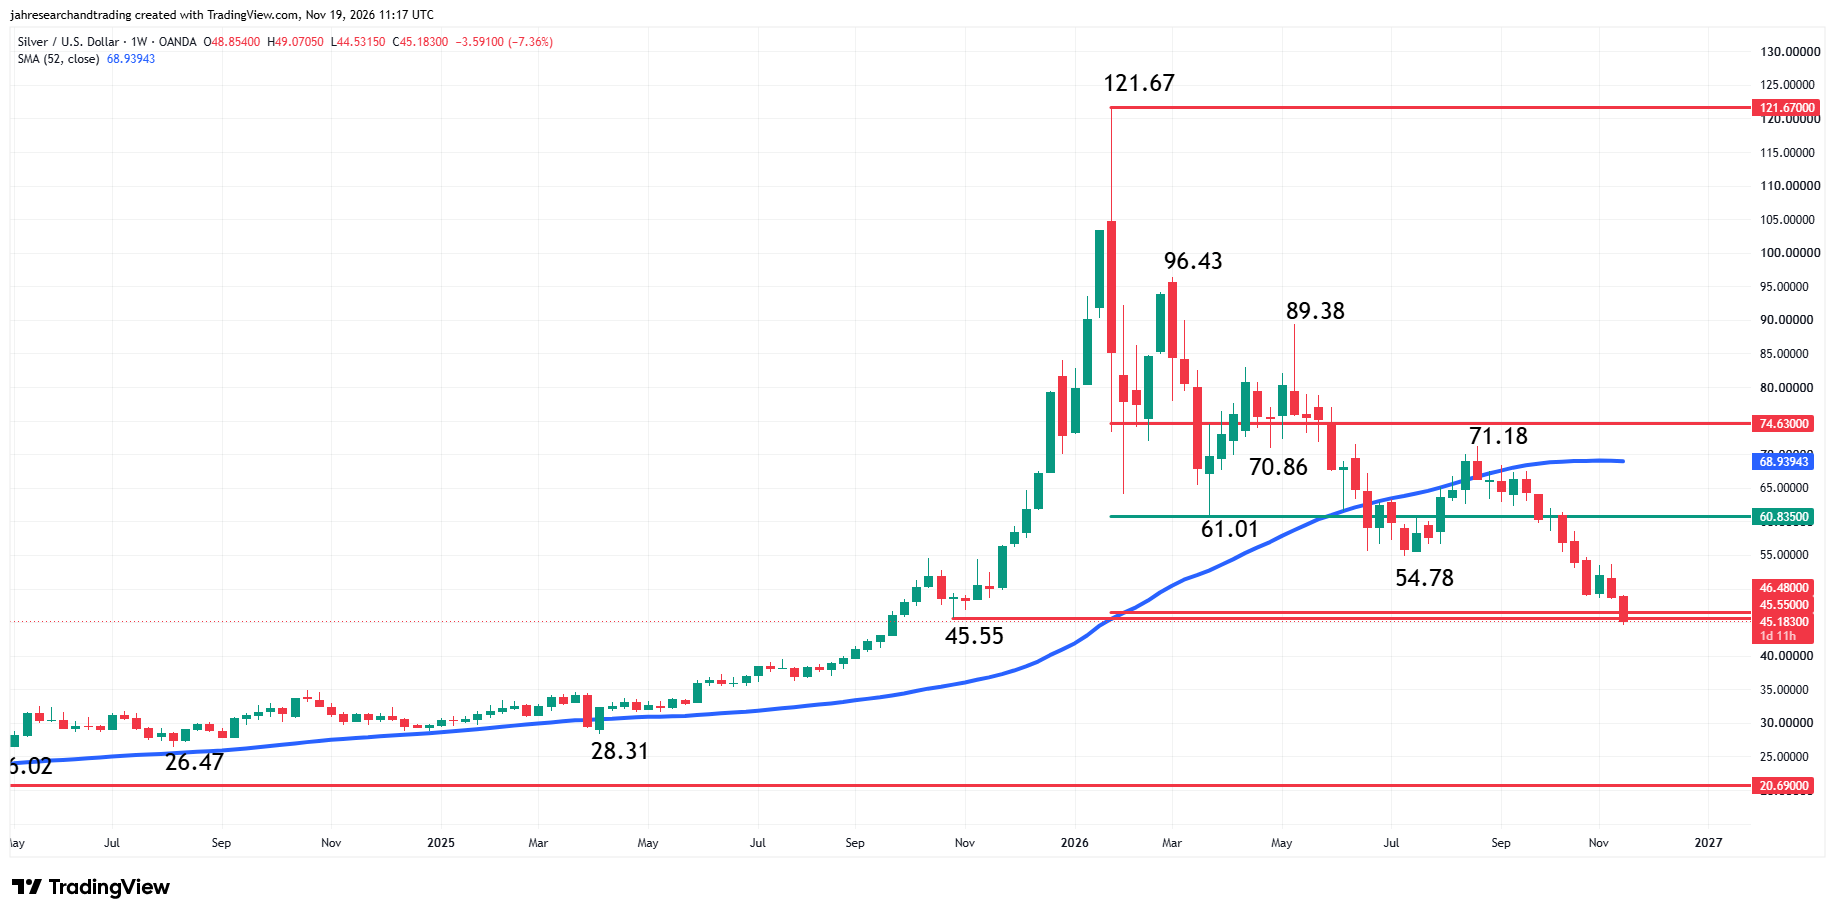
As we approach the end of the week, spot silver is heading for a more than 7% loss and threatening to break down under a price not seen since October of last year.
The main trend is down according to the weekly swing chart. The trade through the October 2025 main bottom at $45.55 reaffirmed the downtrend. The main trend will change to up on a trade through the last main top at $71.18.
Spot silver is also trading on the weak side of the 52-week moving average at $68.94, which is both resistance and a long-term trend indicator.
The long-term 50% to 61.8% retracement zone at $60.835 to $46.48 has also been breached.
Daily Spot Silver (XAGUSD) Technical Analysis
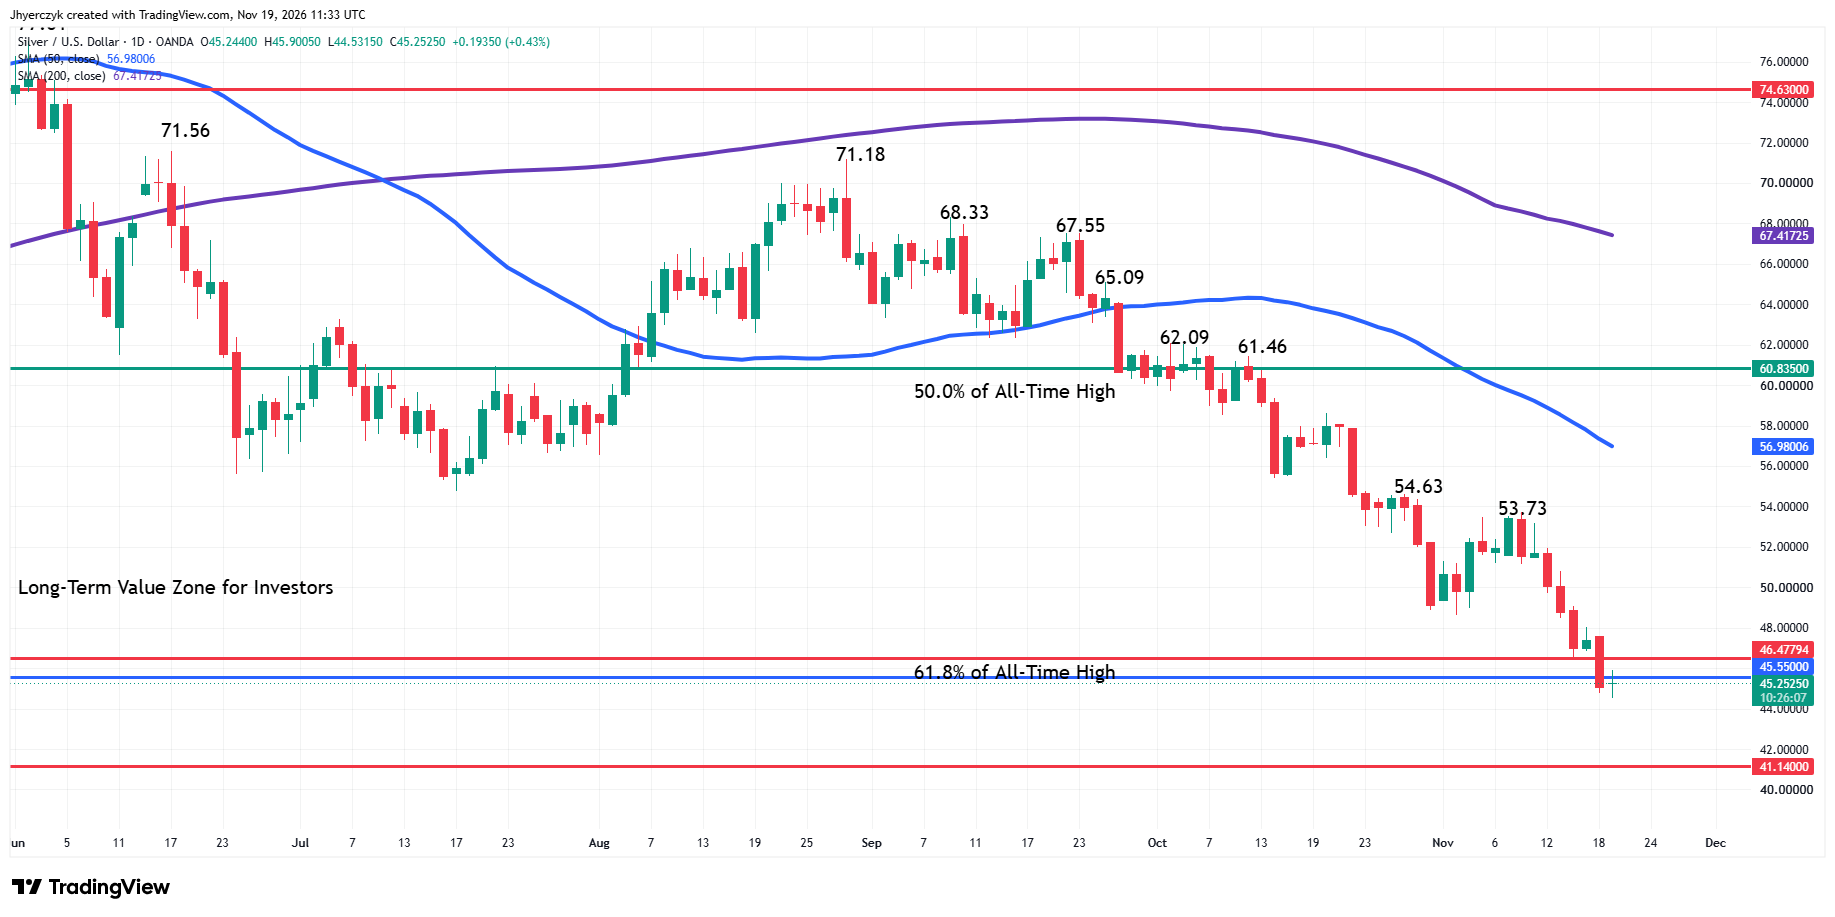
Spot silver is in its eighth session since its last swing top as we begin Thursday’s session. The main trend is down according to the daily swing chart. A trade through $53.73 will change the main trend to up.
Major support at $46.48 and $45.55 was broken on Wednesday with bearish traders setting their sights on the next main bottom support at $41.14. Unless a major buyer comes in to stop the selling, or aggressive counter-trend traders start taking out offers, we’re going to assume that the market is heading into this main bottom.
Another way to signal that traders are lightening up on the downside will be the formation of a closing price reversal bottom. If formed and confirmed, this could produce a quick counter-trend rally equal to 50% of the break from $53.73 to the eventual bottom. However, it should be noted that it will not change the trend to up.
What to Watch
Weekly Spot Silver (XAGUSD)
My bias is to the downside because of the trade on the weak side of the 52-week moving average at $68.94 and the downtrend on the weekly swing chart. A sustained move under $45.55 will strengthen my bearish outlook. If selling pressure increases on this breakdown, we could be looking at a steep decline with the April main bottom at $28.31 the next major objective.
Due to the prolonged move down in terms of price and time, approximately $26.65 in 12 weeks, spot silver is currently inside the window of time for a closing price reversal bottom. It would need to close over $48.77 to produce the potentially bullish chart pattern and overtake this week’s high next week to confirm it. If this occurs then my downside bias will weaken and possibly shift to the upside if there is strong counter-trend buying. However, I would expect gains to be capped with fresh sellers coming in to resume the downside pressure.
Daily Spot Silver (XAGUSD)
The position under the 50-day moving average at $56.98 and the 200-day moving average at $67.42, along with the downtrend on the daily swing chart, supports my downside bias. If the market continues to fall below the long-term 61.8% level at $46.48 then look for the selling to possibly extend into the next main bottom at $41.14.
If we don’t see a closing price reversal bottom then recovering $46.48 will also weaken my downside bias.
More Information in our Economic Calendar.