



Silver Is Waiting on the Fed Trade
Spot silver is lower early Wednesday, but there is no urgency behind the move. Tuesday’s attempt to push through the near-term pivot did not hold. The dollar firmed overnight. Treasury yields moved higher. Gold is down for a fourth straight session. Silver is caught in the same trade.
At 06:41 GMT, spot silver is trading $57.21, down $0.80 or -1.37%.
The October Fed meeting is a week away. Traders have largely taken a rate hike off the table for that meeting, but December has not gone away. That leaves silver without a clean reason to chase higher after the break from last week’s low.
Oil Is Keeping Pressure on the Metals Trade
Oil is back on the bid. The Red Sea and Saudi infrastructure risk are back with it. Gold traders are selling into the inflation side of the trade.
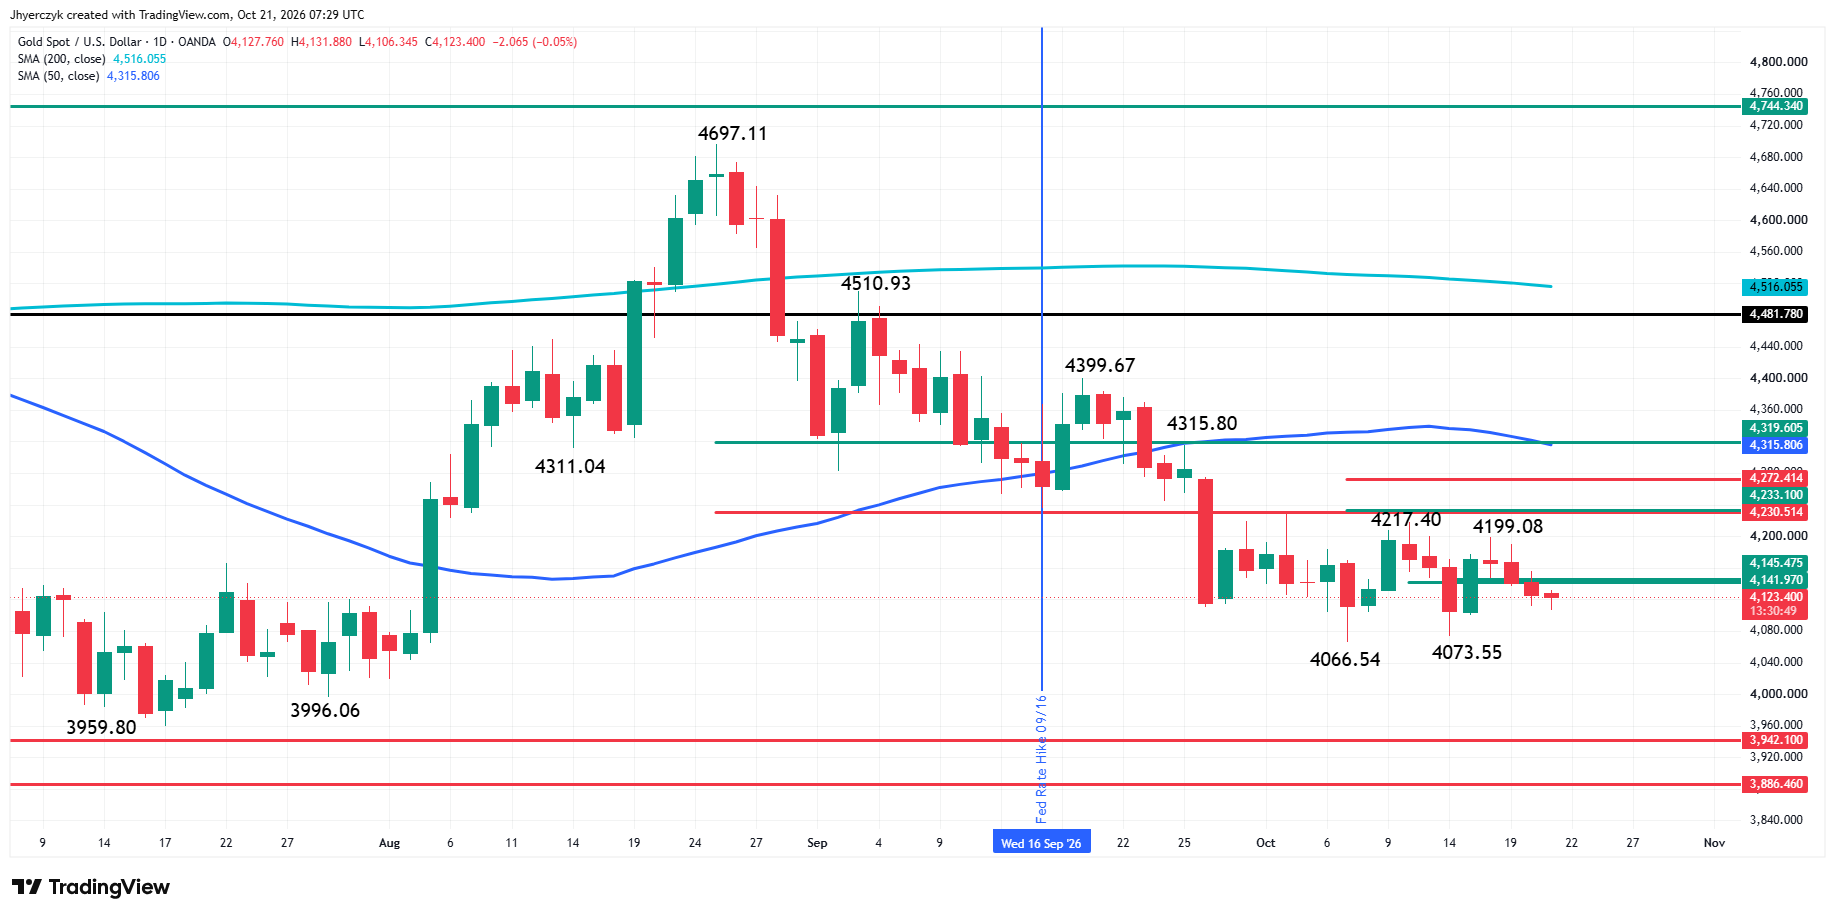
Gold is taking the pressure first. Silver is following it lower, but not with the same force seen during last week’s break. The metal is sitting inside the October 14 trading range. Buyers have not taken offers, but sellers have not been able to take out the low either.
The rate market still has December in front of it. Economists expect the Fed to hold rates steady next week, then raise them in December. FedWatch is carrying the same message. The October meeting is not the issue. December is.
The PCE report arrives next week. Until then, the market has oil, the dollar and yields to work with. Silver traders are not getting a fresh catalyst from the metal itself.
Silver Price Forecast
Every new Silver analysis as it publishes, today's technical signal and key levels, live price — on one page.
See all Silver forecastsThe Dollar and Yields Are Holding the Top Side Down
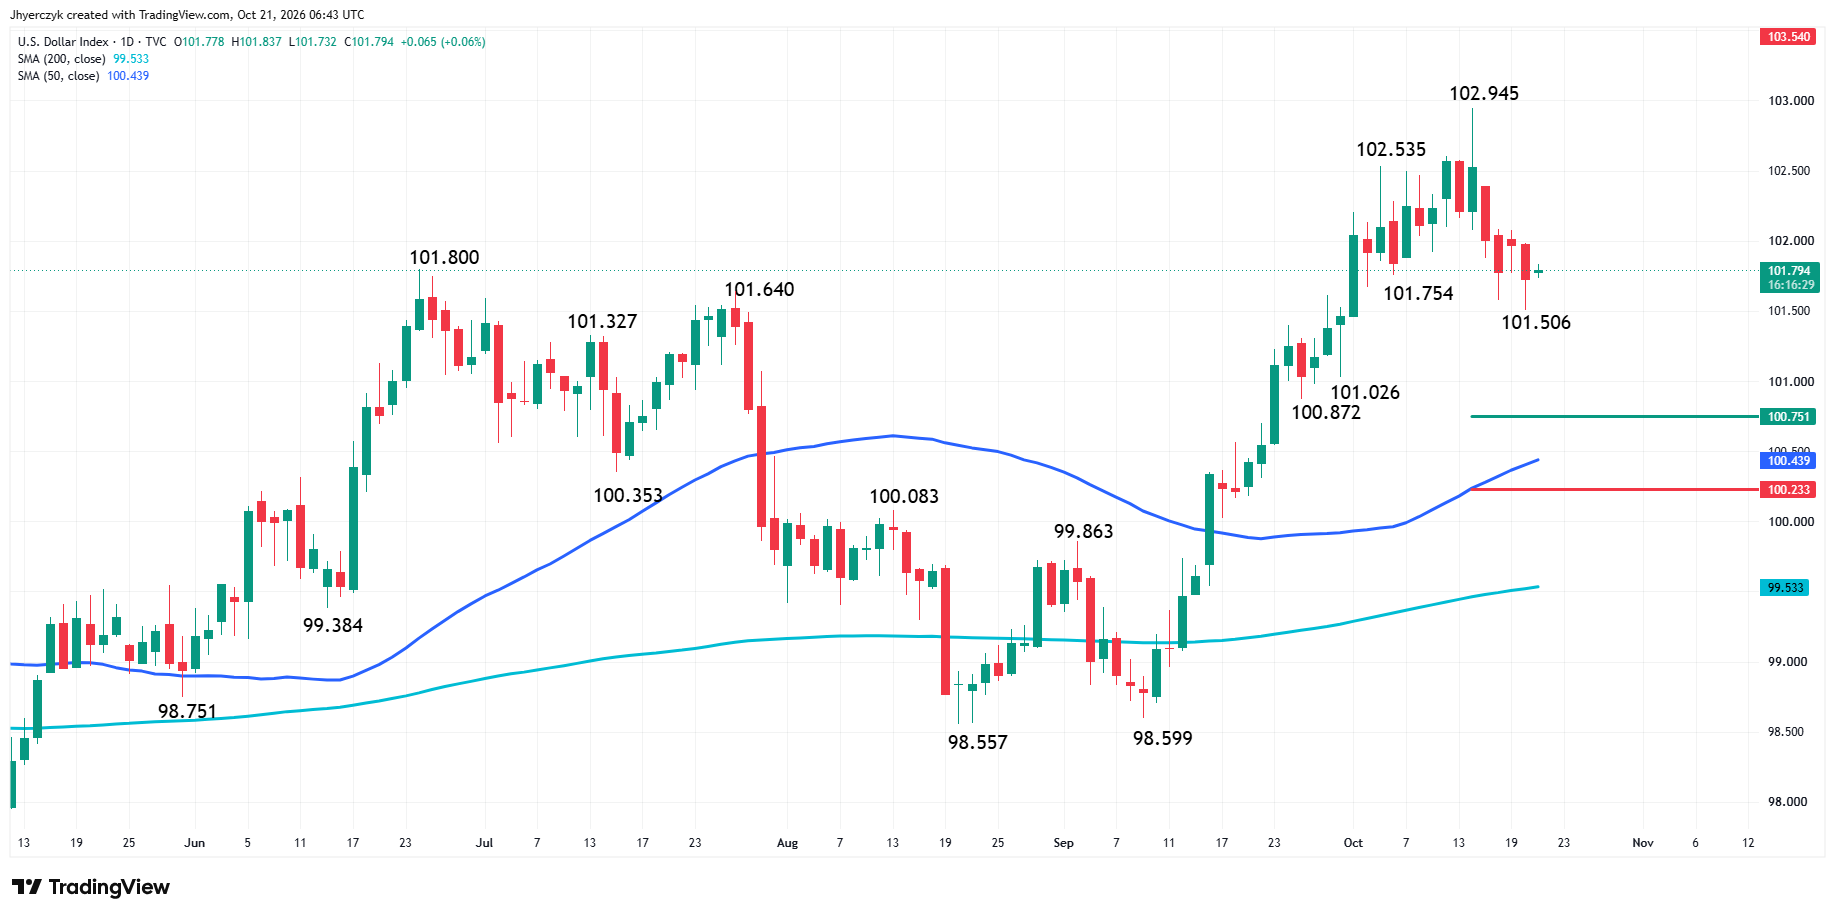
The Dollar Index stopped falling and firmed overnight. The 10-year Treasury yield also turned higher. That was enough to put pressure back on silver after Tuesday’s failed attempt to extend the recovery.
The metal pushed through the daily pivot Tuesday, then backed off. That is the chart traders have in front of them Wednesday. The market tried the top of the short-term range and did not find enough buyers.
Silver does not need a new low in the Dollar Index or a sharp yield break to stabilize. It needs the pressure to stop building. Right now, neither market is giving it that break.
Weekly Spot Silver (XAGUSD) Technical Analysis
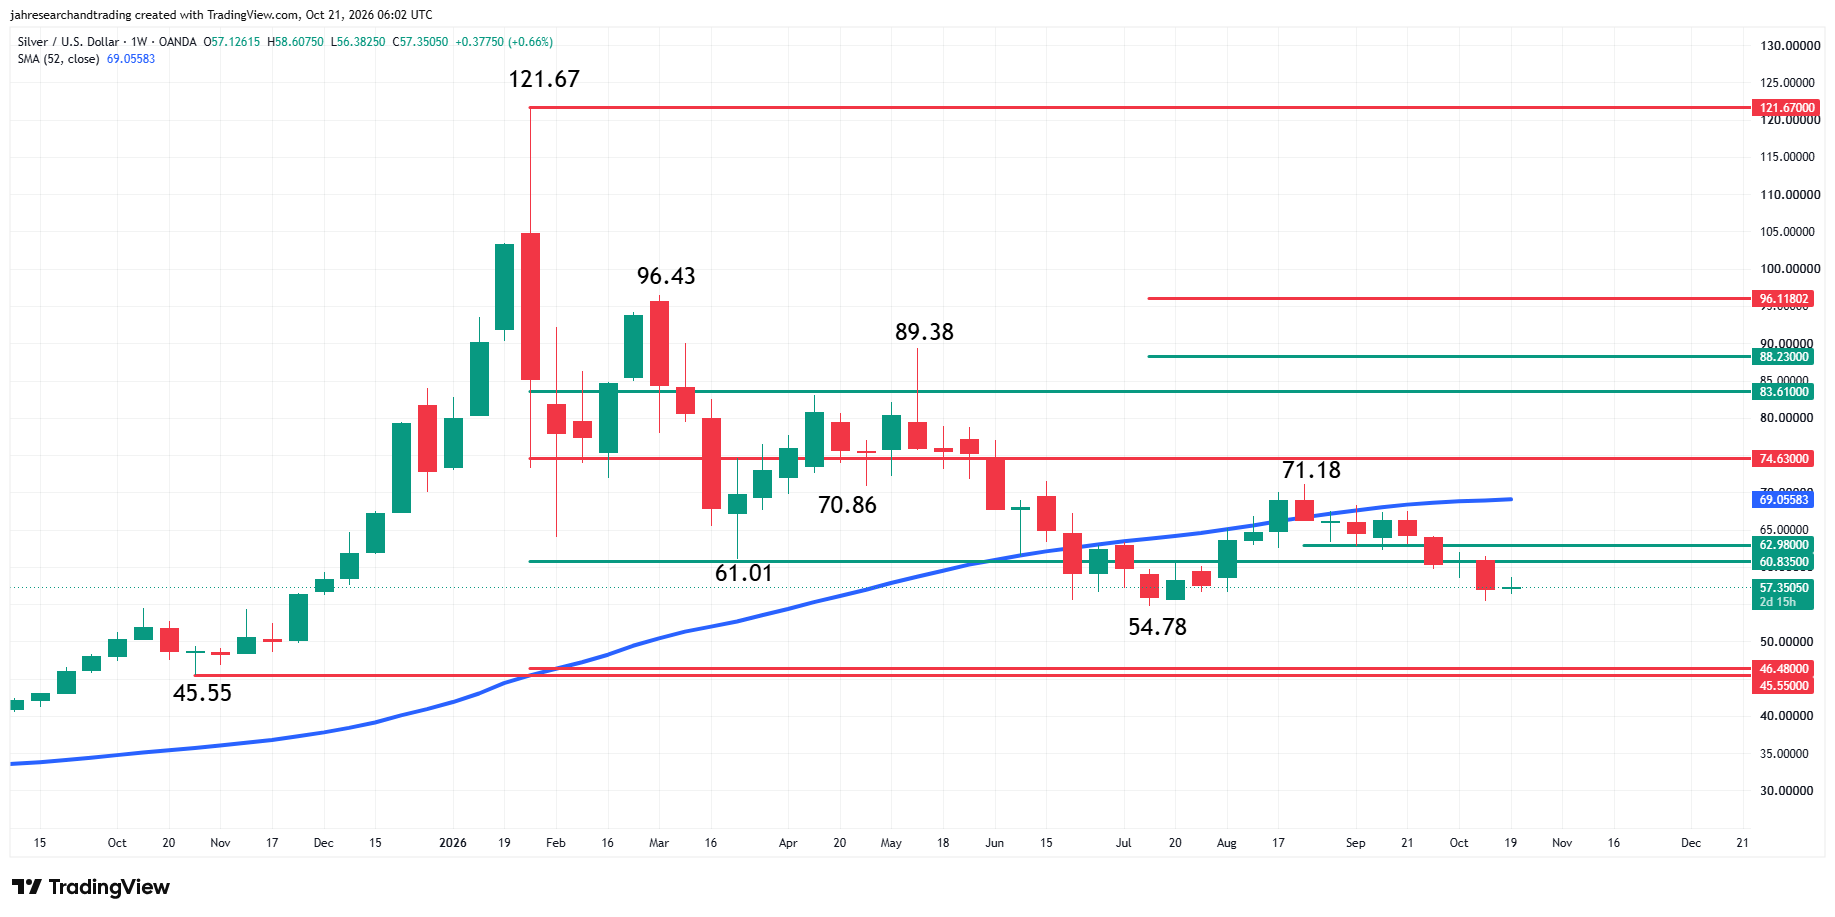
Spot silver is slightly higher on the weekly chart this week as of early Wednesday. Volume has been light and the range tight at $56.38 to $58.61. The market is up about 0.65% for the week.
The main trend is down according to the weekly swing chart. A trade through $71.18 will change the main trend to up. Taking out $54.78 will signal a resumption of the downtrend.
The market is currently trading inside a long-term retracement zone at $60.835 to $46.48. To some investors, this area represents value.
The intermediate range is $45.55 to $121.67. Its retracement zone at $74.63 to $83.61 is potential resistance.
The short-term range is $54.78 to $71.18. Its 50% resistance comes in at $62.98.
Spot silver is also trading on the bearish side of the 52-week moving average at $69.06.
Daily Spot Silver (XAGUSD) Technical Analysis
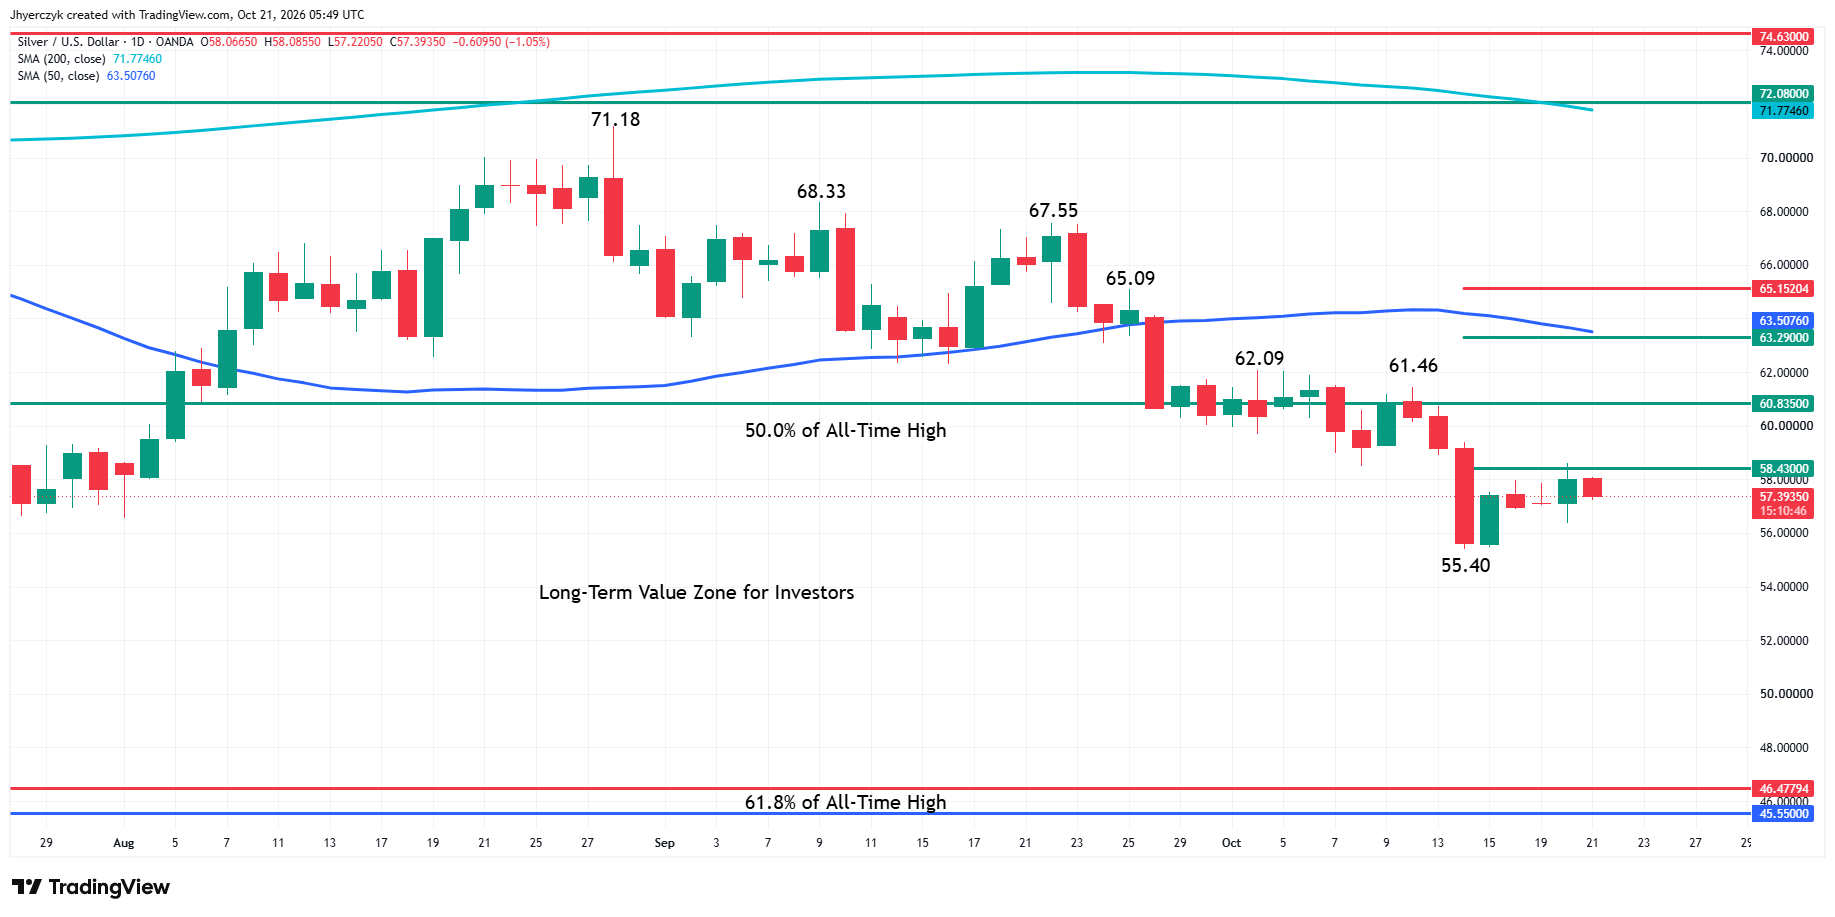
Spot silver is edging lower early Wednesday as traders continue to navigate inside the big trading bar from October 14 at $59.37 to $55.40.
The main trend is down according to the daily swing chart. A trade through $55.40 will signal a resumption of the downtrend. The main trend will change to up if buyers can take out $61.46. The change in trend will be reaffirmed on a move through $62.09.
The minor range is $61.46 to $55.40. Its 50% level at $58.43 appears to be controlling the near-term direction of the market. On Tuesday, XAG traded through the pivot to $58.61, but the attempted breakout may have failed due to the lack of buyers.
The next major pivot level to watch is 50% of the all-time high at $60.835. Above this price, traders will be targeting a retracement zone at $63.29 to $65.15. Inside this zone is the 50-day moving average at $63.51.
For longer-term investors, Spot Silver is currently sitting inside a major value zone defined by the 50% level at $60.835 and the 61.8% level at $46.48.
Daily iShares Silver Trust (SLV) Technical Analysis
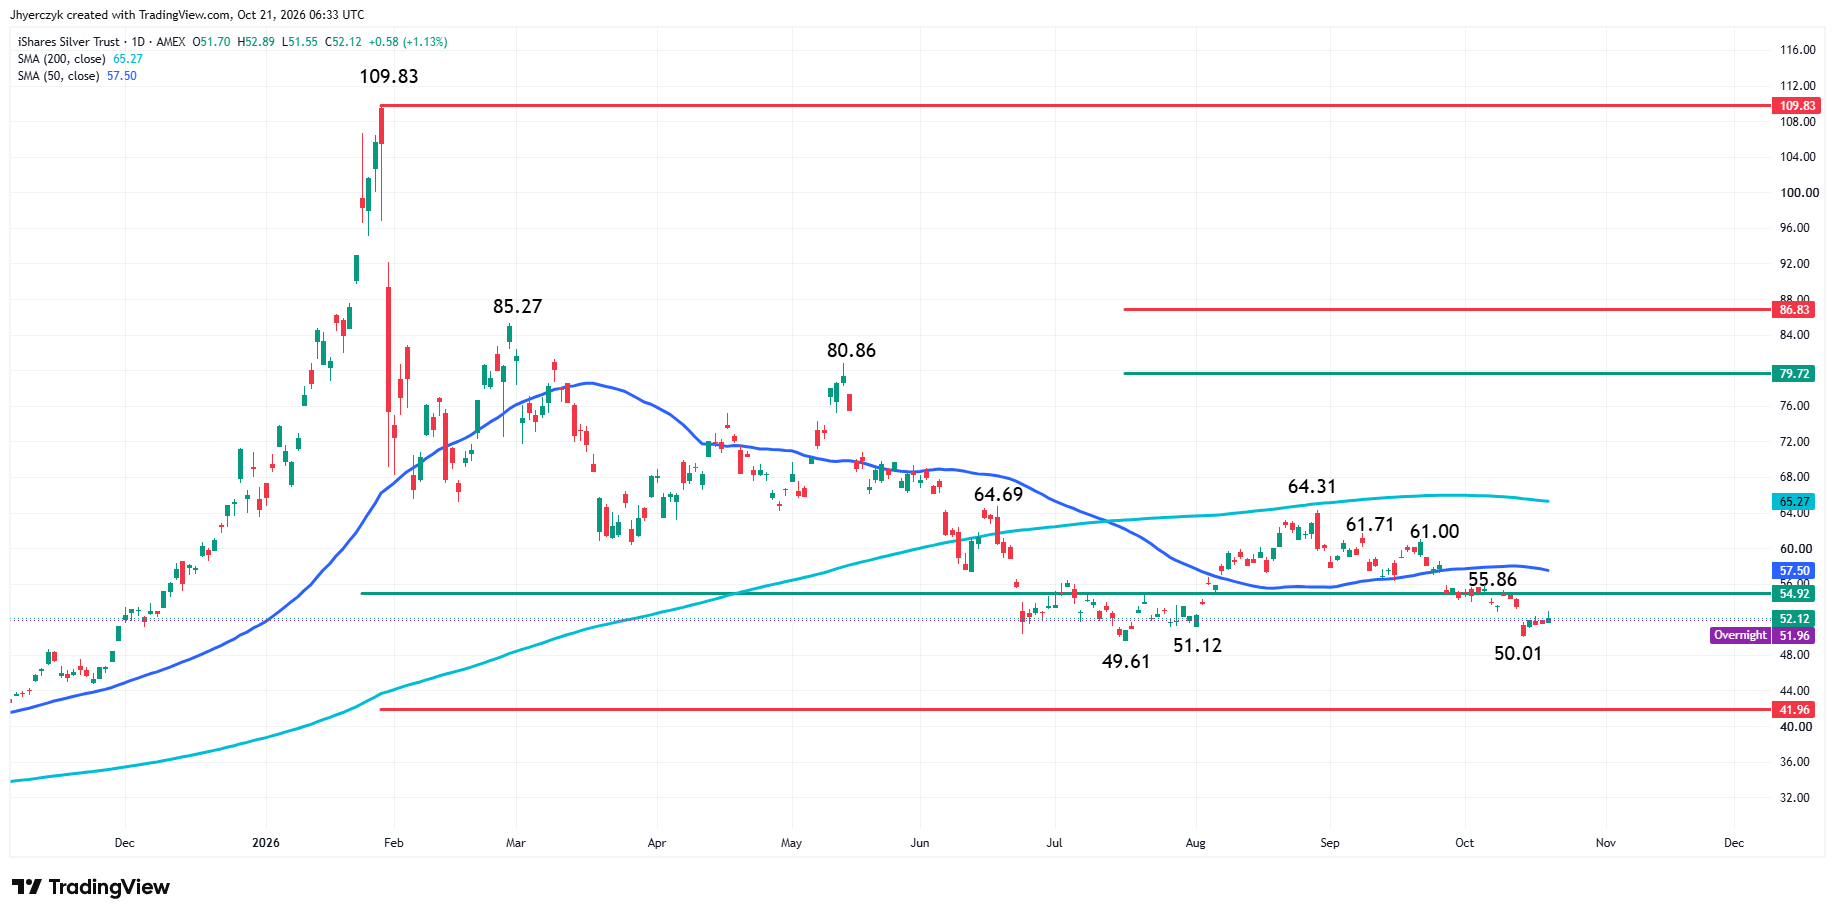
The long-term view of the iShares Silver Trust ETF shows a downtrend based on the market’s relationship with both the 50-day and 200-day moving averages at $57.50 and $65.27, respectively.
From a value perspective, the market has been sitting inside a key long-term retracement zone at $54.92 to $41.96. The three bottoms at $49.61, $51.12 and $50.01 may be early signs of accumulation. However, until new money can cross to the strong side of this zone and create enough upside momentum to overcome the moving averages, the iShares Silver Trust ETF is likely to continue to sit inside the long-term retracement zone.
What to Watch
The Fed has not given silver a fresh trade. Oil is keeping inflation on the screen, December rate expectations are still there, and the dollar and yields are firming. That keeps the pressure on the top side of the market. PCE next week is the next major U.S. number.
The primary driver of my downside bias on the weekly chart is the market’s relative position to the 52-week moving average. The trading action since July, however, is showing signs that some investors are recognizing the importance of the $60.835 to $46.48 retracement zone. Overcoming $60.835 will weaken my bearish outlook.
The main swing chart trend and trading below the 50-day moving average are giving me my downside bias. My outlook will strengthen if $55.40 fails as support. It will weaken if buyers can overcome $58.43 with conviction.
In my opinion, SLV ETF is more of an investment vehicle than a trading vehicle like XAGUSD so my bias is more neutral than bearish. From the all-time high at $109.83, a decline of 50% to 61.8% in just 10 months fits the definition of a value area for long-term investors.
More Information in our Economic Calendar.