


Silver kicks off the week watching out for the Tuesday Federal Reserve industrial production report, scheduled for 9:15 a.m. Eastern. It has not been released yet, so the useful question is whether manufacturing itself has strengthened rather than whether the broad industrial production headline looks impressive.
Industrial Production in the United States
The distinction will matter in the existing data. The October 16 release showed September industrial production rising 0.7%, while manufacturing increased 0.3% and utilities gained 3.5%. Utilities can move with electricity and heating requirements. Their contribution does not establish an equivalent increase in demand for fabricated silver products.
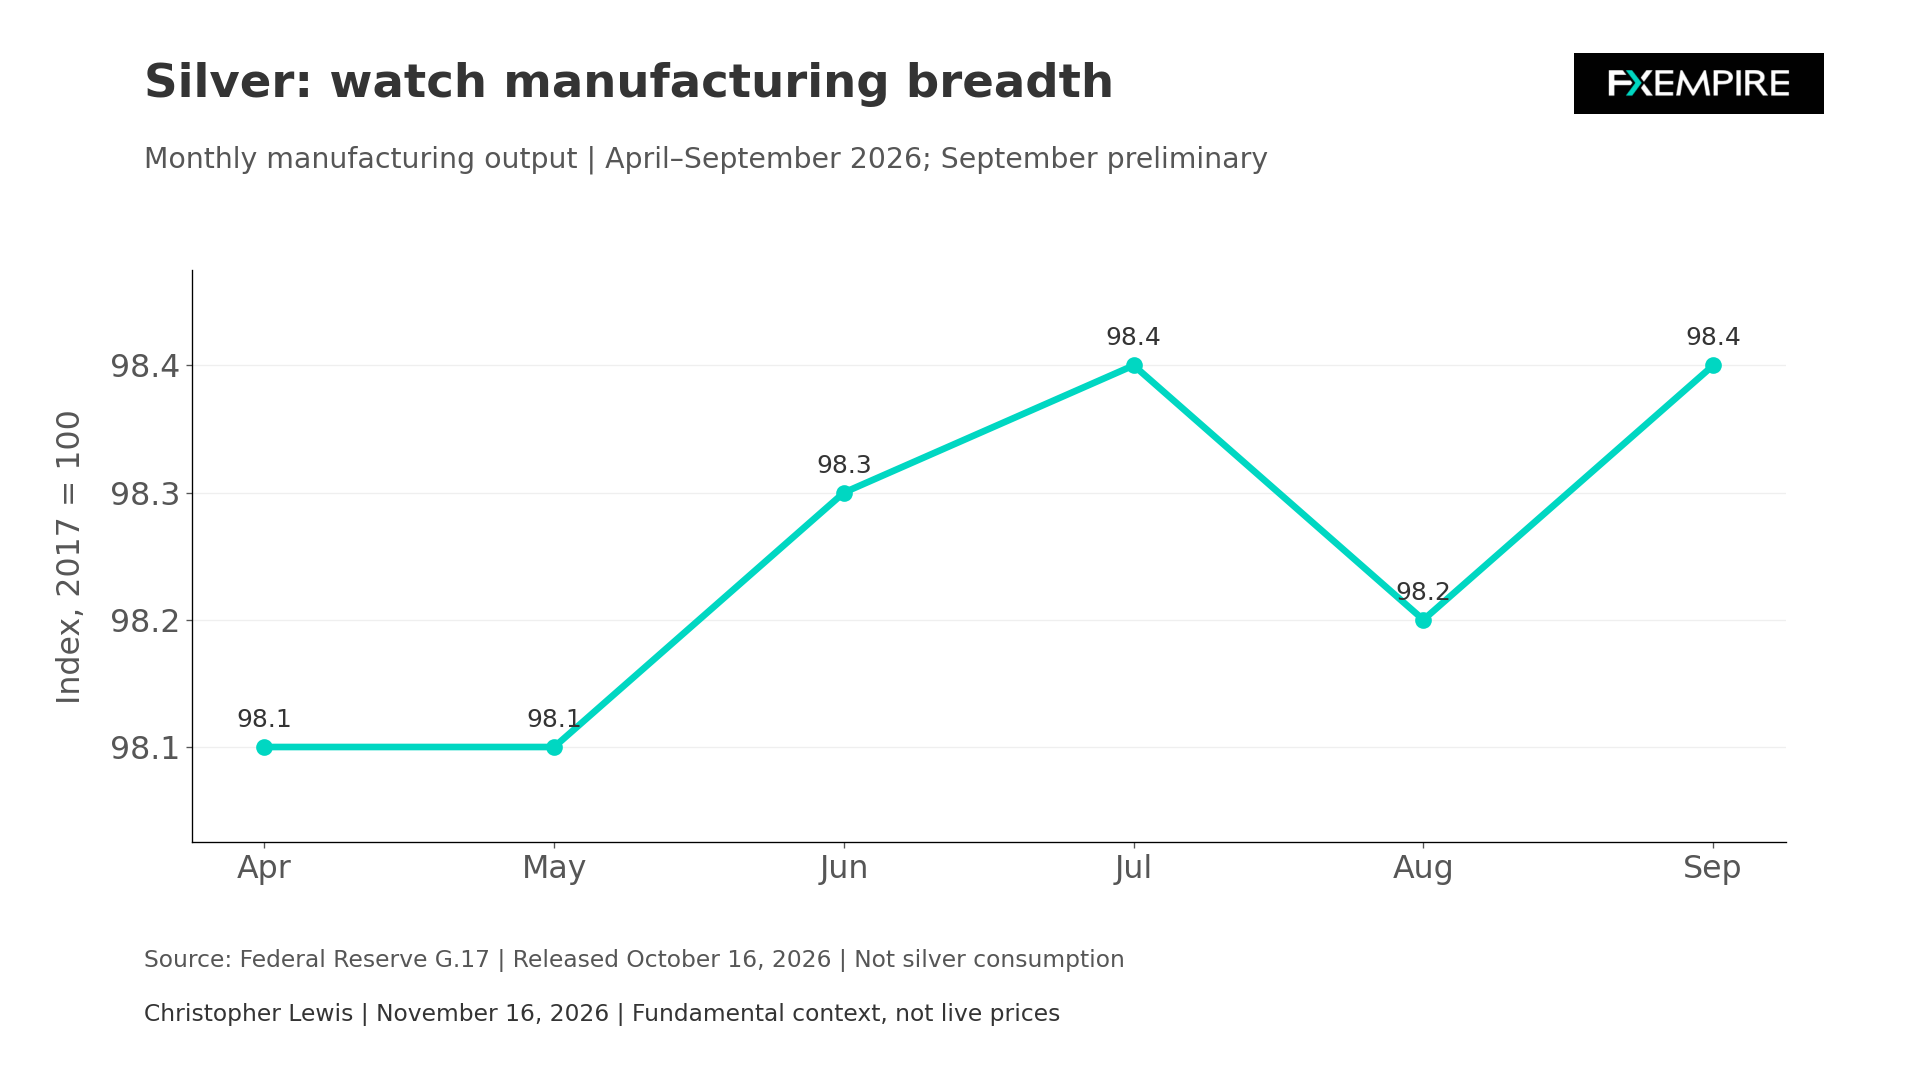
These are September observations included as a baseline for tomorrow’s comparison. The chart uses all 6 available monthly manufacturing index observations from April through September. It shows a modest and uneven progression ending at 98.4 on a 2017 equals 100 basis. This index level is not a percentage change, and it does not measure the ounces of silver consumed.
Silver-specific industry estimates explain why a broad factory measure is only part of the picture. In its November 12 release, the Silver Institute reported metals-focused forecasts for industrial demand outside photovoltaics to rise 4.5% this year, even as total industrial silver demand falls 3%. This difference shows weaker solar consumption and reduced silver use per application.
One of the biggest catches is that a manufacturer can produce more units while using less silver in each one. Higher output can then coexist with falling silver requirements. Tomorrow’s factory report will assess activity, but it cannot settle the material-intensity question by itself.
Silver Price Forecast
Every new Silver analysis as it publishes, today's technical signal and key levels, live price — on one page.
See all Silver forecastsPan American Silver Report
The supply side also deserves a certain amount of attention. Pan American Silver’s November 4 results kept its annual silver production guidance at 25 million to 27 million ounces, but placed the expected outcome at the low end. The company cited unplanned fourth-quarter downtime at Huaron to repair the primary grinding mill foundation, together with a higher gold-to-silver production ratio at Cerro Moro.
This is dated operational disclosure, not a mine interruption that has just been announced today. The distinction between maintaining a range and expecting its lower end is useful. The formal guidance can remain unchanged while management’s assessment within it becomes less favorable. It would still be wrong to count the range as lost output or to extrapolate one producer’s repair issue across the global mining industry.
This also explains why weaker demand estimates do not automatically produce an equally large improvement in available supply. Manufacturing use, mine output, and recycling can change at the same time. The net effect depends on their relative size and timing. For an industrial buyer, the relevant issue is going to be whether deliverable metal becomes easier to obtain when an order needs filling, rather than whether one annual forecast has moved lower.
CFTC Numbers Today
The CFTC also schedules its holiday-delayed positioning release for 3:30 p.m. Eastern today. That offers a separate view of financial participation, subject to the report’s lagged observation date. The currently accessible legacy futures-only table shows silver non-commercial longs of 37,002 contracts, with shorts of 15,751 as of November 3. The difference is a net long of 21,251 contracts, excluding spreading. This is a baseline for comparison, not necessarily evidence of daily present buying.
For tomorrow’s release, I’m going to compare the new manufacturing reading with any revision to September before judging acceleration coming out of the industrial sector. An apparently stronger monthly gain can look less impressive if the prior level is revised down.
Looking at the Charts, the Silver Market Looks Horrible
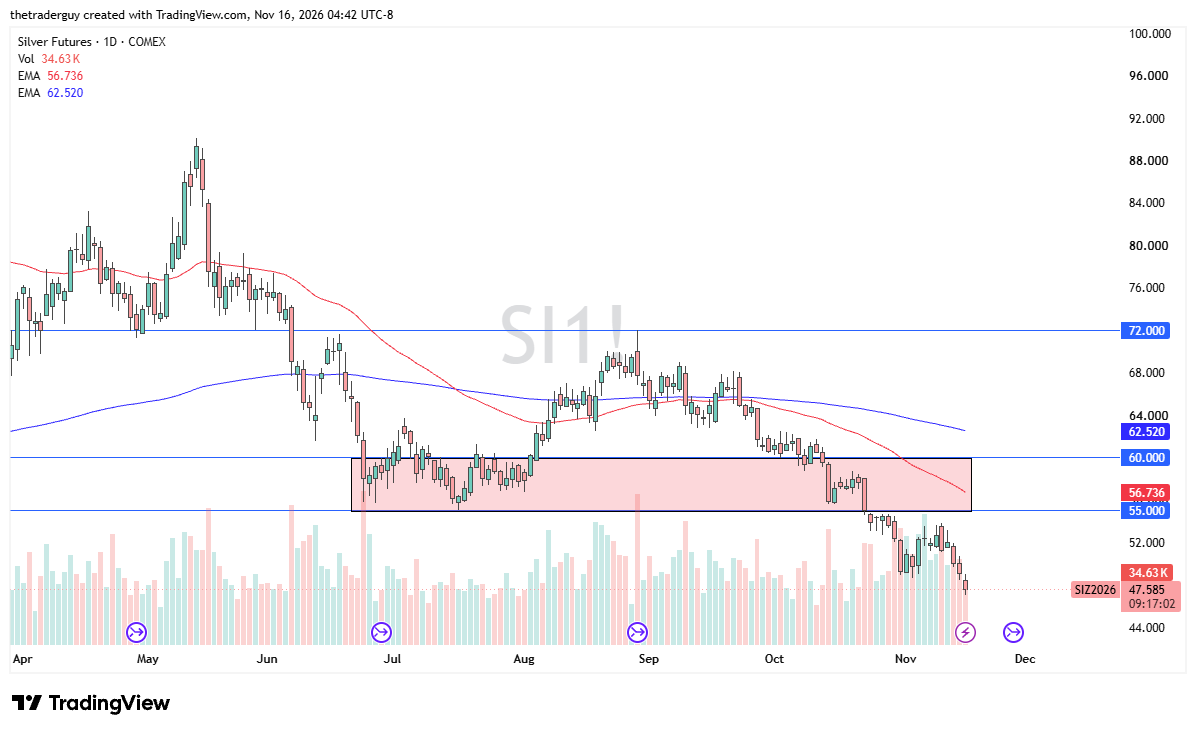
Quite frankly, at this point in time, anytime it rallies, I’m looking to short it. We are well below the $50 level, which should now have a certain amount of psychological resistance built into it because of the importance of that figure. The next major support level that I see on longer-term charts is closer to the $45 level.
If you’d like to know more about how to trade gold and silver, please visit our educational area.