


Lower Oil Has Not Changed the Silver Trade
Spot silver is holding steady early Monday with a slight bias to the upside. Mixed signals from crude oil, Treasury yields and the U.S. Dollar could be encouraging short-sellers to lighten up on their short positions. General uncertainty ahead of the Fed’s interest rate decision on Wednesday could be another factor encouraging the suspected position-squaring.
The news wires are claiming lower crude oil prices are helping to underpin gold and silver today. They say it’s because lower prices ease concerns over inflation. I think that’s too narrow-minded to consider. Crude is going to have to start swinging lower to get a real rise in silver. Today they are just lower.
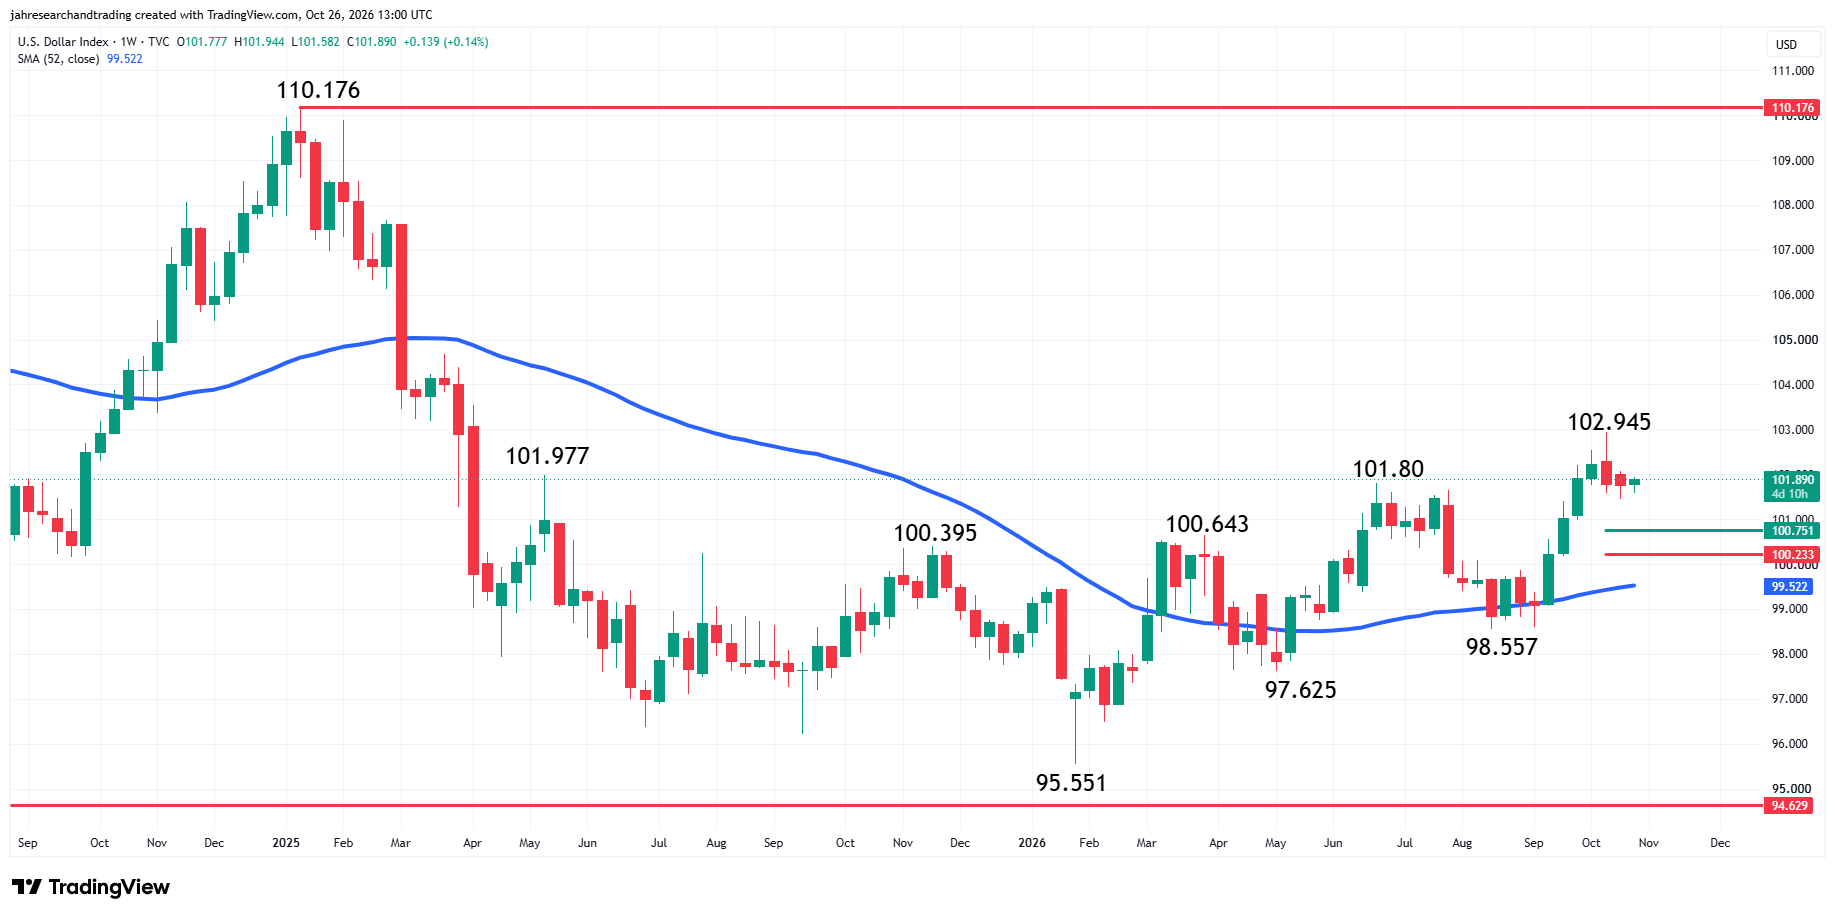
The U.S. Dollar has been under pressure the last two weeks, but prices haven’t collapsed into support at 100.751 to 100.233 or even the 52-week moving average at 99.522. The index is also trading within striking distance of its highest level since April 2025 at 102.945, which was reached just two weeks ago. As long as the dollar remains elevated, dollar-denominated silver is going to have a hard time extending rallies.
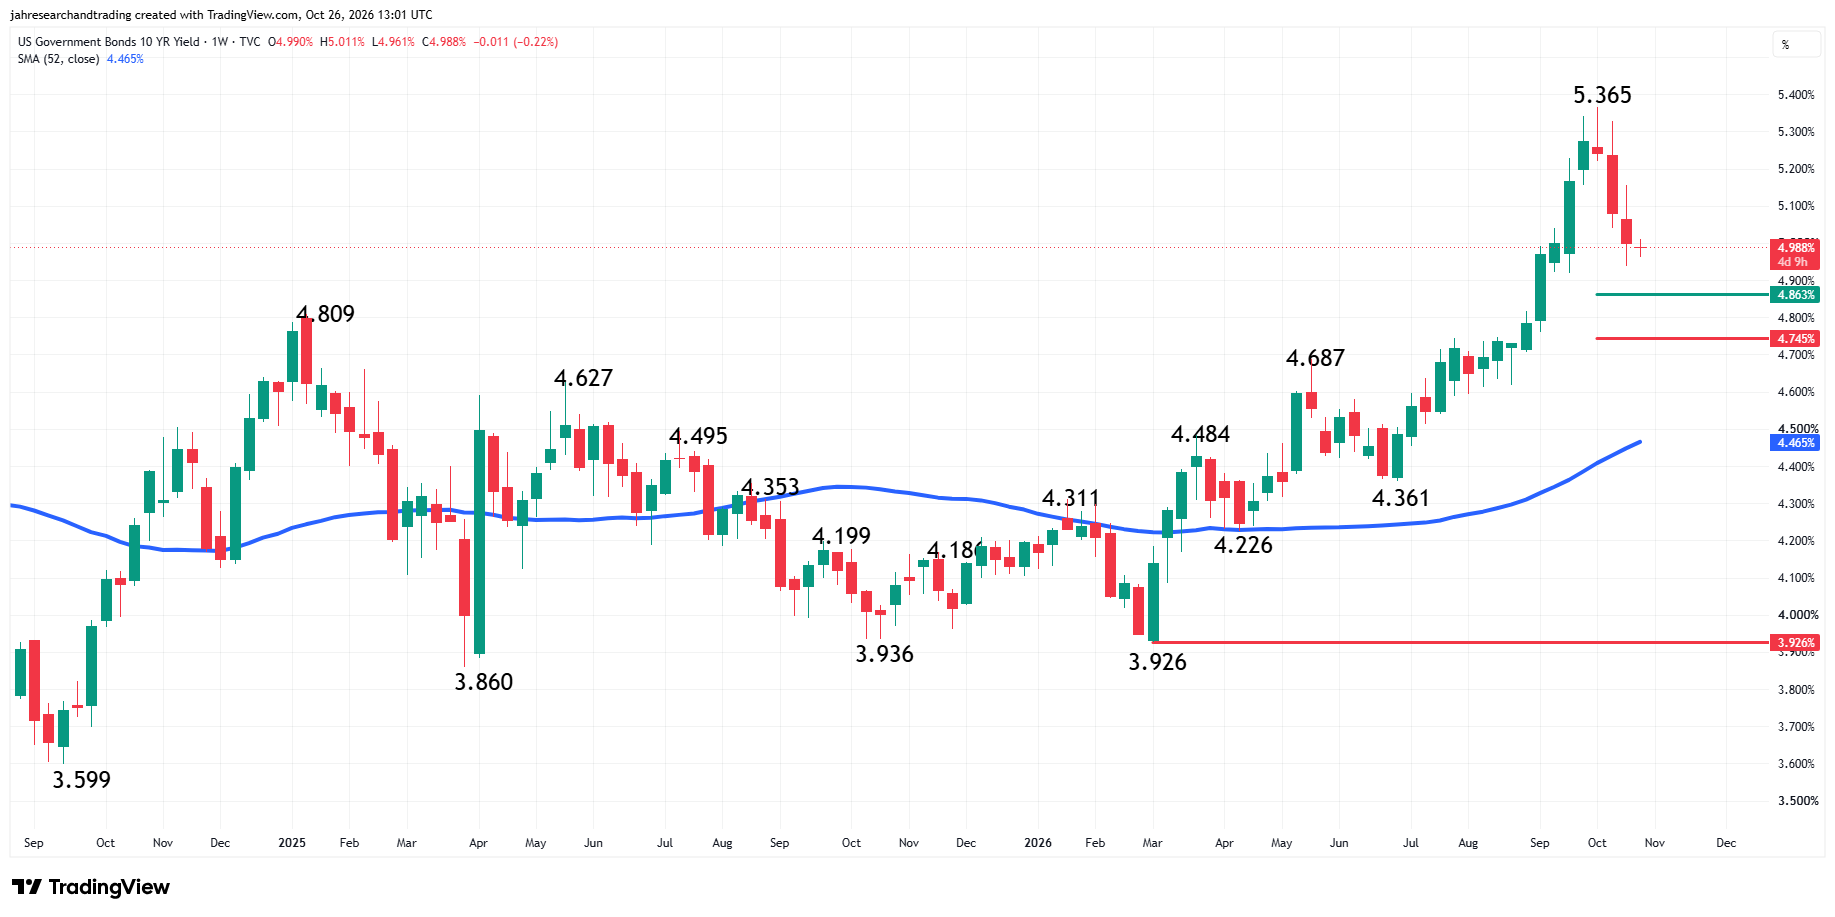
Ten-year Treasury Bond yields have fallen for three straight weeks but silver hasn’t budged. This may be because traders aren’t paying too much attention to actual yields, but rather to when the Fed will make its next rate hike. FedWatch data shows an October rate hike is nearly off the table, but the December data shows it will be a live meeting that month with about 70% probability.
Fed Week Still Holds the Risk
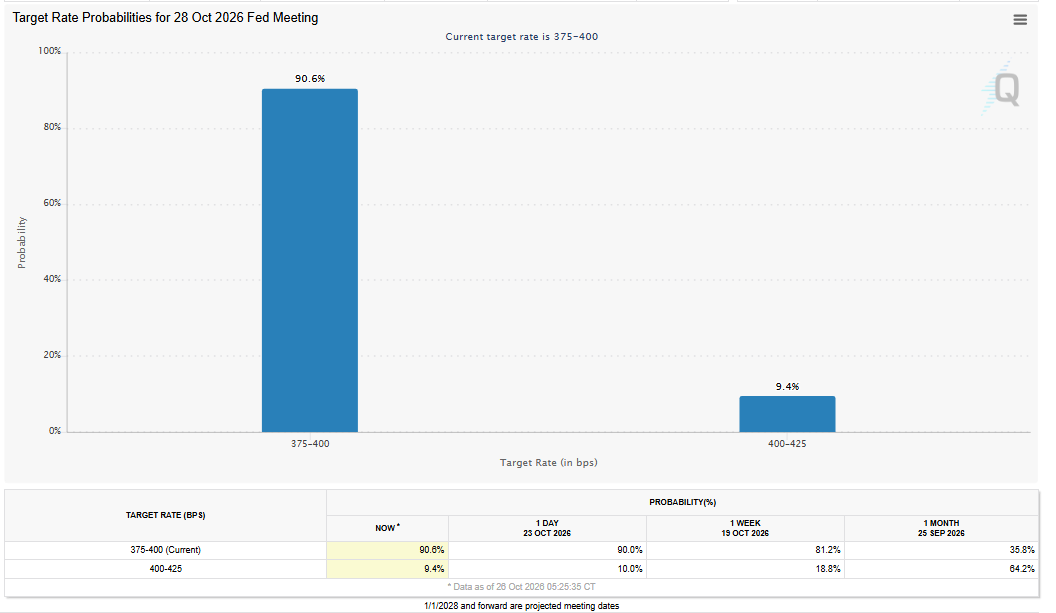
The Fed meeting starts on Tuesday, the PCE inflation report will be released early Wednesday before the rate decision is announced at 18:00 GMT. Ahead of the announcement, traders are pricing in a 9.4% chance of an interest rate hike on Wednesday. Based on the timeline, I think silver traders should pay close attention to the PCE data. If it comes in well above expectations, the Fed will still have time and perhaps the ammunition to raise rates at the meeting.
The market seems to have already priced in no rate hike, which is creating some stability. If the Fed delivers what they expect, we could see a short-covering rally. But if the Fed surprises with an unexpected rate hike, price could plunge sharply.
Silver Price Forecast
Every new Silver analysis as it publishes, today's technical signal and key levels, live price — on one page.
See all Silver forecastsWeekly Spot Silver (XAGUSD) Technical Analysis
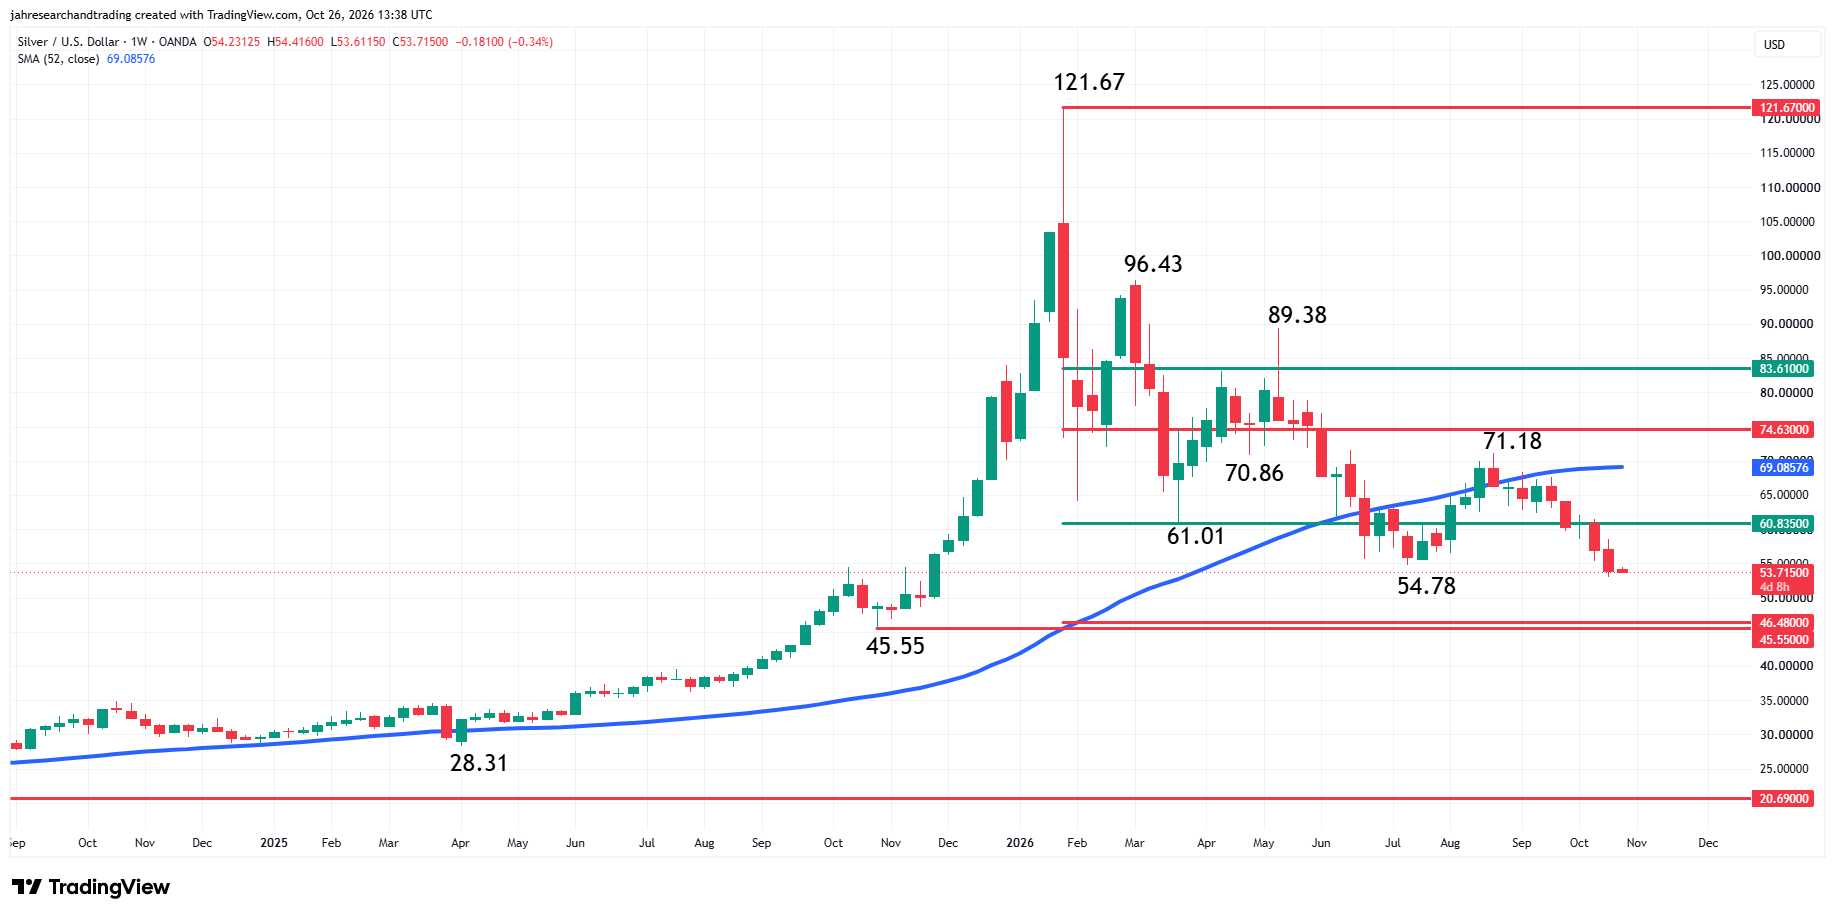
Spot silver is edging higher at the start of the week without much fanfare. The market is holding inside last week’s range. The move could be indicating investor indecision and impending volatility.
The main trend is down according to the weekly swing chart. A trade through $53.03 will signal a resumption of the downtrend. The main trend will change to up on a trade through the swing top at $71.18.
The market is currently testing a long-term retracement zone at $60.835 to $46.48. It represents 50% to 61.8% of the all-time high at $121.67. To long-term investors, this zone represents value, which may explain why the selling appears to be weakening inside it. If the long-term investors pull their bids, prices could collapse to the October 2025 main bottom at $45.55.
The market is also being pressured by the 52-week moving average at $69.09. Besides influencing the downtrend, it is also resistance and a potential trigger point for an upside breakout.
The intermediate range is $45.55 to $121.67. Its retracement zone at $74.63 to $83.61 is potential resistance.
We know the market is testing a potential value zone, but we’re not seeing increased volume or trader interest in taking out offers. This could change once the market crosses to the strong side of the 50% level at $60.835. If that occurs, we could see a surge into the 52-week moving average at $69.09. Overcoming this indicator could trigger a test and breakout over the swing top at $71.18, but sellers could reemerge on a test of the intermediate retracement zone at $74.63 to $83.61.
If buyers don’t make the first step and overtake $60.835 then this would signal that sellers are still in control. This could continue to press prices lower with the main objective, the potential support cluster formed by the 61.8% level at $46.48 and the October 2025 main bottom at $45.55. This could be the most important support cluster at this stage.
What to Watch
Weekly Spot Silver
The trade under $60.835, the swing chart downtrend and the trade on the weak side of the 52-week moving average at $69.09 have me leaning to the downside this week. My bias will strengthen if traders continue to take out bids under the former bottom at $54.78. This type of consistent downside pressure could put $46.48 to $45.55 on the radar.
A sustained move over the $60.835 pivot will signal the presence of buyers. This would weaken my downside bias. It will likely flip to the upside if traders can overcome the 52-week moving average.
I also suggest that traders pay close attention to the PCE data and the rate-hike probability before the meeting. If the target-rate probability jumps substantially from about 9.4%, then prepare for heightened volatility.
More Information in our Economic Calendar.