


Silver entered the Wednesday session with a modest improvement in one monetary condition. While its industrial backdrop remains somewhat mixed, the Treasury 10-year real yield declined 3 basis points to 2.77% on October 20. Lower real returns can reduce the opportunity cost of holding non-interest-bearing metals. Still, the single daily move does not establish either a sustained easing cycle or a verified silver price reaction.
Factory Figures
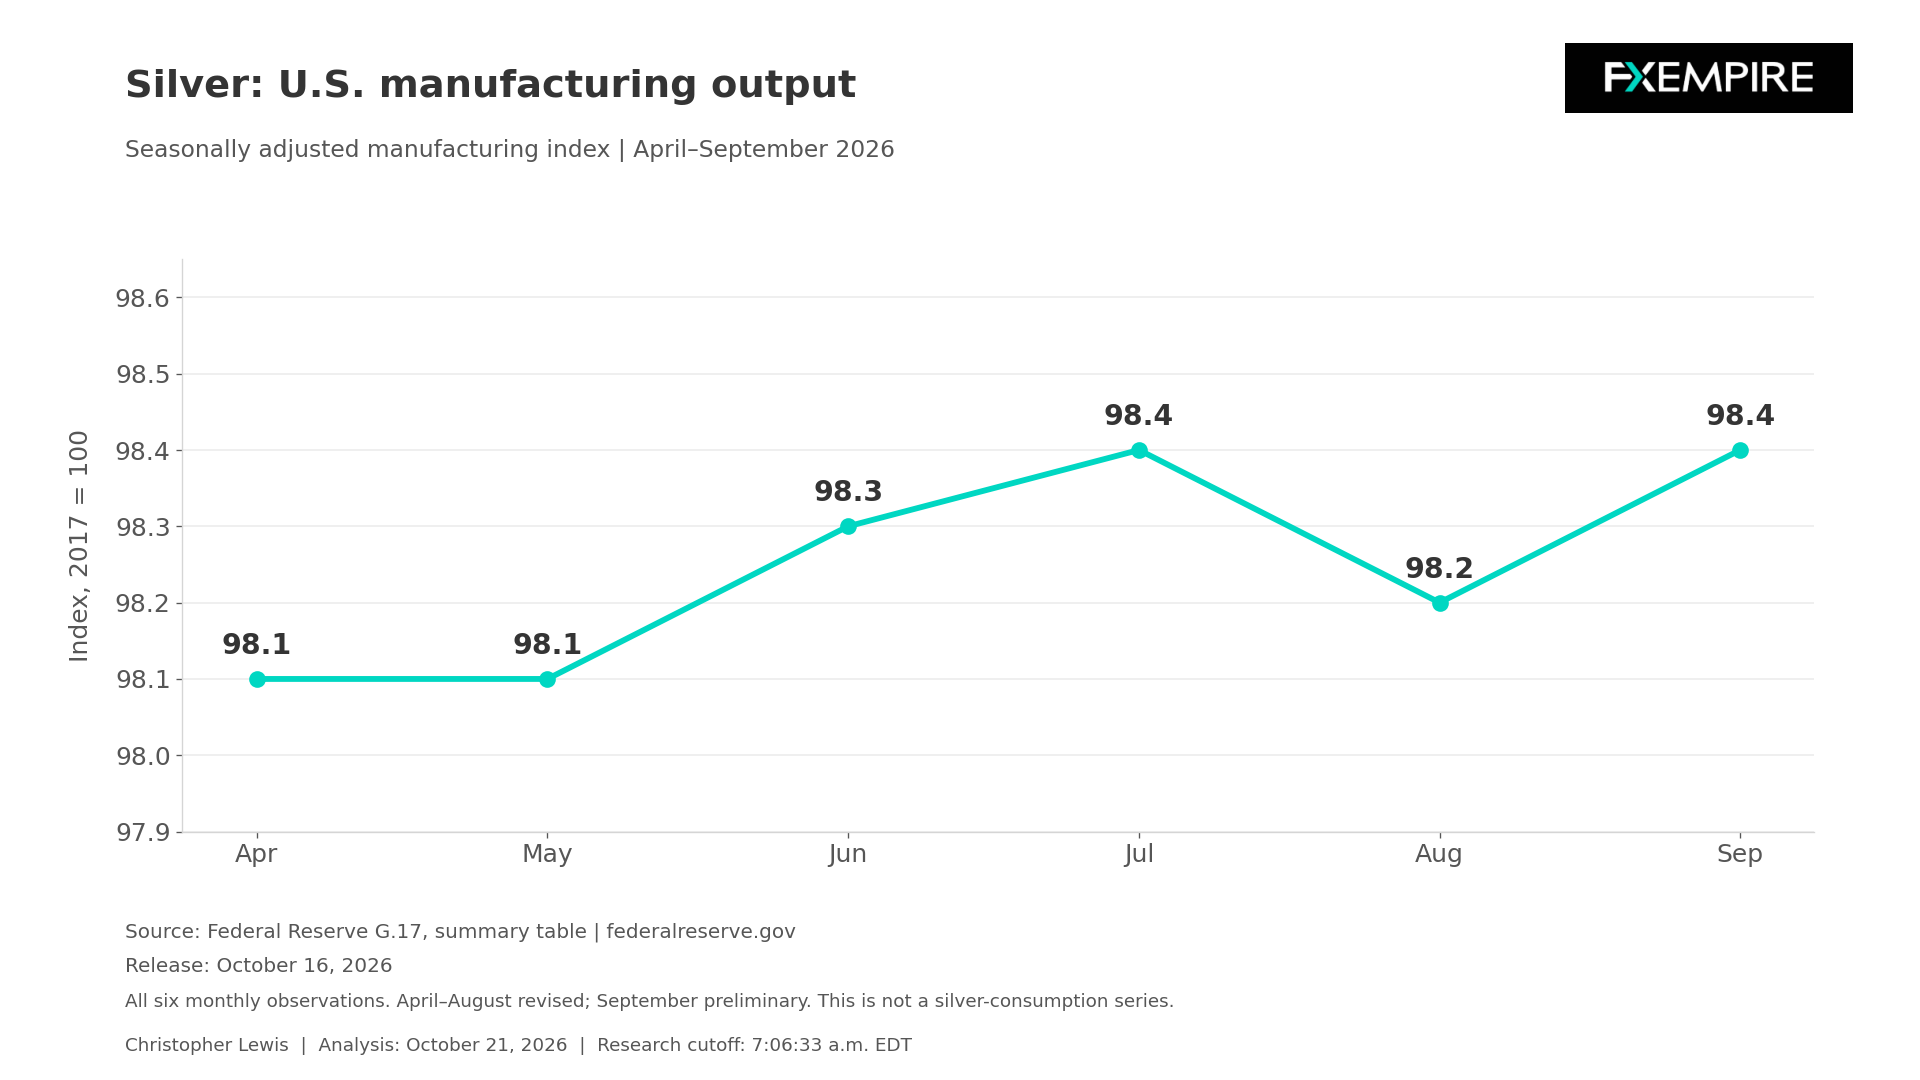
The most recent U.S. factory figures show resilience without a broad surge in general. The Federal Reserve’s October 16 release estimated that manufacturing output rose 0.3% in September, following a revised 0.2% decline in August. The seasonally adjusted manufacturing index stood at 98.4, with 2017 equal to 100. The April-to-September observations remained in a fairly narrow range, which is useful context for interpreting a positive monthly growth number.
The composition was uneven. September motor vehicles and parts output declined 3%, while electrical equipment, appliances, and components recorded a gain of just over 1%. Those industry measures are relevant to the environment in which industrial users will be operating when it comes to silver. That being said, it does not reveal how much silver was purchased, used, or held in inventory.
China
China’s supply is another constructive but qualified signal. The National Bureau of Statistics reported on October 19 that September industrial value added at enterprises above the designated size rose 5.5% year-over-year in real terms. However, fixed-asset investment excluding rural households fell 7.2% across the first 9 months of the year, and property development investment has declined 20.6%.
These releases seem to argue for selectivity in the industrial narrative. Silver’s exposure to electrical and other manufacturing activity can matter at times, but headline industrial expansion cannot be labeled a measured solar-demand increase. Changes in product mix, silver intensity, inventories, and procurement schedules can separate production from immediate metal buying.
Silver Price Forecast
Every new Silver analysis as it publishes, today's technical signal and key levels, live price — on one page.
See all Silver forecastsHousing and Financing
The October 20 U.S. housing release adds caution about interest-sensitive demand. September permits for single-family homes were at a seasonally adjusted annual rate of 845,000, down 4% from revised August. This is an authorization measure, not a completed-construction or silver-use series. It offers context for investment conditions, nothing more, nothing less.
Financing has an effect on the industrial channel as well as investment demand. If holding metal inventories becomes more expensive, manufacturers prefer small purchases even when their production plans are unchanged. If financing conditions ease, the opposite can occur.
Inflation
Inflation complicates the monetary channel. September CPI rose 0.6% monthly, and final-demand PPI rose 1.3% monthly, both seasonally adjusted in releases published October 14 and 15, respectively. Persistent cost pressures can strengthen interest in precious metals, but they can also prolong restrictive financing and weaken industrial consumer spending power. Silver investment and manufacturing characteristics can consequently pull in opposite directions.
Federal Reserve
The next Federal Reserve meeting, which is October 27 and 28, remains a policy catalyst rather than a completed decision, and this is something that traders are watching. The more supportive combination would be continued industrial resilience, evidence of physical demand, and sustained easing in real yields. A weaker combination would be renewed financing pressure along with activity failing to broaden.
The chart below focuses on the complete April-to-September U.S. manufacturing output series. Earlier months are revised estimates, and September is still preliminary. It distinguishes the level of output from the latest monthly growth rate. Fresh silver-specific exchange inventories, mine supply changes, and positioning were not independently verified before I put this series of numbers together.
Technical Analysis
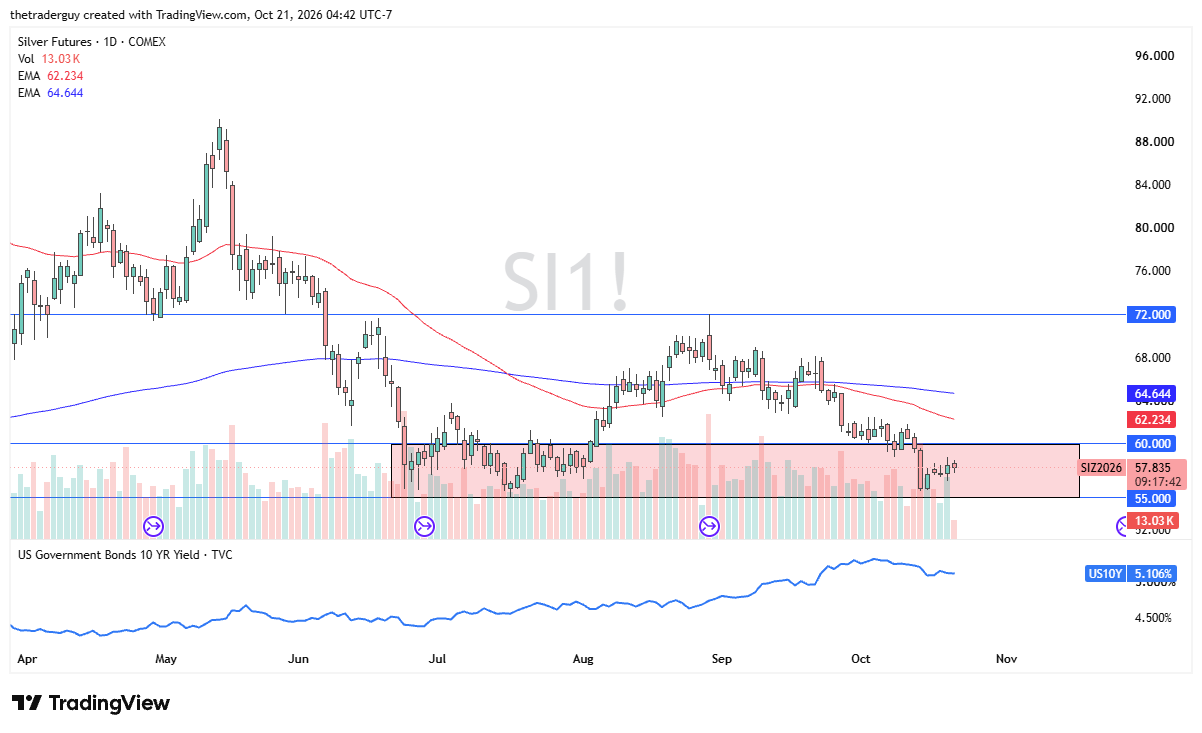
From a technical analysis standpoint, silver seems to flounder between $55 on the bottom and $60 on the top.
It is a previous demand zone and an area that a lot of people will be watching closely, as the $55 level is a bit of a hard floor in the market, and this demand level had been important a couple of times in the past. It is not until we break above $62 that I think this area has been left and bullish pressure continues.