


Silver has had a negative week, as there seems to be a bit of an unresolved conflict between resilient economic activity and persistent inflation. Wednesday’s Federal Reserve decision and Thursday’s GDP and PCE releases supplied the most consequential developments. Combined, they left investors with evidence of continued demand but no announced transition to easier monetary policy by authorities.
Fed Decision
On October 28, the Federal Reserve held its target range at 3.75% to 4%. The vote was 10 to 2, with the dissenters preferring a 25-basis-point increase. The significance of silver is the idea of a policy pivot. A pause allows further assessment by the Federal Reserve but does not commit officials to a subsequent cut. Equally, the fact that there were two voters dissenting does not establish that another increase will occur, but it certainly suggests that some were thinking of it.
PCE and Inflation
The PCE report on Thursday sharpened the inflation question. Headline prices rose 0.5% month over month and 3.6% year over year. Excluding food and energy, the increases were 0.3% and 3.1%. Those are September observations, so they should not be confused with the quarter-on-quarter numbers in the separate GDP report.
I interpret this as inflation protection and financing costs being competing influences. Persistent inflation can support interest in precious metals while also delaying the lower rates investors might prefer. Silver adds an industrial dimension, obviously, as restrictive financing can work against manufacturing demand.
Demand Evidence
The demand evidence was mixed across time frames. The BEA estimated real final sales to private domestic purchasers at 4.9% annualized in the third quarter, versus 4.6% in the second. Yet September real consumer spending rose less than 0.1%, rounding down to 0%. Quarterly resilience and a soft monthly finish can coexist, as shown by the data.
Silver Price Forecast
Every new Silver analysis as it publishes, today's technical signal and key levels, live price — on one page.
See all Silver forecastsThis distinction would matter for a longer-term outlook, as spending on services or equipment can have very different material requirements. Manufacturers may meet stronger orders from inventories before expanding output, while greater efficiency can reduce metal use per unit. A convincing industrial-demand argument needs confirmation from production and actual consumption before feeding through to the price chart.
Real Yields
Real yields have offered a bit of relief over the last several sessions, as the Treasury’s 10-year real par yield moved from 2.66% on Monday to 2.63% on Thursday. The 5-year moved from 2.37% to 2.31%. Lower competing real returns can improve the appeal of holding silver, but the correlation does tend to be variable.
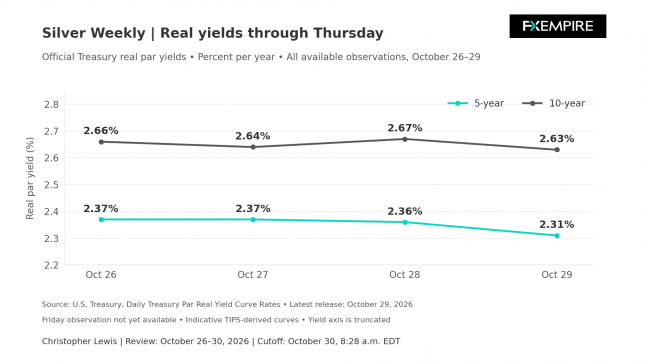
Futures markets are seeing massive selling in silver at the moment, and it certainly looks as if those real yields, despite the fact that they are slumping, are still taking away some of the allure of holding the metal.
Upcoming Announcements
Next week brings the September JOLTS on Thursday at 10 a.m. Eastern, preliminary third-quarter productivity and costs on Thursday, November 5, at 8:30, and October’s employment situation on Friday, November 6, at 8:30. Labor demand, productivity, and compensation can change the policy interpretation as usual, so the releases should be looked at as an aggregate.
A strong payroll report would not necessarily be positive. It could support consumption expectations while reducing urgency for policy relief. A weak report could create the reverse tension. The more useful distinction will be whether employment, wages, and productivity describe sustainable expansion or deterioration in purchasing power and business confidence.
The best-case scenario would be resilient real demand and moderating cost pressure, as well as less demanding competing yields. As things stand right now, silver is facing major headwinds.
Technical Analysis
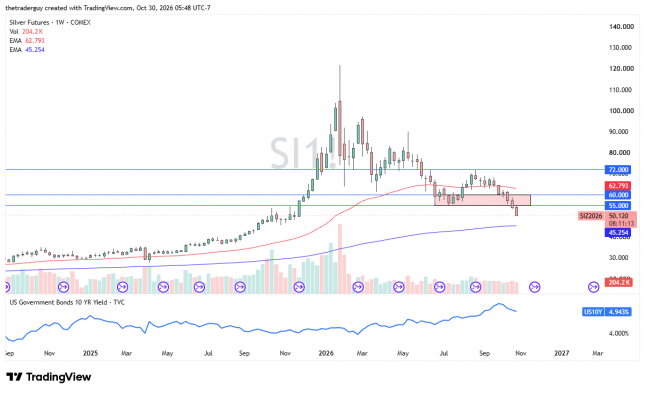
The technical analysis is very troublesome at the moment, as the silver market is threatening a plunge below the $50 level. If this occurs, we could see a bit of a rush to the downside, just as a bounce from this level could be a positive sign. The next candle could speak volumes about the next move.