


Spot silver (XAGUSD) is edging lower late in the session on Friday, but a little off its intraday low and lowest level since November 25, 2025. The catalyst behind today’s weakness is higher energy prices. They are fueling persistent inflation concerns while reinforcing U.S. rate hike expectations ahead of the October 28-29 Federal Open Market Committee policy meeting.
At 18:57 GMT, Spot Silver is trading $53.99, down $0.60 or -1.10%. The low of the session is $53.03. The high is $54.75. Additionally, it is currently down over 5% for the week.
Rising Crude is the Major Issue
International benchmark Brent crude oil reached a five-month high early Friday and that seems to be all silver traders needed to cap gains and keep the precious metal under pressure. Essentially, it was Houthi attacks in Saudi Arabia that generated increasing concerns over a further disruption to energy supplies.
Because inflation is still a major headache, the major central banks won’t be able to cut interest rates or ease up on monetary policy as quickly as they’d like. Right now, that’s a tough hurdle for silver investors hoping for a rally.
Silver is also being impacted by the sharp sell-off in the global equity markets. Weakness in leveraged positions in volatile technology stocks is leading to margin calls, which is forcing some hedge funds to sell silver to meet the margin call.
Switching back to the rate hike concerns, the market now largely expects the Federal Reserve to leave policy unchanged at next week’s meeting, but December is still a major worry. According to the FedWatch Tool, there is a 92% chance of the Fed leaving rates where they currently are and a 78% probability of a 25 basis point hike in December.
Looking ahead, the U.S. Personal Consumption Expenditures (PCE) report, the Fed’s preferred inflation gauge, is due to be released on October 29. It could offer further insight as to the state of inflation. It will be released shortly before the Fed concludes its policy meeting so it may have an impact on its decision. Earlier in the month, stronger-than-expected U.S. consumer and producer inflation numbers supported the case for tighter monetary policy later this year.
Silver Price Forecast
Every new Silver analysis as it publishes, today's technical signal and key levels, live price — on one page.
See all Silver forecastsWeekly Spot Silver (XAGUSD) Technical Analysis
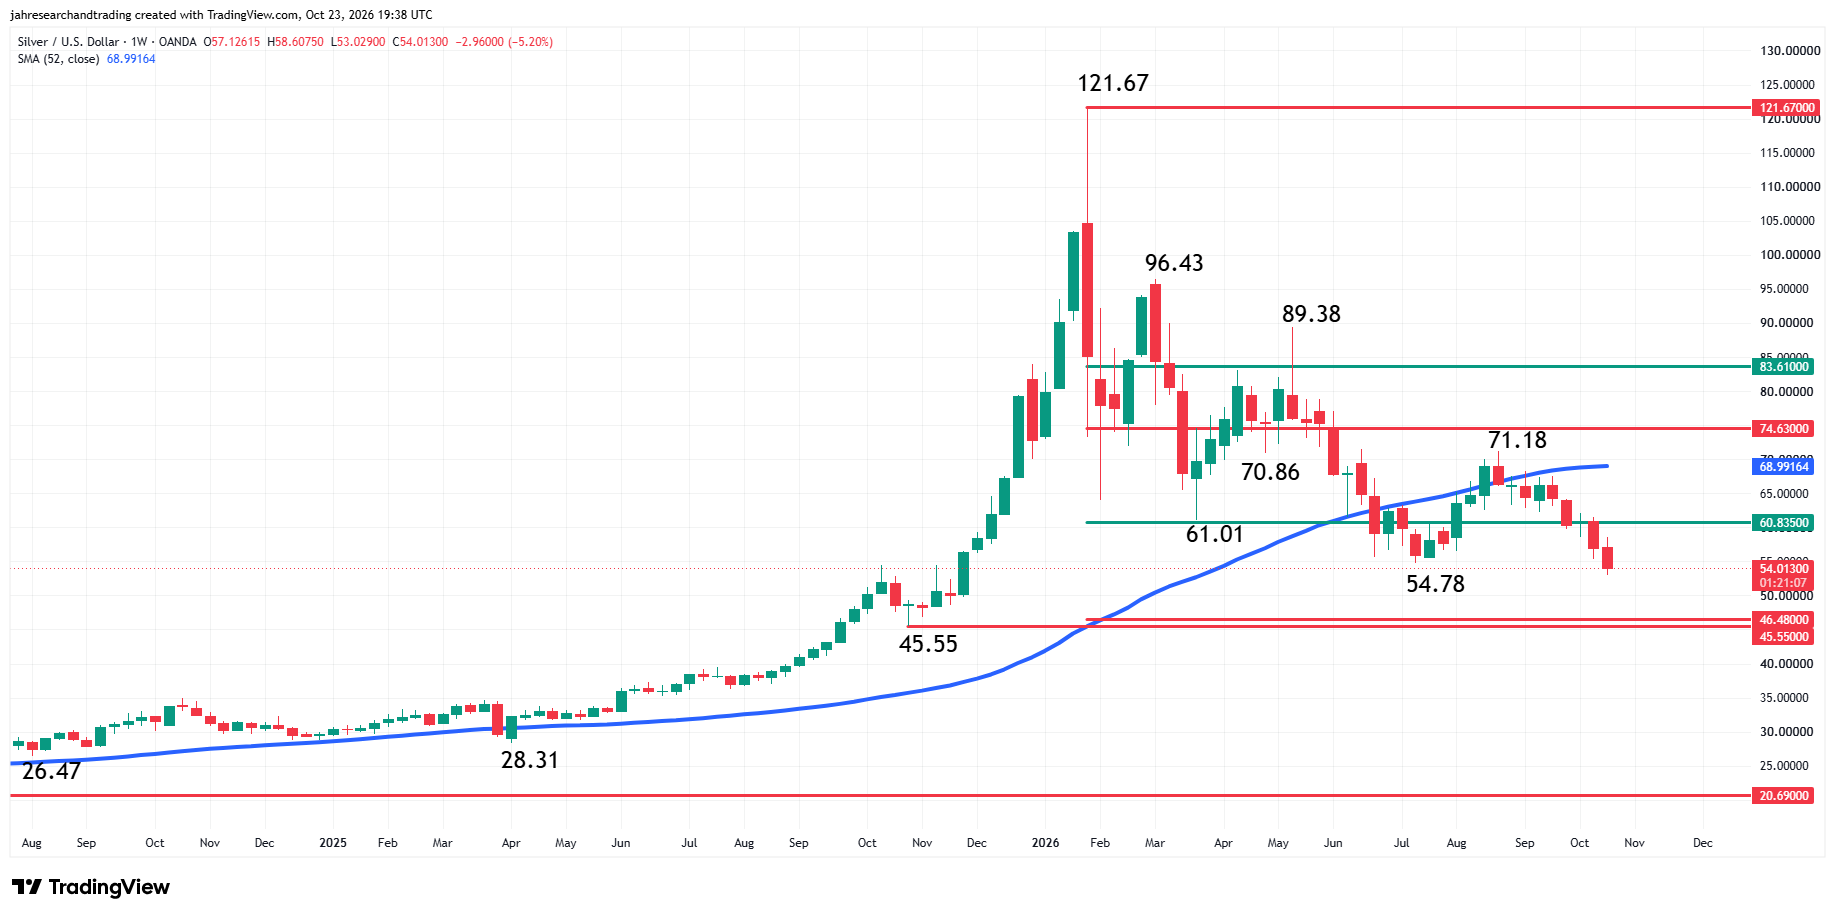
Spot silver is set to finish sharply lower this week.
The main trend is down according to the weekly swing chart. A trade through $71.18 will change the main trend to up. Taking out this week’s low at $53.03 will signal a resumption of the downtrend.
The market is currently trading inside a long-term retracement zone at $60.835 to $46.48. To some investors, this area represents value.
Spot silver is also trading on the bearish side of the 52-week moving average at $68.99.
The primary driver of my downside bias on the weekly chart is the market’s relative position to the 52-week moving average. The trading action since July, however, is showing signs that some investors are recognizing the importance of the $60.835 to $46.48 retracement zone. Overcoming $60.835 will weaken my bearish outlook. The major target zone on the weekly chart is $46.48 to $45.55. Aggressive counter-trend buyers could re-emerge on a test of this area.
Daily Spot Silver (XAGUSD) Technical Analysis
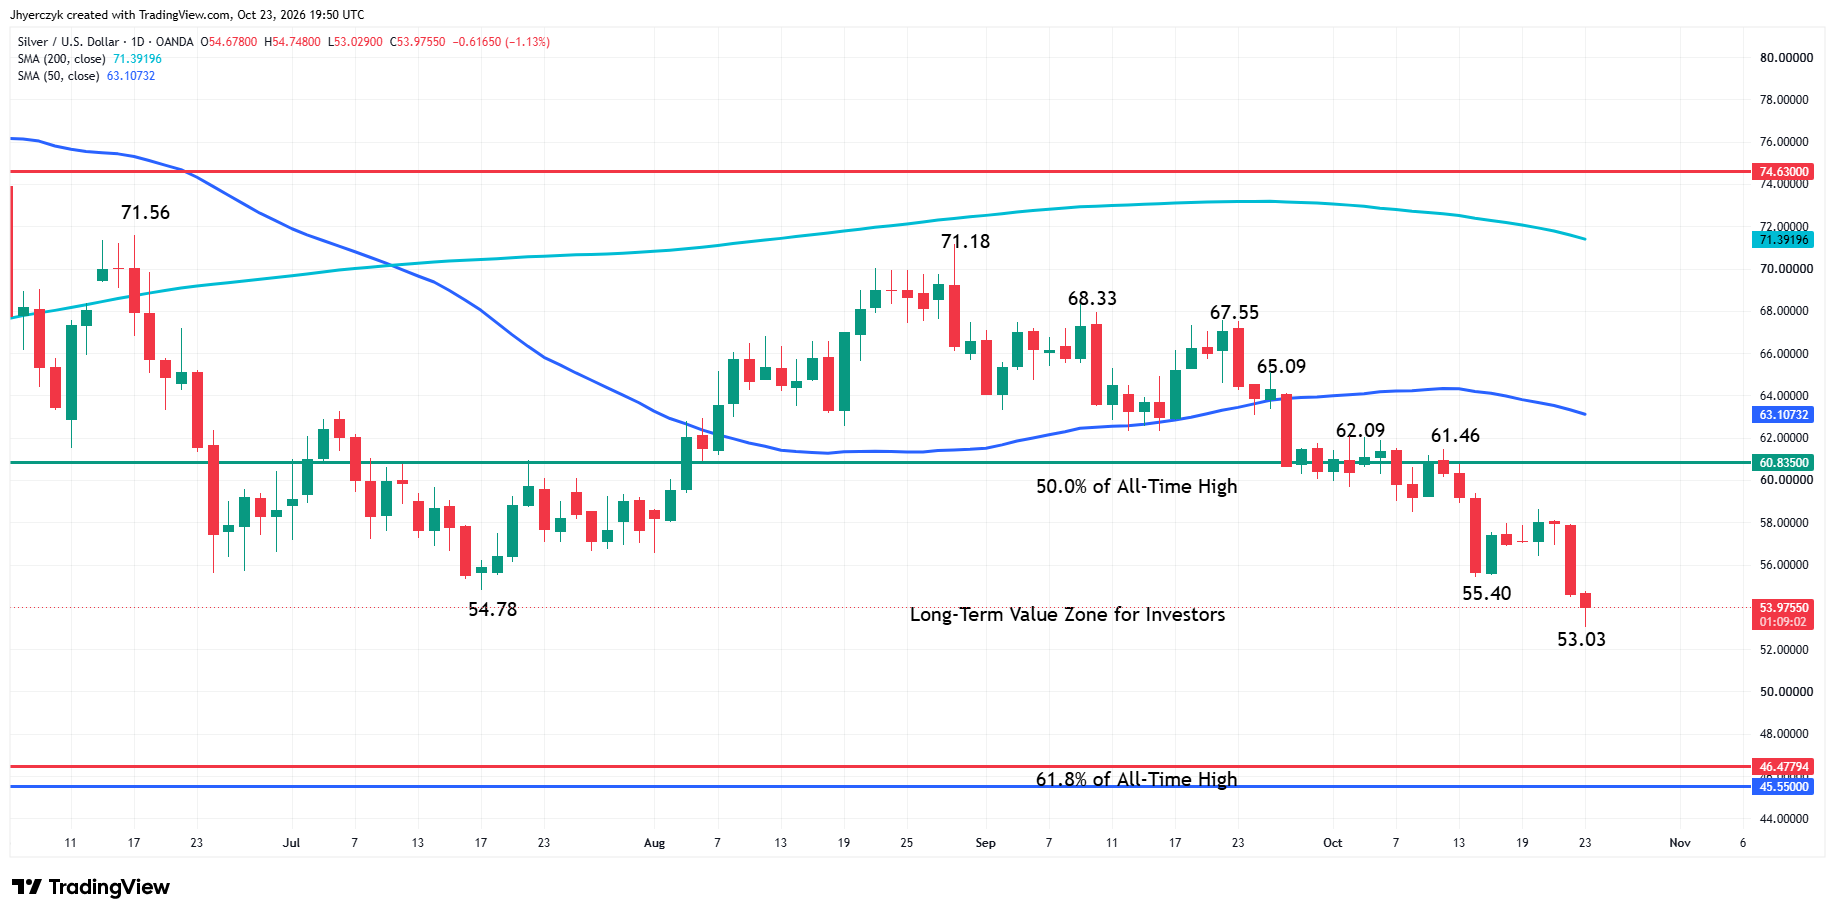
Spot silver is lower on Friday, but recovering from early session selling. The main trend is down according to the daily swing chart. A trade through $53.03 signal a resumption of the downtrend. The main trend will turn up on a move through the last main top at $61.46. This will put it on the strong side of the long-term 50% level at $60.835 and on the weak side of the 50-day moving average at $63.11.
My bias is to the downside. It is supported by the downtrend on the swing chart and the persistent trade on the bearish side of the 50-day moving average. XAGUSD is currently trading inside a major value area defined by $60.835 to $46.48. Despite the downtrend, value buyers can step in at any time to produce counter-trend short-covering rallies. However, they are not likely to be a concern for short-sellers until they overcome the long-term 50% level at $60.835 and the 50-day moving average at $63.11.
More Information in our Economic Calendar.