


Early Bullish Signals Emerge
Silver continued to show short-term signs of strengthening on Monday, triggering a one-day bullish reversal signal with a breakout above Friday’s high. A rise to $53.55, at the time of writing, followed the first pullback after an advance last Wednesday that reclaimed the 10-day moving average. Volume confirmed broadening participation, as it rose above the 20-day average volume and remained above it for the subsequent two days.
Since a breakdown below both the 20-day moving average and a rising trendline occurred on September 28, there has not been a sustained reclaim of that average. Bullish price action since then suggests that a bottom for the bearish correction may have been reached, although it is still early and additional signs of strength are needed to confirm a potential trend reversal.
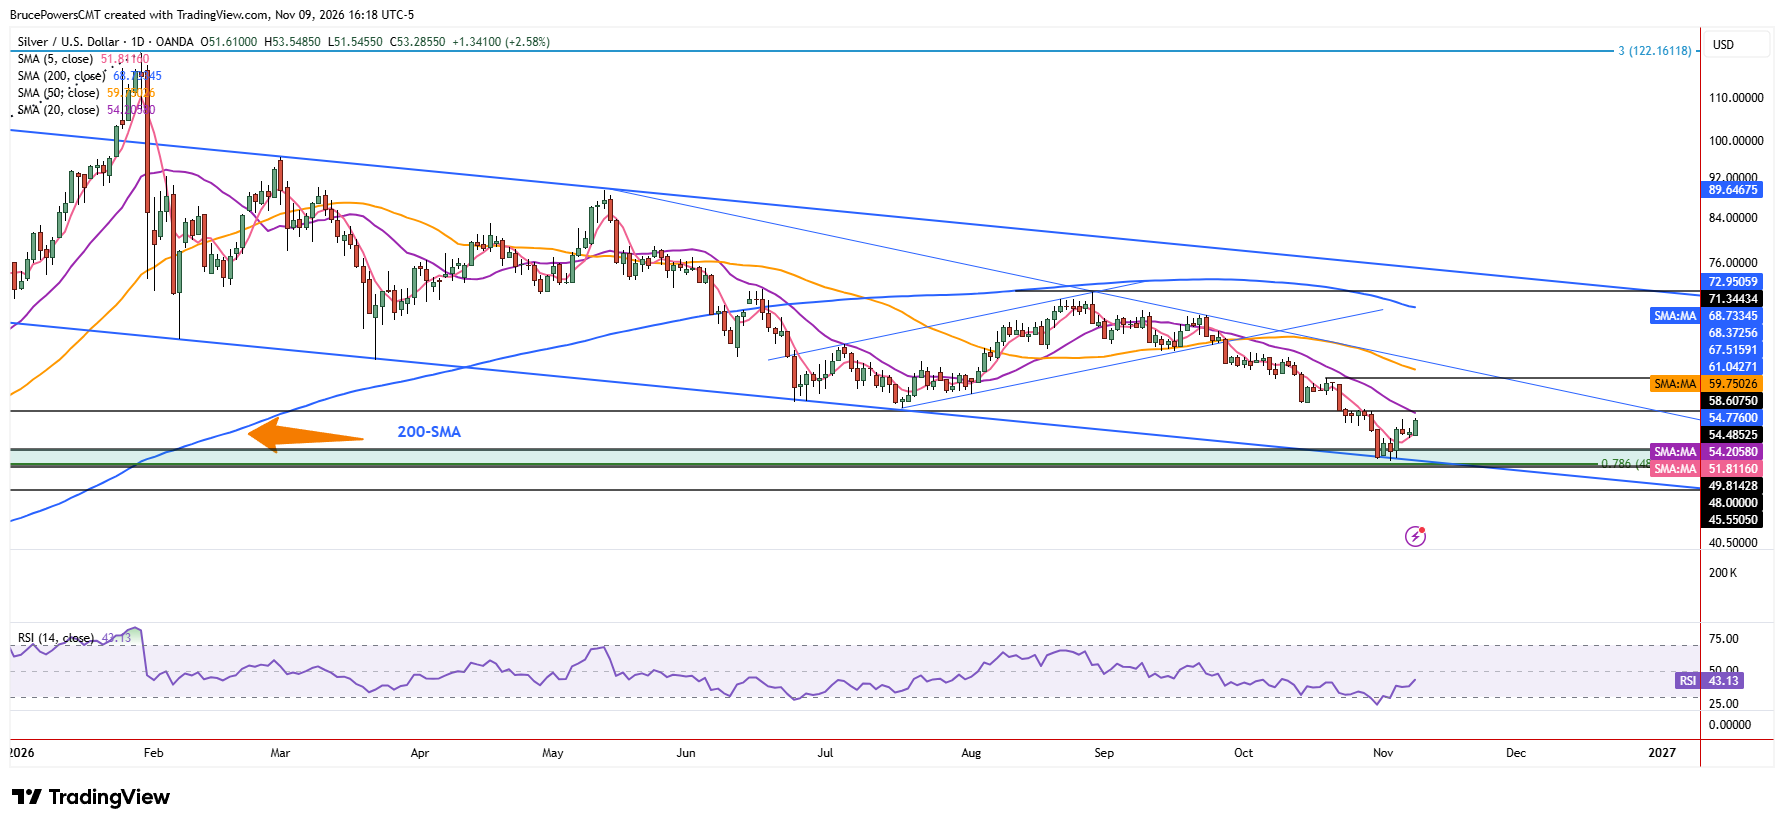
Downtrend Resistance Meets Stronger Support
Although this short-term bullish price action could result in further signs of strength, confirmation remains elusive. Silver remains in a downtrend, with dynamic resistance near the falling 20-day moving average, currently near $54.18. That average is also below the prior swing low of $54.78. If it continues to mark resistance, the bearish trend remains intact. A rise above it, however, would show further strengthening, with the next confirmation level at the four-day resistance zone at $54.63. But for this scenario to unfold, support should be retained above the 10-day moving average, now near $51.72.
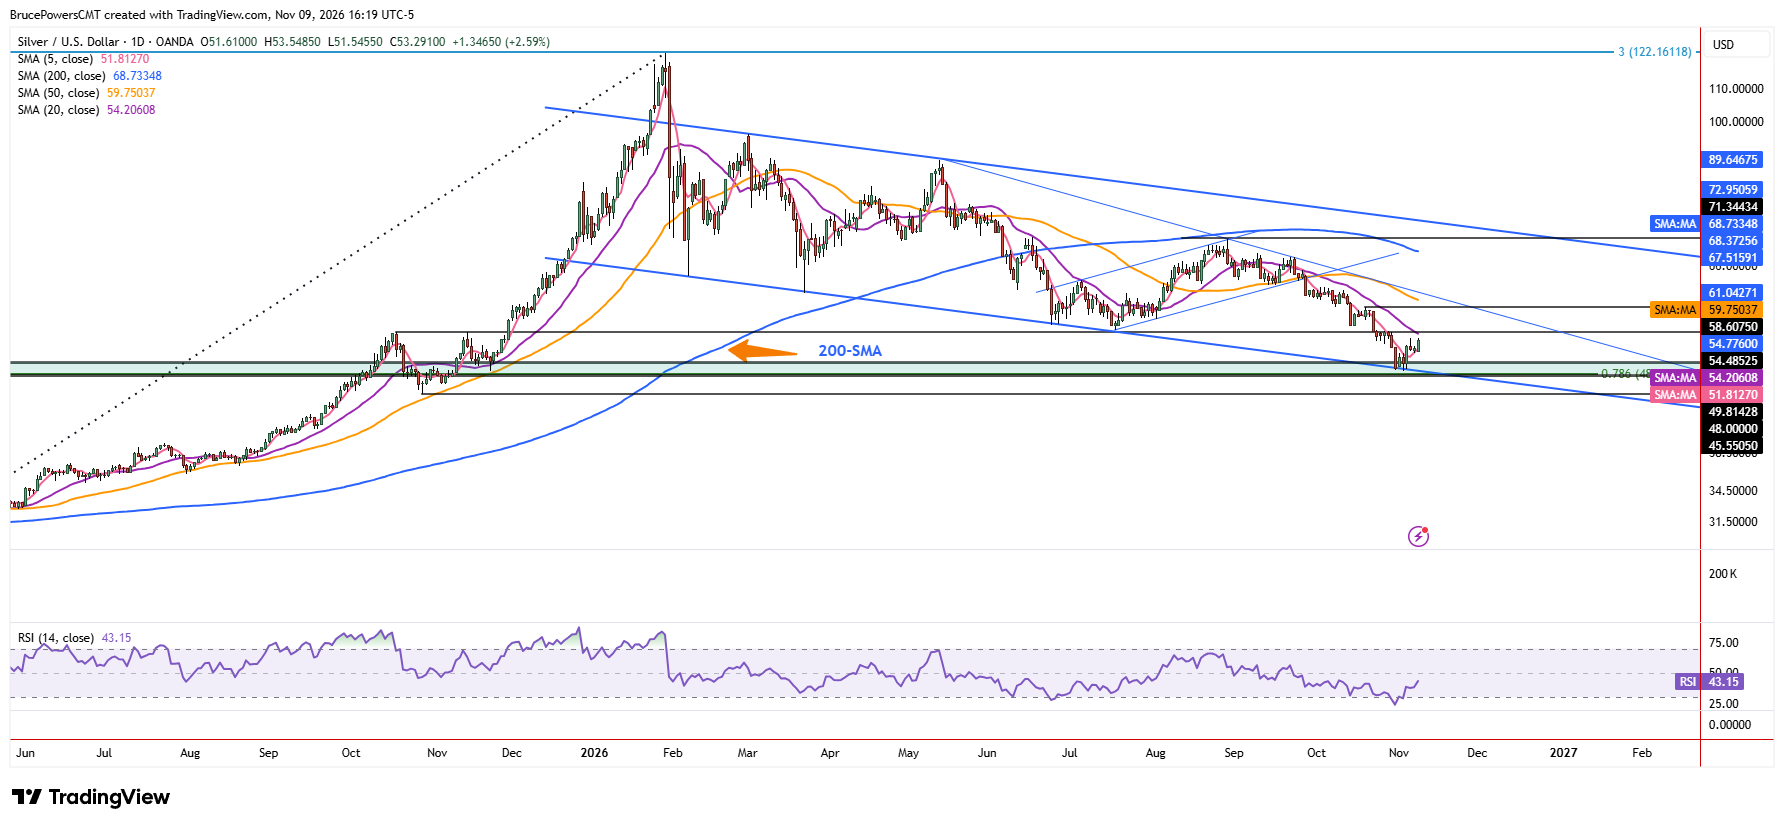
The bearish correction found support at a low of $48.62 last Wednesday, reinforced by a prior support zone from November 2025 and the 78.6% Fibonacci retracement of the prior advance from the April 2025 low. In addition, that low was at the lower boundary of a falling trend channel. Once a bullish reversal is sustained, the upper boundary of the pattern becomes a potential target, supporting the idea that support may hold and be followed by bullish momentum.
Higher Targets Await Reversal Confirmation
A more significant upside target is the lower swing high of $58.61, followed by the falling 50-day moving average at $59.75. That moving average has been declining since the September breakdown, when it marked support. Notably, Monday’s advance also signaled a weekly reversal above last week’s high of $53.48 would signal a reversal on that timeframe and provide further evidence of improving demand. That would add to Monday’s initial bullish signal and strengthen the case that silver’s corrective decline may be nearing completion.
If you’d like to know more about how to trade gold and silver, please visit our educational area.