


Major Support Confluence Under Pressure
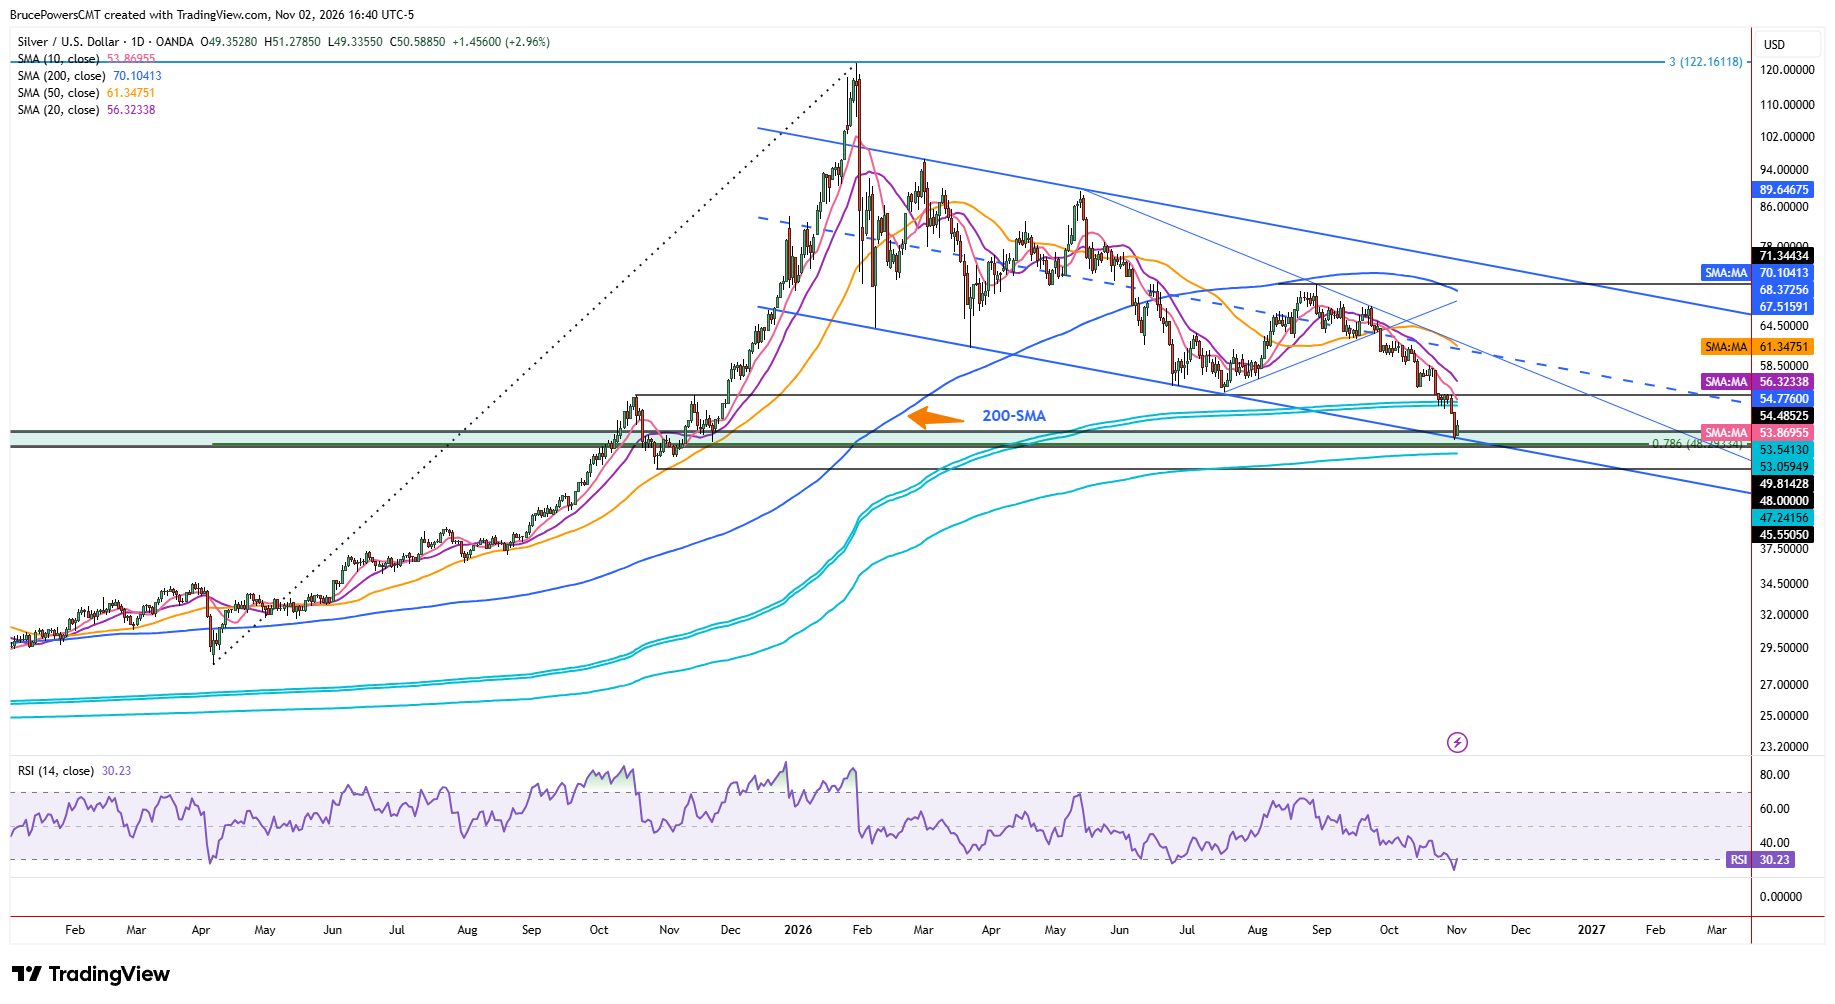
Silver declined to a new corrective low for the bearish trend at $48.86 on Friday, before finding support and bouncing during Monday’s session. The low fell within an initial key support zone defined by the confluence of the lower boundary of a falling channel, the peak from 2011 at $49.81, the 1980 high of $48.00, and the 78.6% Fibonacci retracement of the prior advance that began from the April 2025 swing low at $48.29. That April 2025 low of $28.32 also marked the low for that year.
Long-Term Breakout Faces Its First Test
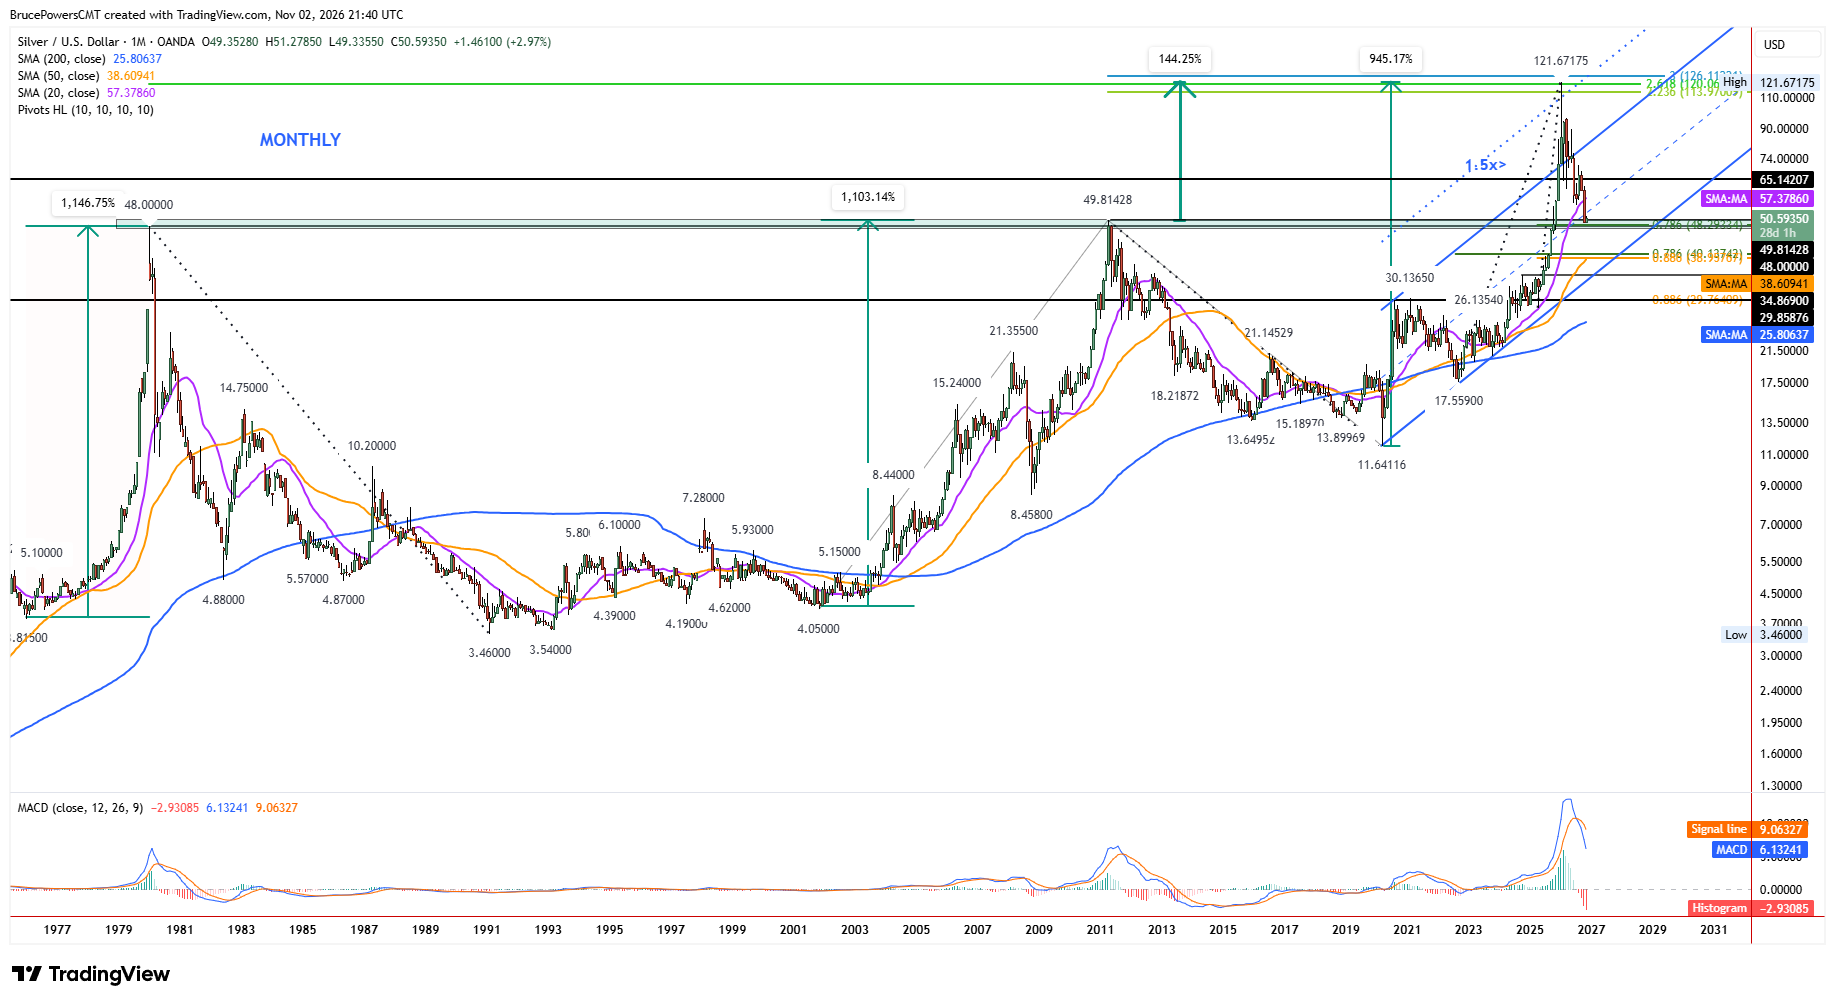
The significance of the $49.81 to $48.00 support zone is reinforced by price action on the long-term monthly chart. It shows the current decline as the first pullback after a long-term base breakout, which was confirmed with a monthly close above the prior high of $49.81 in November 2025. A full pullback to test those prior long-term highs as support establishes a key pivot zone. It has the potential to mark the completion of the bearish correction or provide temporary support before lower levels are tested.
Resistance Levels Define Recovery Potential
Monday’s lower daily high of $51.28 is key near-term resistance and a rally above it could lead to a test of resistance in a range from approximately $52.67 to last week’s lower high of $54.63. That range includes the falling 10-day moving average at $53.89 and two anchored volume-weighted average price (AVWAP) lines measured from key swing highs and lows in 2020. Higher up, the 20-day moving average near $56.22 marks another dynamic resistance level, followed by the 20-month moving average on the monthly chart near $57.39 and falling.
Monthly Weakness Raises Further Downside Risk
The longer-term technical picture also highlights increasing downside risk. Weakness on the monthly chart was confirmed by a monthly close for October below the 20-month moving average for the first time since around February 2024. That confirms deteriorating monthly momentum and supports the possibility that silver could eventually decline below $48.00. A sustained break below that level would shift attention to the next lower support zone, defined by the higher swing low of $45.55 from October 2025.
Silver Price Forecast
Every new Silver analysis as it publishes, today's technical signal and key levels, live price — on one page.
See all Silver forecastsIf you’d like to know more about how to trade gold and silver, please visit our educational area.