


The latest week in the silver markets exposed the difference between a long-run supply deficit and immediate buying pressures. The metal is still on course for a weekly loss after the Thursday sell-off, which, of course, shocked the market.
Deficit Still Remains
The Silver Institute’s new annual balance forecast argues against treating the decline as proof that the structural supply issue has disappeared. The Institute, using metals-focused estimates, sees 2026 demand falling 5% to 1.081 billion ounces, with supply of 1.045 billion ounces and a 35 million-ounce deficit being the picture. That would be the sixth consecutive annual deficit, but smaller than the 54 million-ounce shortfall estimated for the previous year.
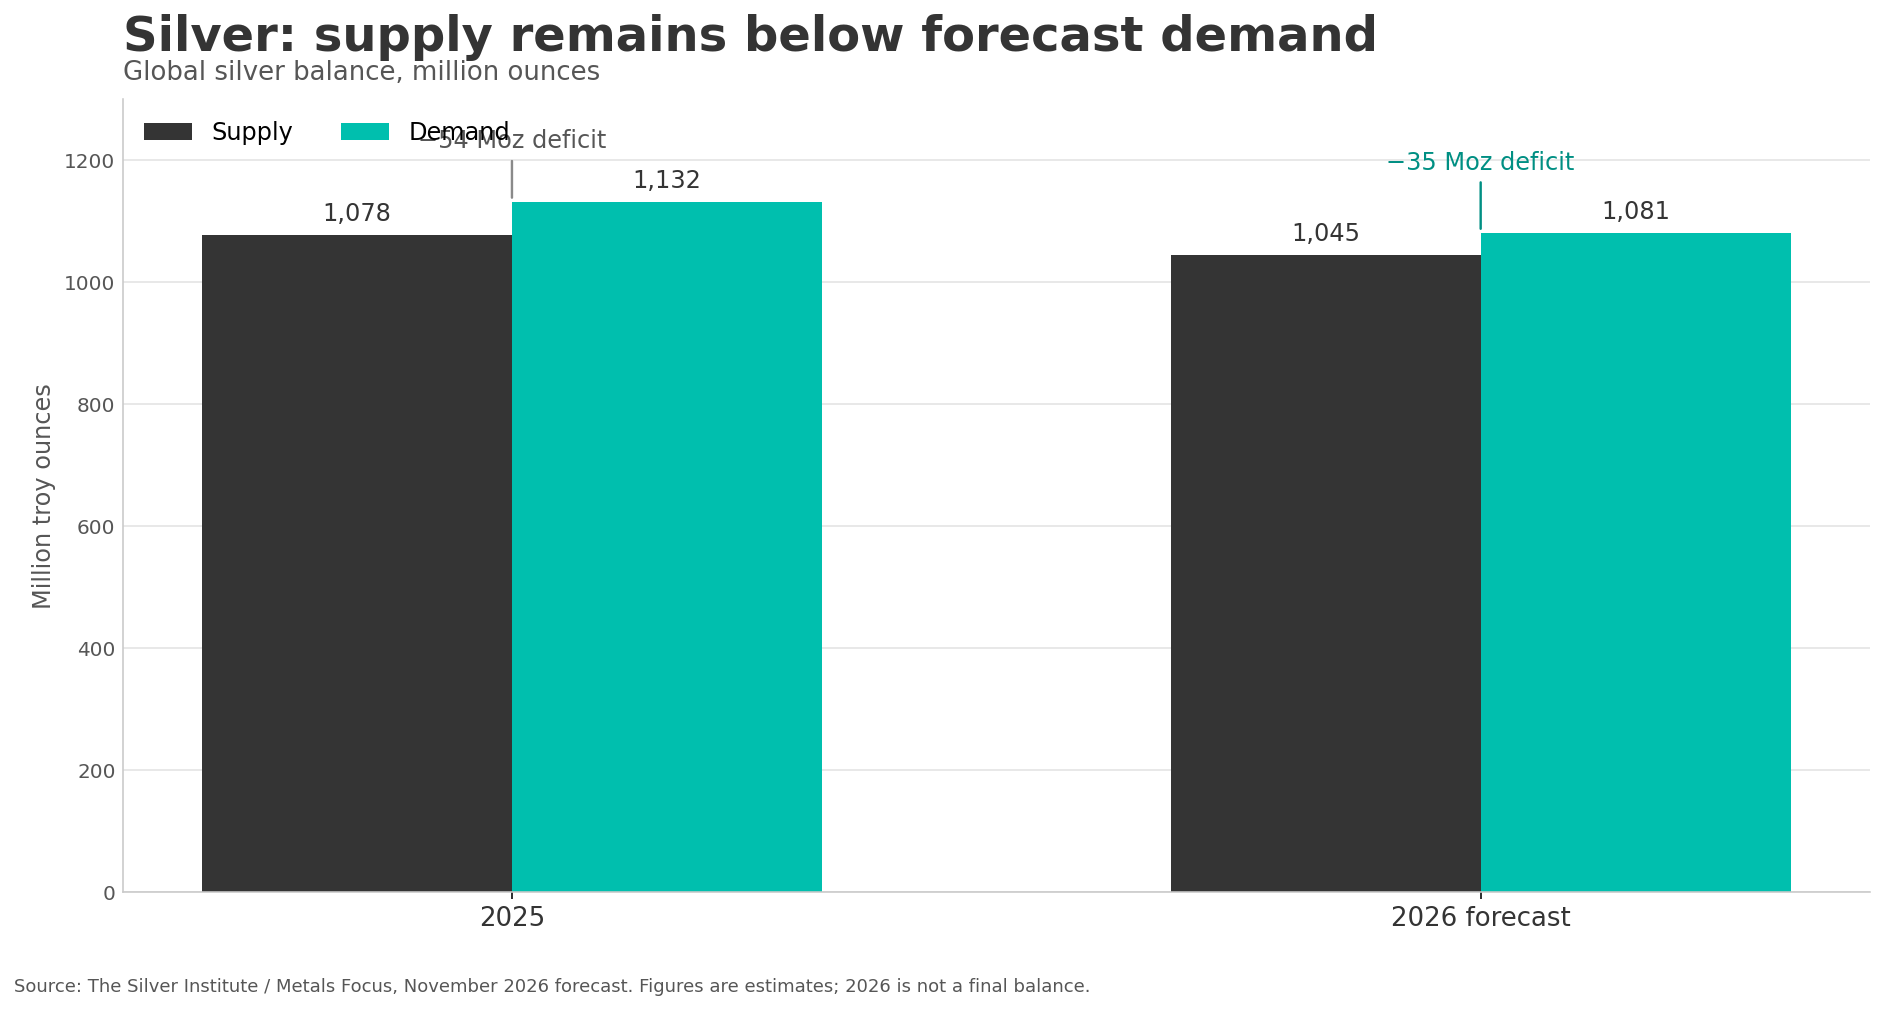
Cumulative deficits are substantial, but the current-year gap is narrowing. The same report forecasts 45 million ounces of net ETP flows for 2026, with holdings at 1.25 billion ounces early in November. Metal released through selling, together with the smaller deficit, has eased physical market tightness.
Uneven Industrial Demand
Industrial demand is uneven at the moment. Total industrial use is forecast to fall 3% to 640 million ounces, largely because solar installations have missed expectations and high prices are encouraging manufacturers to use less silver per panel or substitute other materials. Industrial demand is forecast to rise 4.5% to 492 million ounces, supported by vehicle electrification, charging equipment, brazing alloys, and solders.
Jewelry and silverware demand are projected to fall 22% and 17%, respectively, as high prices curb purchases. This split will matter. Silver retains a broad industrial role, but the latest forecast does not supply a simple story of accelerating demand across every potential end market for the metal.
Silver Price Forecast
Every new Silver analysis as it publishes, today's technical signal and key levels, live price — on one page.
See all Silver forecastsFinancial Conditions Have Been a Headwind for the Whole Precious Metals Complex
The Treasury’s 10-year real yield rose 23 basis points, from 2.63% on November 6 to 2.86% on November 12. October CPI rose 0.4% month over month, with core CPI up 0.3%. October PPI then rose 0.3% month over month, but 6.5% year over year.
The slower monthly PPI increase is a partial relief, while the annual rise and the 0.5% increase in final demand excluding food, energy, and trade services keep inflation concerns alive. Higher real yields can weigh on investment demand even while the projected physical deficit offers longer-term support.
Kitco Also Bearish
The near-term chart looks a bit fragile. Kitco’s Thursday market note identifies support near the $49.59 level in the spot market and resistance from $50.12 to $51.14, with $52.39 as the next upside reference. If silver can reclaim the first area, these technical markers can and will change. That being said, a substantial break below $49.59 could keep the weakening decline in control.
Neutral to Bearish Bias
My bias at the moment for silver is neutral to bearish below all of those numbers. The deficit is real as a forecast, but a smaller projected gap and ETP outflows reduce the urgency of the shortage argument, especially when we have high real yields.
Next week’s Federal Reserve minutes on November 18 may move rate expectations. The delayed CFTC report due on Monday can show whether traders cut long exposure during the sell-off. The Federal Reserve’s November 17 industrial production report is another check on the factory backdrop.
Poor Looking Chart
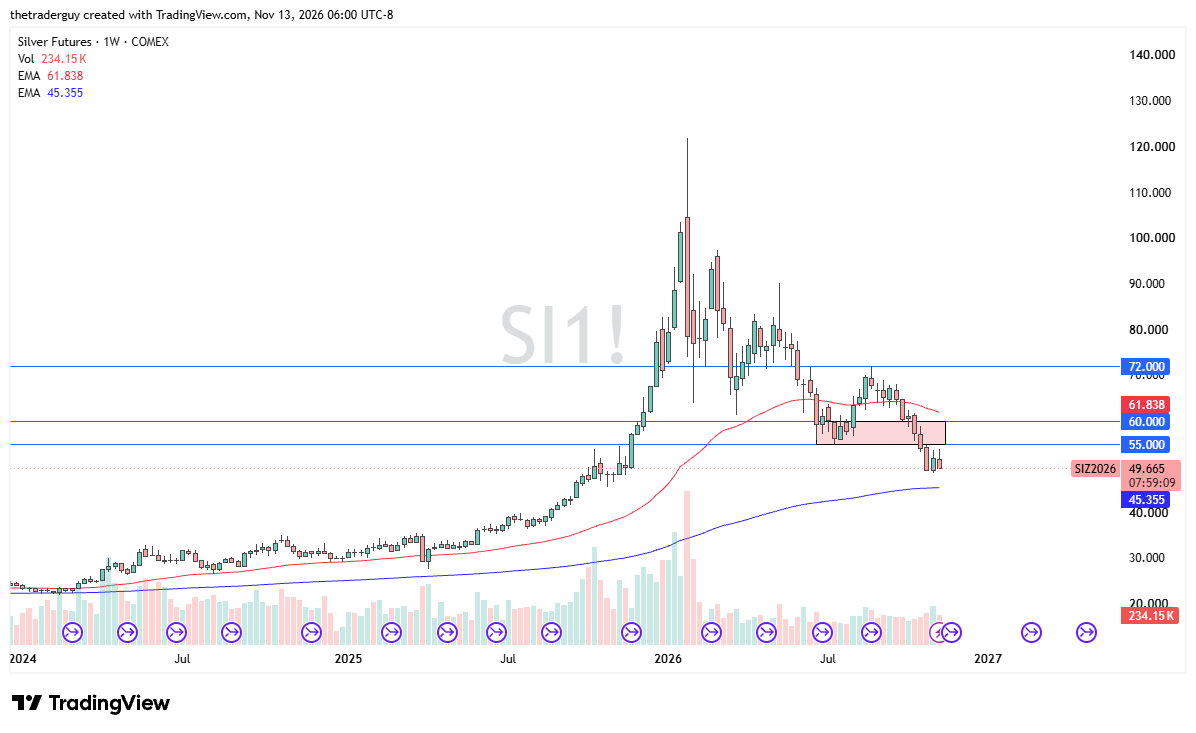
That being said, this is a chart, to me, that looks very ugly, and I do think it continues to see plenty of sellers on rallies. I plan on fading rallies in the silver market until something substantially changes in the Treasury yield world.
If you’d like to know more about how to trade gold and silver, please visit our educational area.