



S&P 500 rebounded on Friday after the AI-driven sell-off on Thursday. The market still remains under pressure despite the rebound as the strong US jobs data revived concerns about rate hikes. The uncertainty about the regulation of data centers also clouds the outlook for technology stocks. The market needs to break above 7,450 to improve the outlook in the short term.
S&P 500 Rebounds After AI Sell-Off Breaks Support
The sharp selloff in S&P 500 on Thursday erased the post-election gains of Wednesday. The S&P 500 dropped to 7,350 on Thursday and closed below the key support of 7,450. The index is now recovering on Friday to reach the breakout area of 7,450.
The hopes of de-escalation in the Middle East after US midterm election continue to compete with the risk of supply disruptions from attacks on shipping. Crude oil prices rebounded on Thursday but closed the week with a loss. Further disruptions around the Strait of Hormuz may revive concerns about inflation.
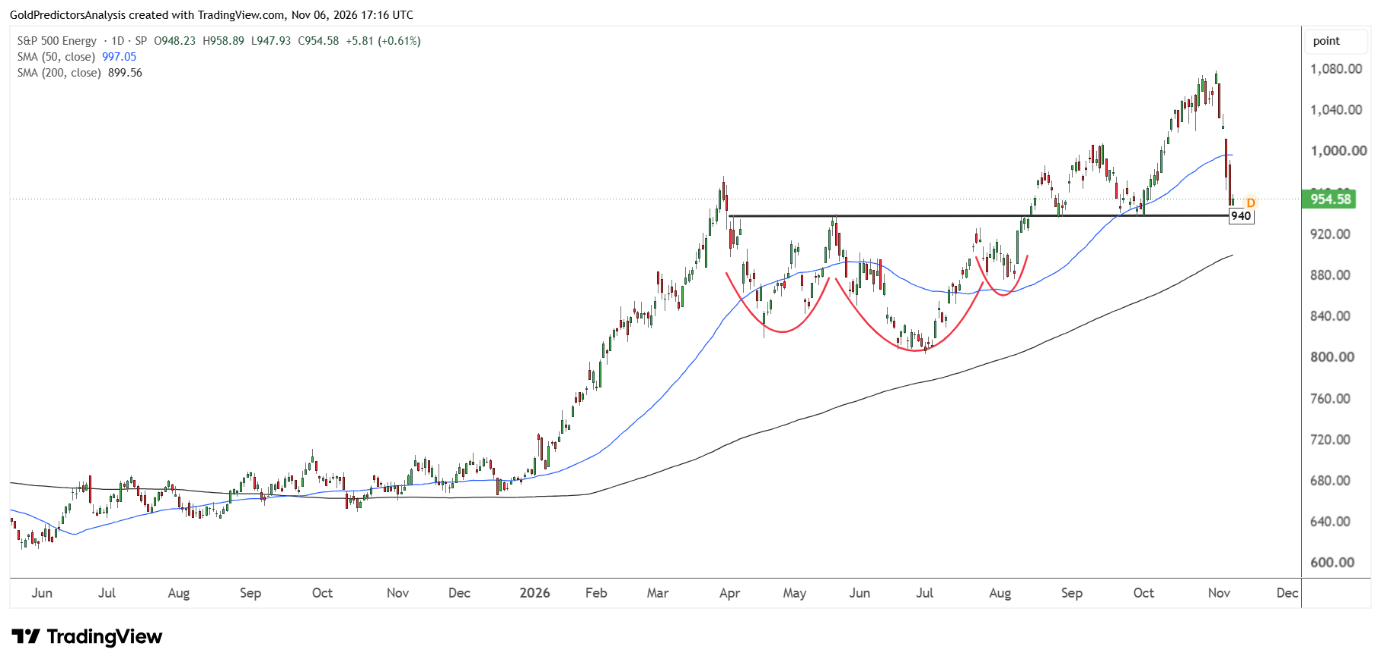
The chart below shows that S&P 500 energy index continued to drop near the support level of 940. This support is defined by the neckline of inverted head and shoulders. The energy index rebounds on Friday from this support area. A confirmed break below the neckline at 940 will suggest further downside in energy stocks. But a recovery above the 1,000 level near the 50-day SMA may suggest continued rally in energy stocks.
S&P 500 Price Forecast
Every new S&P 500 analysis as it publishes, today's technical signal and key levels, live price — on one page.
See all S&P 500 forecastsAI Concerns Keep Semiconductor Stocks Under Pressure
Nvidia Corp. (NVDA) dropped over 9% on Thursday and the Philadelphia Semiconductor Index plunged more than 12%. Chip stocks rebounded on Friday which pushed the semiconductor index up over 4%. The sharp reversal in semiconductor index highlights heavy volatility.
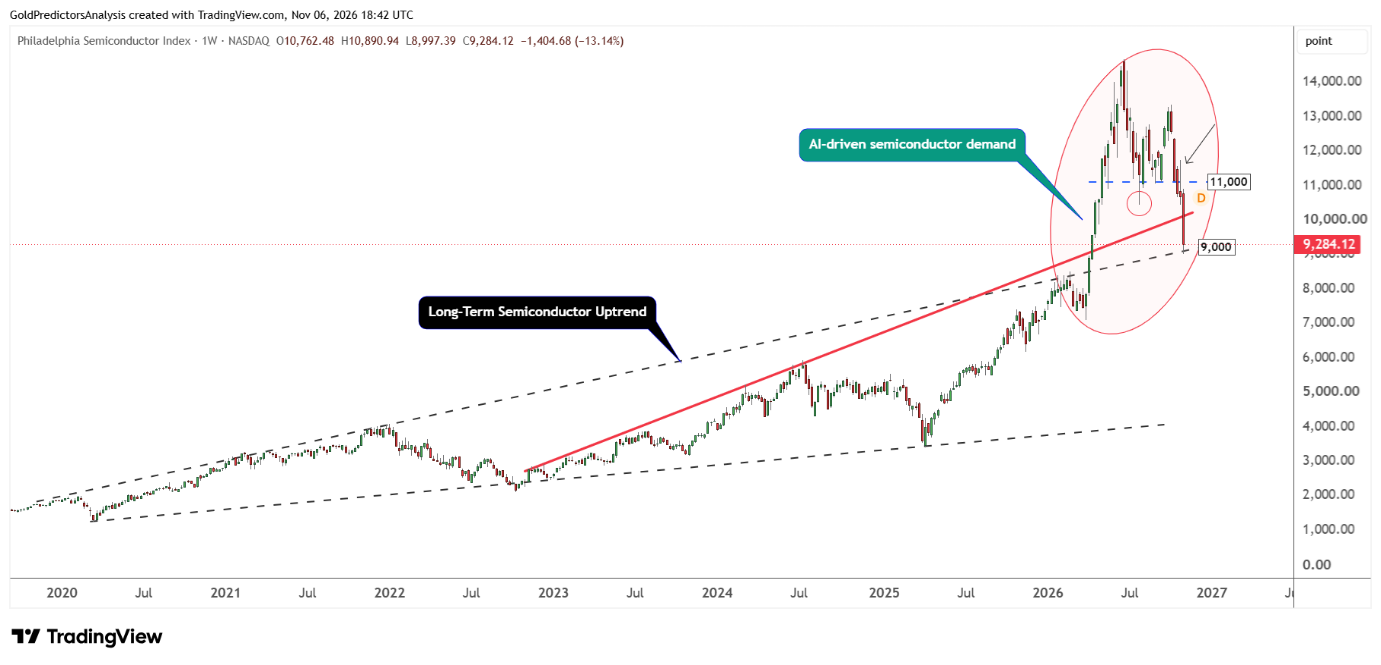
The chart below shows that the semiconductor index has dropped more than 25% since the peak of October 2026. The index has hit the long term trend line at 9,000 and started to rebound on Friday.
The market fears that Democratic victories in Congress and key states may bring tighter scrutiny of construction of data centers. The slow approvals or restrictions on expansion may weaken the expected growth in demand for chips, power and equipment. The market is reacting to possible changes in policy. The negative trend in semiconductor stocks has kept bearish pressure on Nasdaq 100.
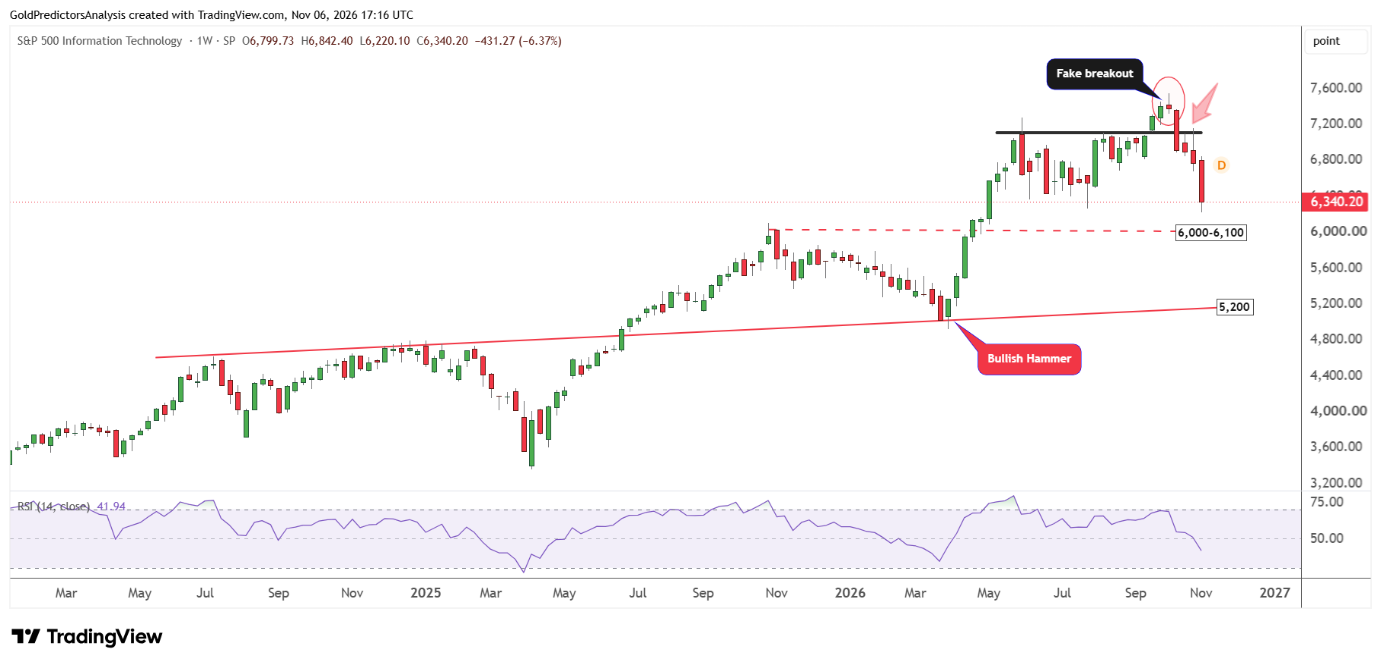
The S&P 500 Information Technology Index also lost over 6% for the week and remains under bearish pressure. The index is now moving towards the key support of 6,000-6,100. If Information Technology index continues to drop toward this zone, it may attract buyers in technology stocks. This support is defined by the highs of October 2025.
Strong US Jobs Data Revives Rate-Hike Fears
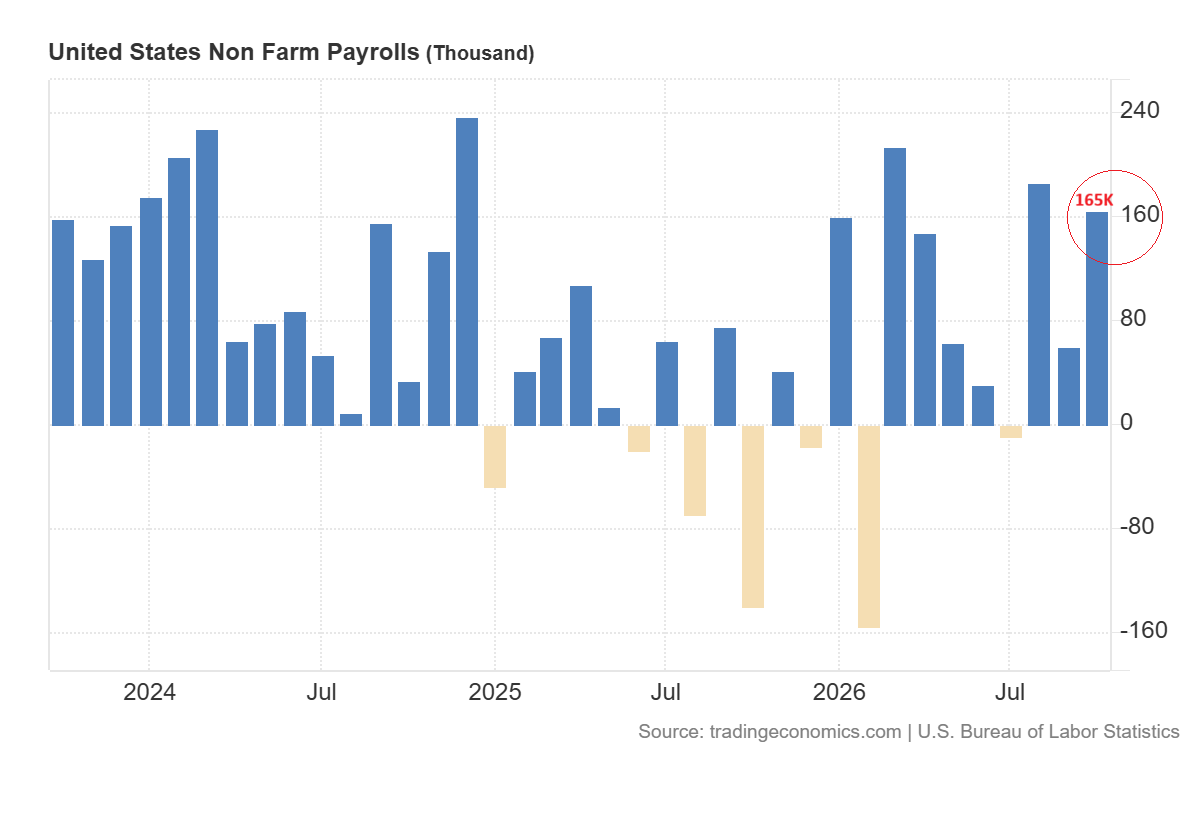
The chart below shows that US employers added 165,000 jobs in October as compared to the 60,000 jobs in September.
The unemployment rate dropped to 4.1% and average hourly earnings increased by 0.4% in October. This data suggests a strong labor market and suggests further tightening by the Fed.
US dollar index rallied after the release of US jobs data. The strong jobs data increased the expectations of rate hike in December to 80%. This renewed rate pressure complicated the recovery in equities.
The ISM services data also shows continued growth. The chart below shows that the ISM Services PMI dropped to 54.5 in October from 54.9 in September.
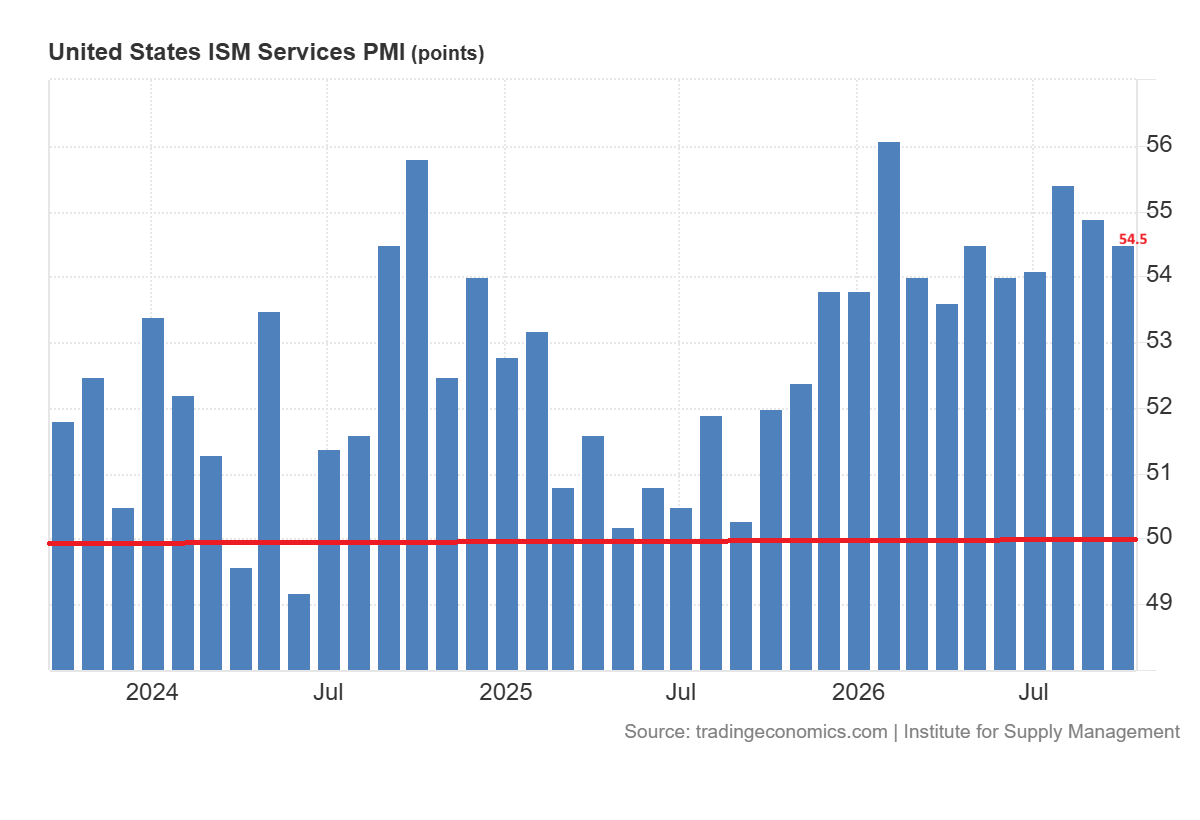
The ISM services prices index also dropped to the 73 level in October but it still remains high. The chart shows consistent pressure on prices since 2025.
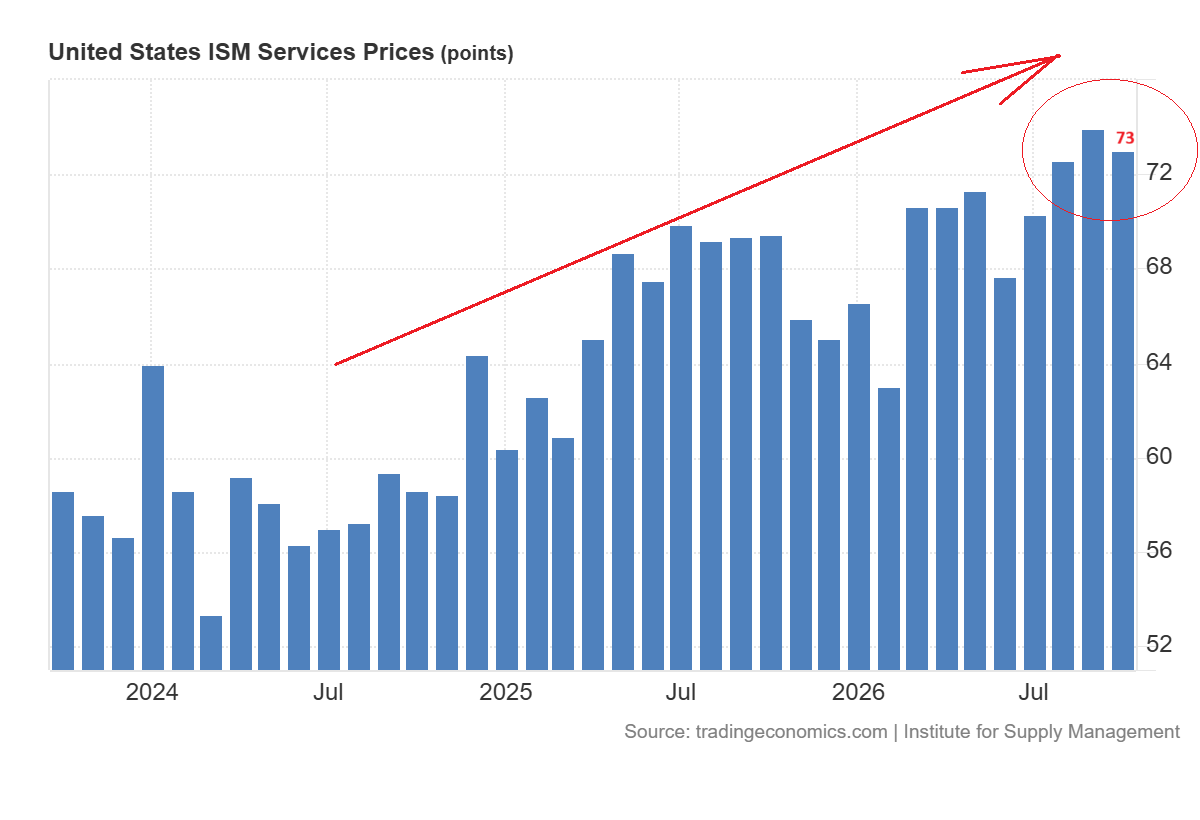
This data supports the growth outlook and leaves room for further monetary tightening due to pressure on prices.
S&P 500 Technical Analysis: Can Buyers Reclaim 7,450?
Weekly Chart: Breakdown Puts the Recovery Under Pressure
The weekly chart for the S&P 500 shows that the index failed to break above 7,800 and dropped lower. Despite this drop, the long-term price action still remains bullish. This bullish price action is evident in inverted head and shoulders pattern from November 2021 to November 2023.
The head of this pattern was formed in October 2022 with low at the 3,491 level. The shoulders were formed in February 2022 with the low at 4,114 and in October 2023 with the low at the 4,103 level.
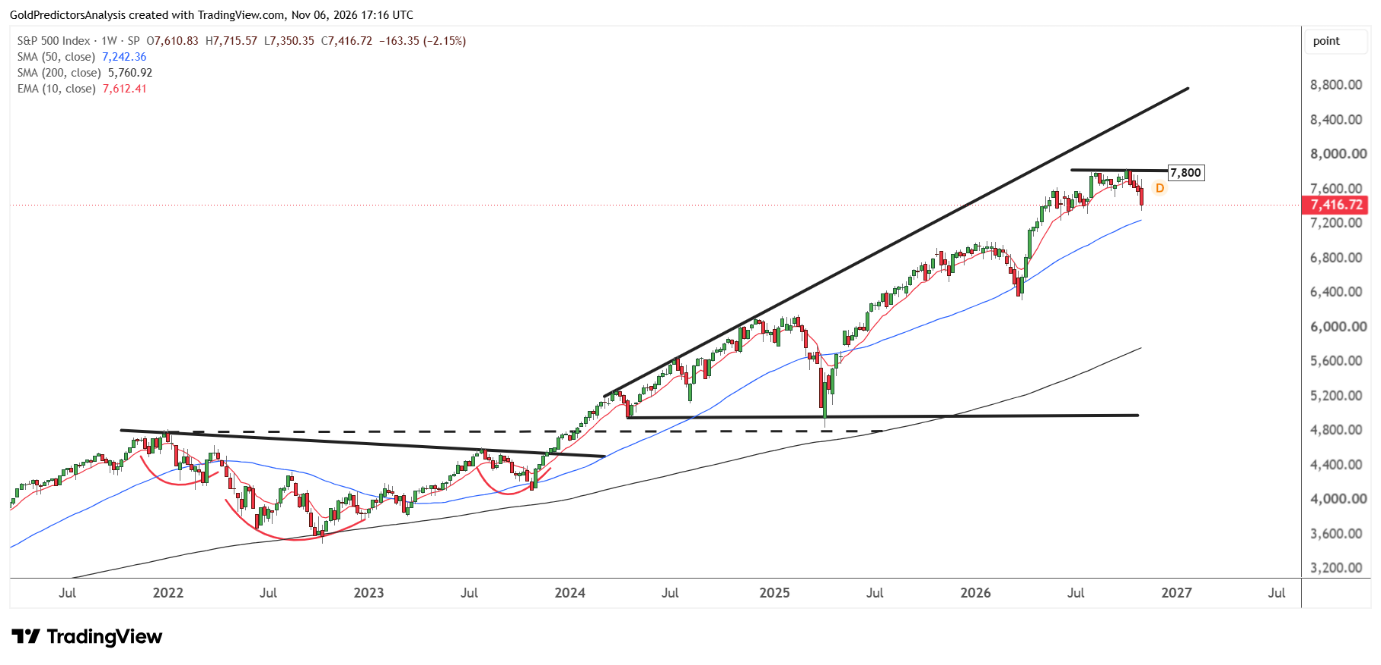
The breakout from the neckline of this pattern in November 2023 at 4,525 has triggered a strong surge in the index to record high at the 7,844 level. The index then formed a triangle pattern with a base at the 5,000 level. The resistance of this triangle reaches up to the 9,000 area. Each time the index corrects lower, it produces a low and then rallies higher again.
It is observed that the index has been consolidating between 7,800 and 7,450 during the past three months. However, the selloff on Thursday has broken the support level of 7,450. This breakdown is now pushing the index toward the key support level which is defined by the 50-week SMA near 7,240.
The index needs to break above 7,800 to open the way for a rally toward 8,500 in the long term.
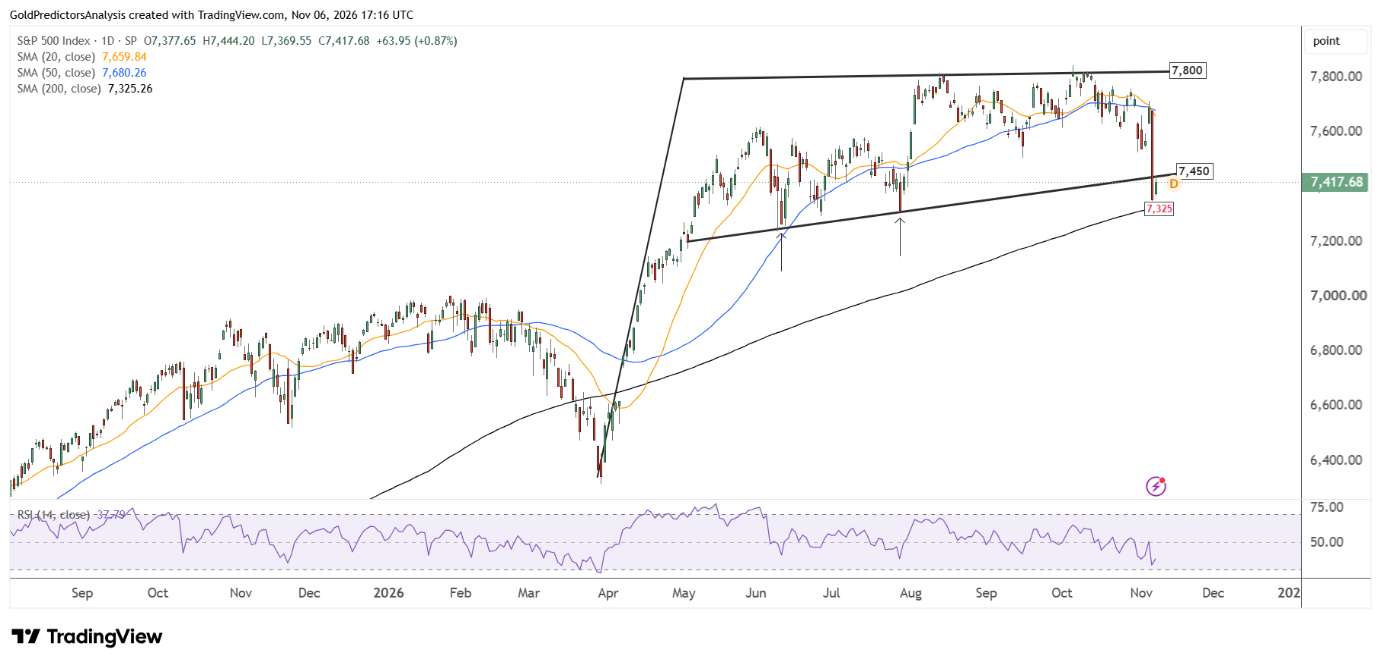
SPX Daily Chart: 7,450 Resistance and 7,325 Support
The daily chart below shows that the selloff on Thursday has broken the key support of 7,450. After the breakout, the index is now looking toward the 200-day SMA at 7,325. A break below 7,325 will likely trigger deeper correction. But a recovery above 7,450 may open the way for further upside toward 7,800.
What to Watch Next
S&P 500 rebounded on Friday after the strong selloff on Thursday, but still remains under bearish pressure. The jobs data from the US was strong which keeps concerns about rate hikes alive. The uncertainty about AI policy also weighs on technology stocks. Oil prices also rebounded from the support areas on Thursday. If oil prices continue to rally from the support area, it may renew inflation pressure. A break above 7,450 in the index may open the way for move to 7,800. But a break below 7,325 may create deeper correction for the index.
Read more: Chip Stocks Rebound After US Midterm Sell-Off